This article was published as a part of the Data Science Blogathon
Introduction
When it comes to investing it is difficult to find quality companies worthy of your hard-earned money. Fortunately, brokerages and banks such as Bank of America (BofA) invest hundreds of millions of dollars in research trying to identify quality companies. Bank of America classifies its stocks under various lists. A few of those lists are High Quality and Dividend Yield, US 1, Endeavor, and the Top-Rated Stocks list.
Here are the descriptions of a couple of these lists:
The top-rated stocks list contains companies that are buy-rated by Bank of America and 4-star or 5-star rated by both CFRA and Morningstar. Bank of America picks the stocks for the High Quality and Dividend Yield list based on several criteria. Here’s how Bank of America describes its high-quality list:
“We believe that the following screening factors are likely to uncover higher-quality companies that offer a relatively secure dividend yield. The stocks are selected from the S&P 500 and exclude financial stocks due to metric incomparability with other sectors.
-
S&P Common Stock Rank of A+, A, or A-. The S&P Common Stock Rankings are our main measure of quality. These rankings are based primarily on the growth and stability of earnings and dividends over a 10-year period.
-
Return on equity (ROE) is greater than that of the S&P 500 ROE.
-
Debt/Equity is lower than that of the S&P 500.
-
Trailing 12-month dividend yield greater than that of the S&P 500.
-
BofA investment rating indicates “Buy” or “Neutral” as well as BofA income rating of “7”, indicating the potential cash dividends are considered likely to remain the same or higher.
-
The ratio of the last 12-months’ free cash flow to dividends (FCF/Div) must be greater than 1.0.”
Source: Bank of America
These lists are regularly updated by the analysts at Bank of America based on the criteria they set for each list. I wanted to analyze the returns of the stocks that are currently on the list and more recent deletions. I have clustered the returns of 139 either current or past companies.
The Goal
Looking at the returns of even a dozen companies will be tricky, analyzing and grouping over one hundred stocks manually can be impossible. Cluster analysis could help by grouping the return so that you can now focus on each group rather than trying to decide based on individual stocks. I started with the hypothesis that I should be able to group the companies into three clusters:
-
Buy
-
Sell
-
Hold
My hypothesis was that the “Buy” group would-be stocks that have not run up a lot. In other words, they have the lowest returns of the three groups. These would be the stocks an investor could consider buying. The “Sell” list would be the companies that have had tremendous returns. These would-be stocks that an investor can consider selling. Finally, the “Hold” list are the stocks that have done well compared to the “Buy” stocks but have lower returns than the “Sell” stocks. If an investor already owns some of these stocks it may be good to continue holding them, because they either may be steady performers or may have higher gains in the future.
If the returns were evenly distributed across these three categories, the groups themselves would be large with approximately 46 stocks in each category. There is a possibility that within these three groups there could be widespread dispersion of returns. So, three clusters may not be the optimal number of clusters.
I also wanted to see how the cluster would change when I account for the following combinations of return data.
-
In the first clustering test, I included returns up to 6 months.
-
This includes the 5-day, 1-month, 3-month, and 6-month returns.
-
In the second clustering test, I included returns up to one year.
-
This includes the 5-day, 1-month, 3-month, 6-month, and 1-year returns.
-
In the third clustering test, I included returns up to two years.
-
This includes the 5-day, 1-month, 3-month, 6-month, 1-year, and 2-year returns.
The Process
I took the following return data about each of the 139 stocks from IEXCloud.io:
-
5-Day Return
-
1-Month Return
-
3-Month Return
-
6-Month Return
-
1-Year Return
-
2-Year Return.
I used the k-means clustering algorithm to group the returns.
Retrieving data from IEX Cloud using Python
from iexfinance.stocks import Stock
stockReturn = Stock(, token="",
output_format='json')
stockKeystats = stockReturn.get_key_stats()
Each of the key stats for a stock can be accessed from the JSON like this:
stockKeystats ['day5ChangePercent']
This data is stored in a CSV file.
I read this data into R using the following command:
mydata = read.csv("")
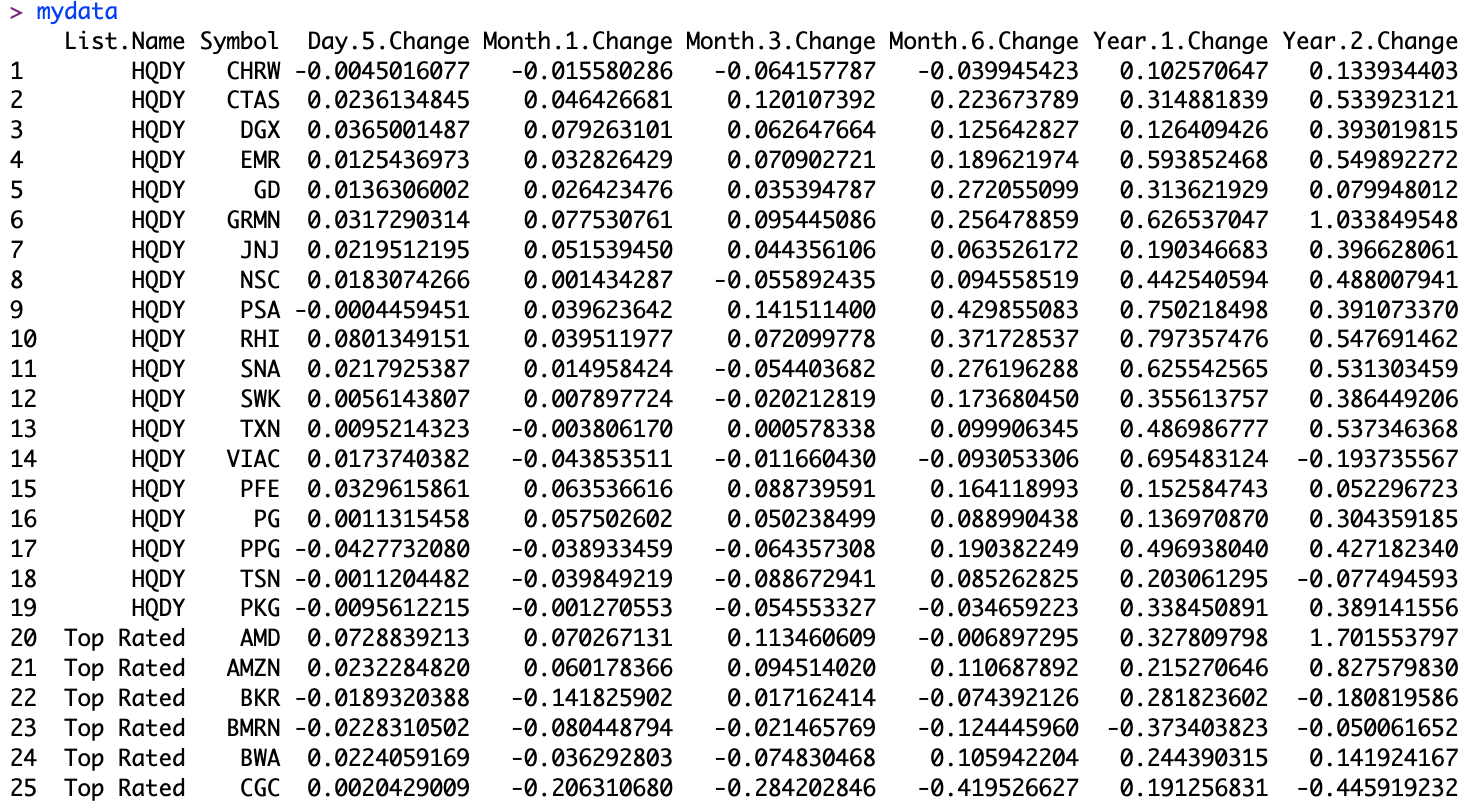
This produces a data frame with the following columns:
-
List. Name: Which of the four lists does the stock belong to?
-
Symbol: The ticker symbol for the stock
-
Day.5.Change: The percentage change in the stock price in the last five days.
-
Month.1.Change: The percentage change in the stock price in the last month.
-
Month.3.Change: The percentage change in the stock price in the last three months.
-
Month.6.Change: The percentage change in the stock price in the last six months.
-
Year.1.Change: The percentage change in the stock price in the last year.
-
Year.2.Change: The percentage change in the stock price in the last two years.
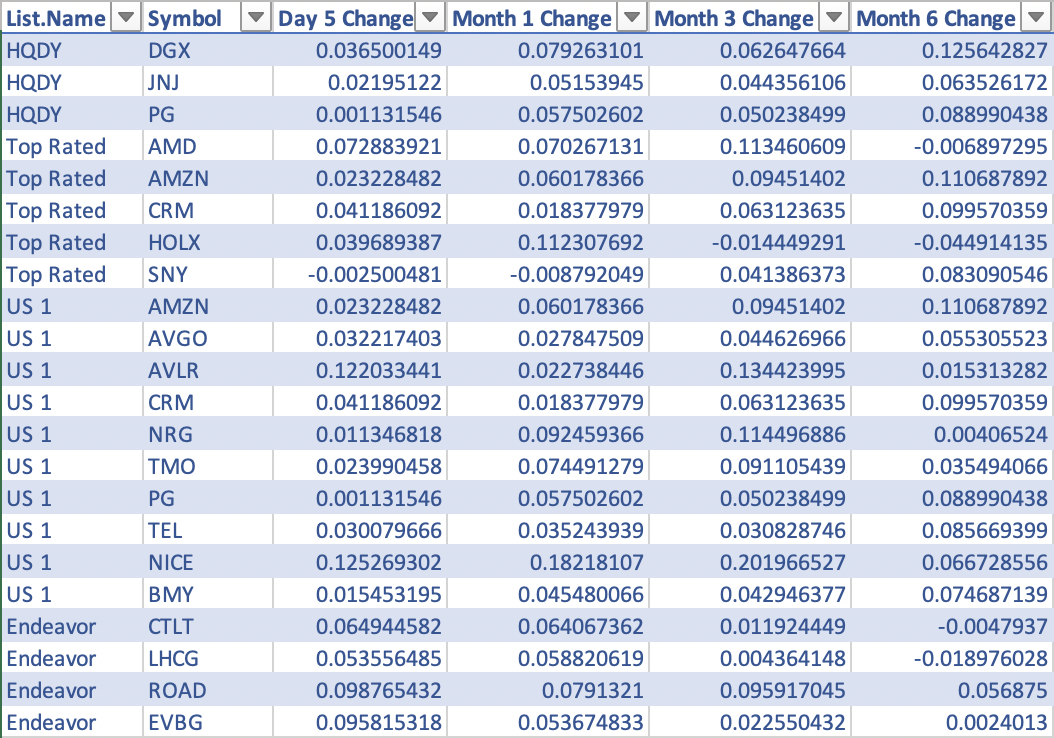
Here is a screenshot from R showing the data frame:
Exhibit: The Data Frame in R
The K-means clustering can be done with the following command in R:
clusters = kmeans(subset(mydata, select=-c(Symbol,List.Name,Year.1.Change, Year.2.Change)), centers=3, nstart=25)
With the subset command, I was able to ignore the columns that you do not wish to be part of the cluster analysis such as symbol and the name of the list that the stock belongs to. In the above command, I have also removed the “Year.1.Change” and the “Year.2.Change”. So, this clustering will only include data up to the previous six months. The “nstart” argument is set to 25. This allows R to run the clustering 25 times each with different centers and pick the most optimal one. I also set the centers as 3. This allows the k-means algorithm to create three clusters.
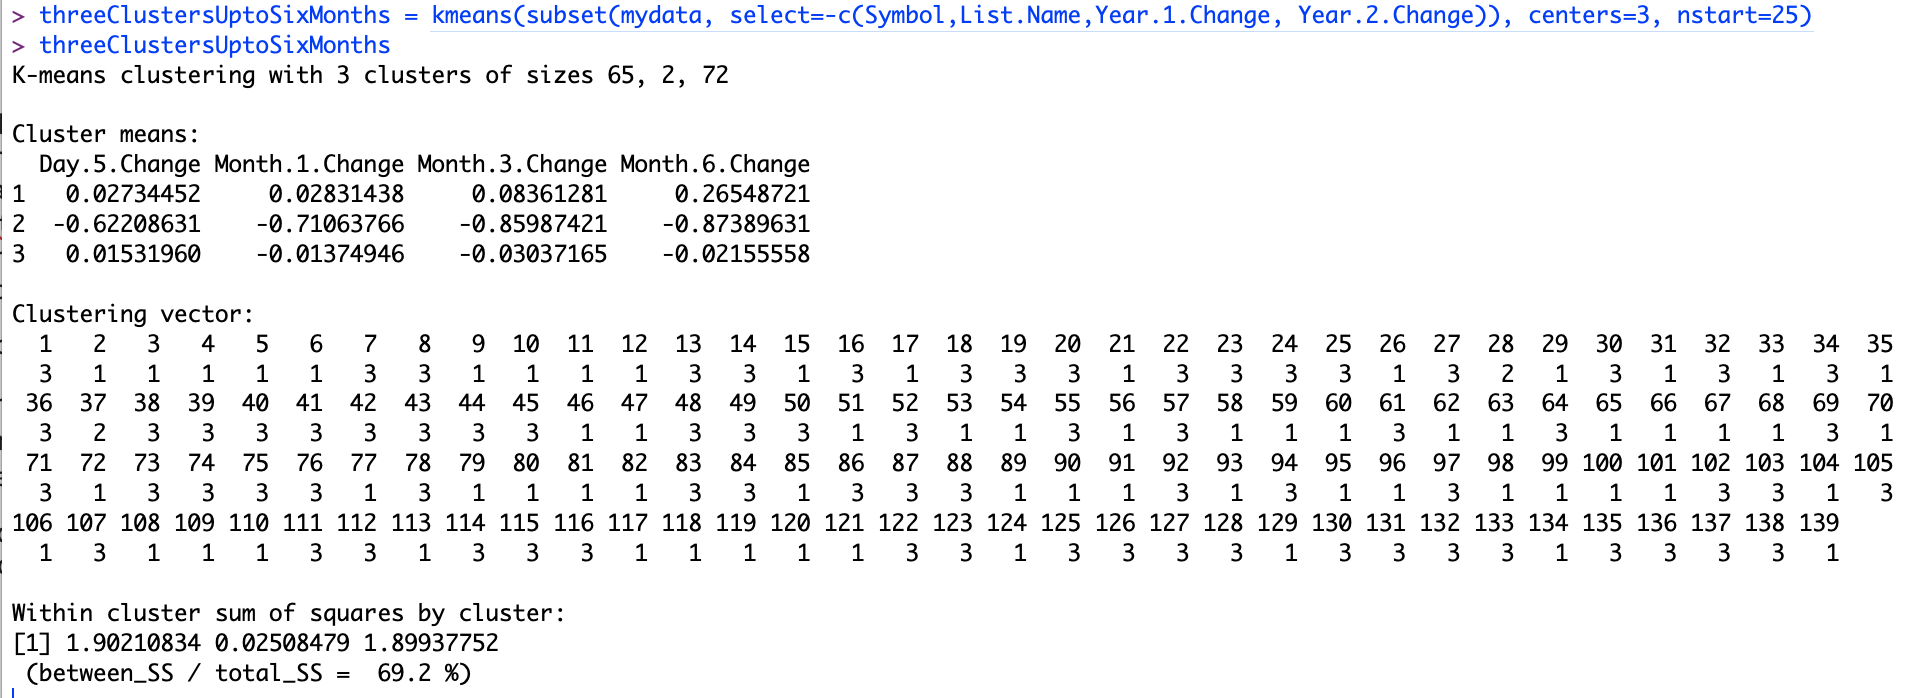
Once I ran this, I immediately hit a problem. My three clusters turned out this way:
-
Cluster 1 had 65 stocks in them.
-
Cluster 2 had just 2 stocks in them.
-
Cluster 3 had the rest of the 72 stocks.
The groups were still too big and did not lend themselves to easy analysis even within the groups. There was another insight from doing the 3 groups. The ratio of “between_ss” to “total_ss” came to 69.2%. I felt I could improve on this by increasing the number of centers. Here is the result from 3 centers:
Exhibit: Clustering with Three Centers
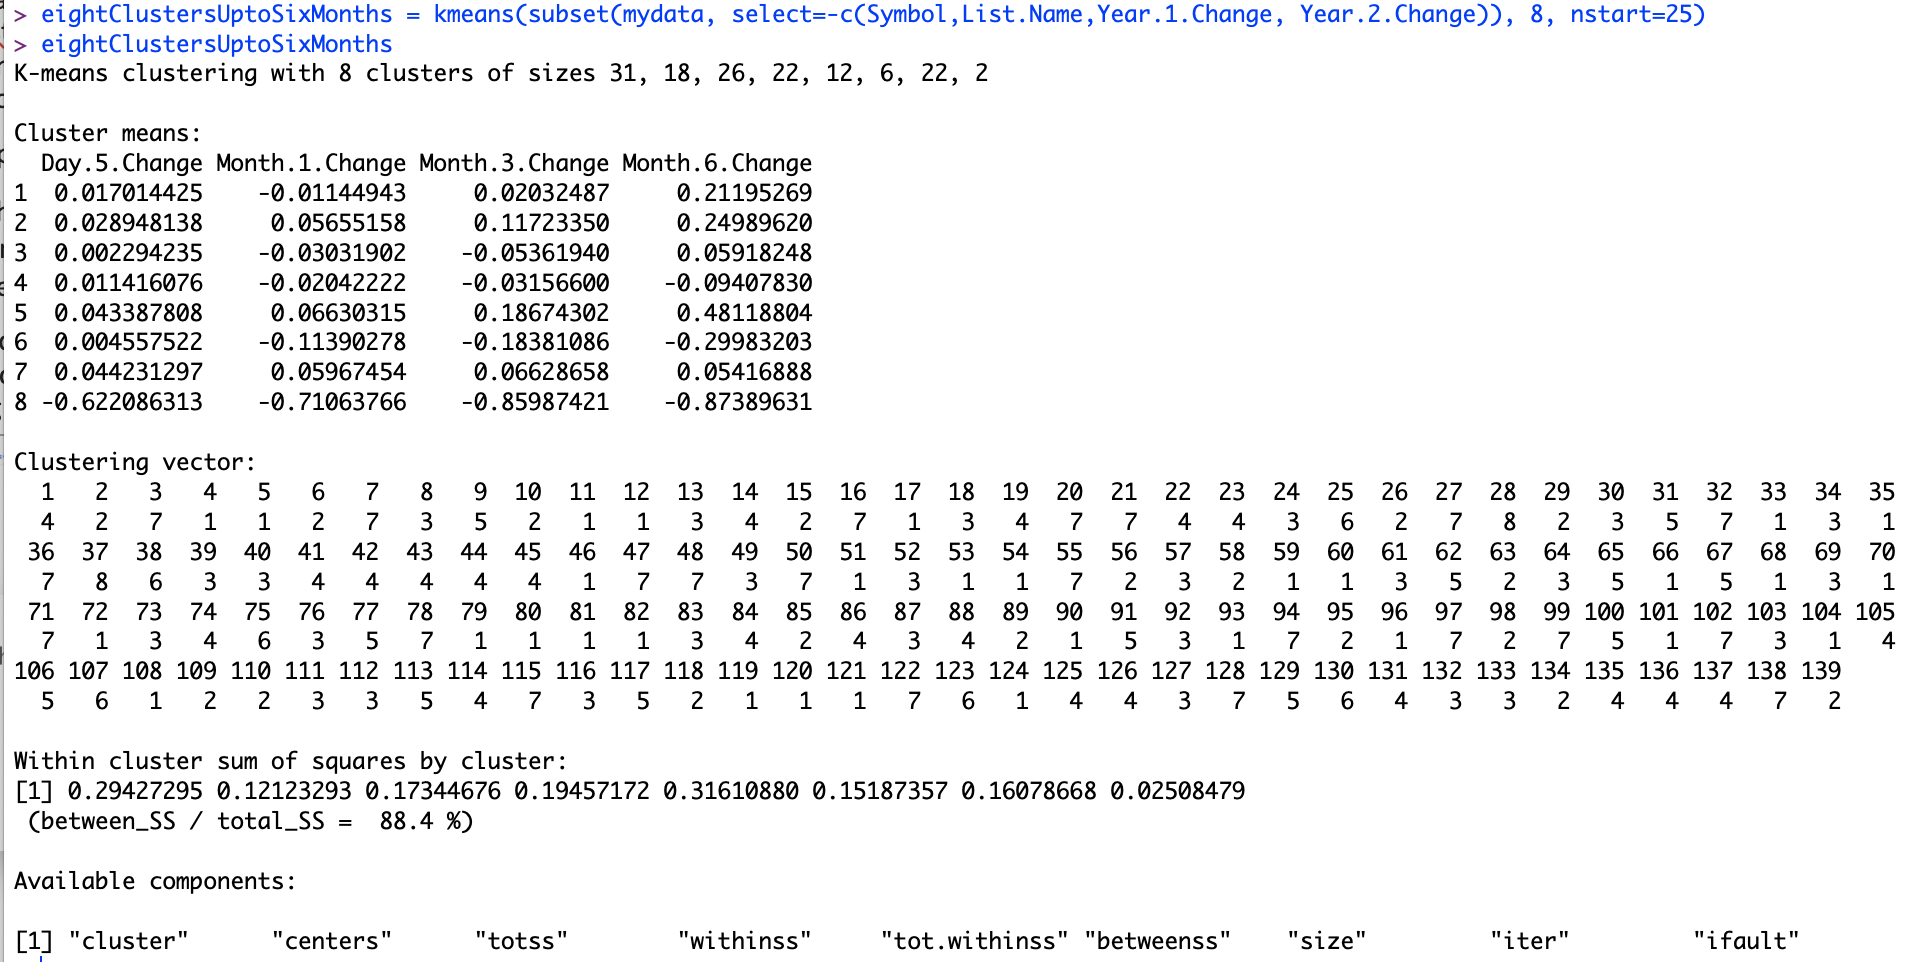
After several iterations, I settled on 8 centers. This gave me a manageable group of stocks in each cluster that I could analyze further.
Exhibit: Clustering with Eight Centers
The Results
The cluster sizes were 31, 18, 26, 22, 12, 6, 22, and 2.
I selected the fifth cluster which had a total of 12 companies. Remember, I had run this analysis with up to the past six months of returns. Alphabet (Symbol: GOOGL) appears in both the top-rated stocks list and the US 1 list, so this fifth cluster contains 11 companies.
Exhibit: The Fifth Cluster with 12 Stocks
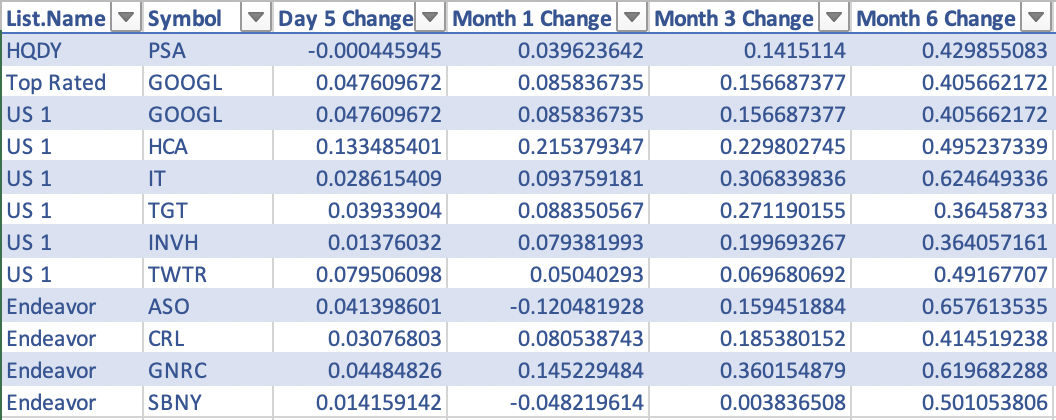
In this cluster, all four lists are represented. Comparing the returns of HCA (HCA Healthcare) and GOOGL (Alphabet), we find that HCA had a huge run in the last five days posting a double-digit return of 13.3% compared to a more pedestrian return of 4.7% for GOOGL. TWTR (Twitter) had remarkably similar 6-month returns compared to HCA, but TWTR did not have double-digit returns in the 5-day, 1-month, or 3-month. We do have a wide distribution of 6-month returns within this group. We have ASO (Academy Sports and Outdoors) with a 65.7% return and TGT (Target) with a 36% return.
Cluster seven is another interesting group of stocks.
Exhibit: The Seventh Cluster with 22 Stocks
You find AMZN (Amazon) in this list with an 11.06% return in 6 months. You can also find HOLX (Hologic) which had a –4.4% return in the past six months. This group of stocks has not had large returns in the past six months. Further research and analysis may reveal whether these stocks have more returns to come. The raw data along with the various clusters can be found on Github here.
Photo by Markus Spiske from Pexels


