How to treat outliers in a data set?
This article was published as a part of the Data Science Blogathon
Introduction
When we started our data science journey and worked with our first data set for example the iris data set, we did not have to do data cleaning but the real-world data sets are far from perfect. There are many shortcomings in the data set which should be dealt with before fitting any model to it. If the data is not treated well, it might lead to biases and the results will not be reliable. This is where the exploratory data analysis comes into the picture.
There are multiple steps involved in the exploratory data analysis like identifying all the variables and their data types, univariate and bivariate analysis, handling missing values, dealing with the outliers, etc. It is always advisable to never skip the exploratory data analysis step during any model building. One of the most important steps in exploratory data analysis is outlier detection. Outliers are extreme values that might do not match with the rest of the data points. They might have made their way to the dataset either due to various errors. There are numerous ways to treat the outliers but based on the dataset we have to choose the best method.
Let us look at all the steps involved in understanding outliers and dealing with them.
What are outliers?
“A celebrity in the crowd of commoners is an outlier”

Image Source : Google Images https://wallhere.com/en/wallpaper/253405
The above statement might have given a fair clue about what are outliers. Anomalies of Outliers are those data points that lie at a great distance from the rest of the data like a sudden increase or decrease by many folds or in the simple world an outlier is a value that lies outside the range of all other values in the dataset. For example, while measuring the body temperature of patients in a hospital there was an entry of 988 degrees Celsius which is clearly incorrect. There might be a missing decimal point like it should have been 98.8 instead of 988.
Another example is while measuring the weights of high school students, there was an entry with a weight of 1234 which is highly unlikely. It could be a data entry error. It is not necessarily that an outlier is always an erroneous entry, in some cases, it could the result of some experiment but it’s up to the data scientist to decide. The range of outliers depends on business problems and can change from case to case. It’s always best to discuss with the business stakeholders before terming a data point as an outlier. The outliers need special attention so that they don’t cause any issues in the model results.
How do they affect the calculation/ biases due to outlier
If the outliers are not treated in the first step while doing the exploratory data analysis, it can lead to biases in the results. There are many unfavorable impacts created by a bias which could lead to poor business decisions and ultimately a loss to the business.
“Avoiding bias starts by recognizing that data bias exists, both in the data itself and in the people analyzing or using it,” said Hariharan Kolam, CEO, and founder of Findem said in his speech. The bias can not only be introduced by data but also by the one working on it. The biases can be introduced subconsciously but they will be there, we just have to make sure that before modeling the data, these biases are dealt with and make sure that they don’t possess any threat to our end results.
Different algorithms to treat outliers
There are numerous machine learning algorithms to treat outliers out of which the following are the most popularly used, lets look at each algorithm in detail with examples.
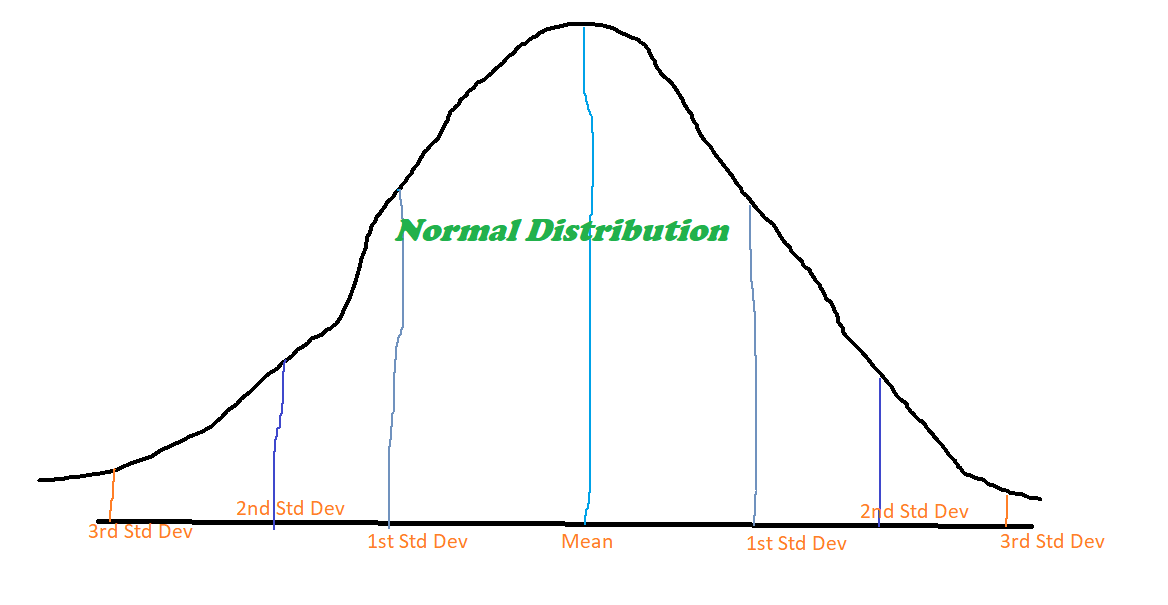
Z score test
Z score test is one of the most commonly used methods to detect outliers. It measures the number of standard deviations away the observation is from the mean value. A z score of 1.5 indicated that the observation is 1.5 standard deviations above the mean and -1.5 means that the observation is 1.5 standard deviations below or less than the mean.
Z score = (x -mean) / std. deviation
Where x is the data point
If the z score of observation is 3 or more it is generally treated as an anomaly or an outlier.

Let us use the above table and detect the outliers in the weights of students by finding their z score
import pandas as pd
import scipy.stats as stats
student_info = pd.read_excel('student_weight.xlsx')
z_score = stats.zscore(student_info['weights(in Kg)'])
print(z_score)
Output
[-0.30359971 -0.32843404 -0.35326838 -0.34085121 -0.37189413 -0.34085121-0.29739113 2.99936649 -0.32843404 -0.33464263]
We can clearly see that entry 588 is an outlier and the same is confirmed by the z score test.
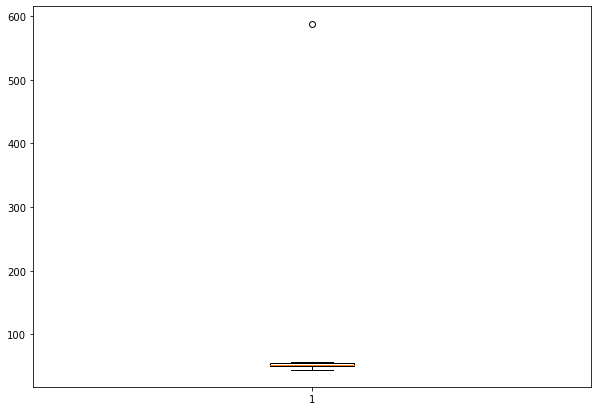
Box plot
The box plot shows the distribution of the data points by dividing them into different quartiles. The box plot marks the minimum, maximum, median, first, and third quartiles of the dataset. These percentiles are also known as the lower quartile, median and upper quartile. This is one of the visual methods to detect anomalies. Any outliers which lie outside the box and whiskers of the plot can be treated as outliers.
import matplotlib.pyplot as plt
fig = plt.figure(figsize =(10, 7))
 plt.boxplot(student_info['weights(in Kg)'])
 plt.show()
The below graph shows the box plot of the student’s weights dataset. The is an observation lying much away from the box and whiskers of the box which shows that this data point is an outlier.
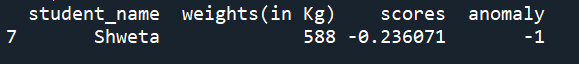
Isolation Forest
The isolation forest algorithm is an easy to implement yet powerful choice for outlier detection. Isolation Forest is based on the decision tree algorithm as it isolates the outliers from the dataset by selecting a random feature and a split value between the maximum and minimum values of the selected feature.
The isolation forest method is preferred over other methods when the data set is huge and has many features as it uses lesser memory compared to other techniques.
Below is the code for detecting outliers using isolation forest
from sklearn.ensemble import IsolationForest
model=IsolationForest(n_estimators=50, max_samples='auto', contamination=float(0.1),max_features=1.0)
model.fit(student_info[['weights(in Kg)']])
student_info['scores']=model.decision_function(student_info[['weights(in Kg)']])
student_info['anomaly']=model.predict(student_info[['weights(in Kg)']])
anomaly=student_info.loc[student_info['anomaly']==-1]
anomaly_index=list(anomaly.index)
print(anomaly)
Output
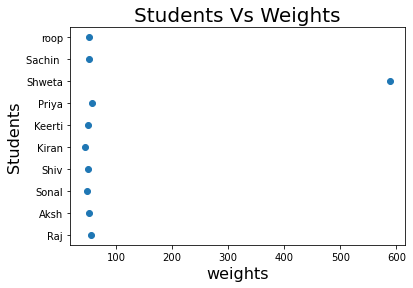
DBSCAN
Density-based spatial clustering of applications with noise or popularly known as DBSCAN is a clustering algorithm.DBSCAN like any other clustering algorithm divides the dataset into different groups by checking their aggregation with other data points and the observations which fail to aggregate are termed as outliers.
from sklearn.cluster import DBSCAN
model = DBSCAN(eps=0.8, min_samples=10).fit(student_info[['weights(in Kg)']])
X = model.labels_
plt.scatter(student_info['weights(in Kg)'], student_info['student_name'], marker='o')
plt.xlabel('Students', fontsize=16)
plt.ylabel('Weights', fontsize=16)
plt.title('Students Vs Weights', fontsize=20)
plt.show()
How to treat them?
It might be tempting to just remove the records where there are outliers in the data set but it’s not always the best approach. The outlier treatment method can vary from case to case and should be discussed with the business before finalizing the method. There are different approaches such as replacing the outlier with the mean value, or median value or in some cases dropping the observation with the suspected outlier so as to avoid any bias in them. We tend to delete the outlier if they are due to data entry errors caused due to human error, data processing errors.
Depending on the size of the data set it is advisable to treat the outliers separately during model fitting and build a different model which can fit the outliers and a separate model for the rest of the dataset but this process can be time-consuming and add to the cost.


