Introduction
Hypothesis testing is the detective work of statistics, where evidence is scrutinized to determine the truth behind claims. From unraveling mysteries in science to guiding decisions in business, this method empowers researchers to make sense of data and draw reliable conclusions. In this article, we’ll explore the fascinating world of hypothesis testing, uncovering its importance and practical applications in data analytics.
In this comprehensive guide, we will be learning the theory and types of hypothesis testing. Additionally, we will be taking sample problem statements and solving them step-by-step using hypothesis testing. We will be using Python as the programming language.

Learning Objectives
- Understand what hypothesis testing is and when to use it.
- Get familiar with various terminologies used in hypothesis testing.
- Learn the steps of hypothesis testing and how to apply it to various problems.
- Learn about decision rules and confusion matrix in hypothesis testing.
- Differentiate between different types of hypothesis tests.
This article was published as a part of the Data Science Blogathon!
Table of Contents
What is Hypothesis Testing and When Do We Use It?
Hypothesis testing is a statistical method used to evaluate a claim or hypothesis about a population parameter based on sample data. It involves making decisions about the validity of a statement, often referred to as the null hypothesis, by assessing the likelihood of observing the sample data if the null hypothesis were true.
This process helps researchers determine whether there is enough evidence to support or reject the null hypothesis, thereby drawing conclusions about the population of interest. In essence, hypothesis testing provides a structured approach for making inferences and decisions in the face of uncertainty, playing a crucial role in scientific research, data analysis, and decision-making across various domains.
Hypothesis testing is a part of statistical analysis and machine learning, where we test the assumptions made regarding a population parameter.
We use hypothesis testing in various scenarios, including:
- Scientific research: Testing the effectiveness of a new drug, evaluating the impact of a treatment on patient outcomes, or examining the relationship between variables in a study.
- Quality control: Assessing whether a manufacturing process meets specified standards or determining if a product’s performance meets expectations.
- Business decision-making: Investigating the effectiveness of marketing strategies, analyzing customer preferences, or testing hypotheses about financial performance.
- Social sciences: Studying the effects of interventions on societal outcomes, examining attitudes and behaviors, or testing theories about human behavior.
Note: Don’t be confused between the terms Parameter and Satistic.
A Parameter is a number that describes the data from the population whereas, a Statistic is a number that describes the data from a sample.
Before moving any further, it is important to know the terminology used.
Terminology Used in Hypothesis Testing
In hypothesis testing, several key terms and concepts are commonly used to describe the process and interpret results:
1. Null Hypothesis (H0): Null hypothesis is a statistical theory that suggests there is no statistical significance exists between the populations. It is denoted by H0 and read as H-naught.
2. Alternative Hypothesis (Ha or H1): An Alternative hypothesis suggests there is a significant difference between the population parameters. It could be greater or smaller. Basically, it is the contrast of the Null Hypothesis. It is denoted by Ha or H1.
Note: H0 must always contain equality(=). Ha always contains difference(≠, >, <).
For example, if we were to test the equality of average means (µ) of two groups:
for a two-tailed test, we define H0: µ1 = µ2 and Ha: µ1≠µ2
for a one-tailed test, we define H0: µ1 = µ2 and Ha: µ1 > µ2 or Ha: µ1 < µ2
3. Test Statistic: It is denoted by t and is dependent on the test that we run. It is the deciding factor to reject or accept the Null Hypothesis. The four main test statistics are given in the below table:

4. Significance Level (α): The significance level, often denoted by α (alpha), represents the probability of rejecting the null hypothesis when it is actually true. Commonly used significance levels include 0.05 and 0.01, indicating a 5% and 1% chance of Type I error, respectively.
5. P-value: It is the proportion of samples (assuming the Null Hypothesis is true) that would be as extreme as the test statistic. It is denoted by the letter p.
6. Critical Value: Denoted by C and it is a value in the distribution beyond which leads to the rejection of the Null Hypothesis. It is compared to the test statistic.
Now, assume we are running a two-tailed Z-Test at 95% confidence. Then, the level of significance (α) = 5% = 0.05. Thus, we will have (1-α) = 0.95 proportion of data at the center, and α = 0.05 proportion will be equally shared to the two tails. Each tail will have (α/2) = 0.025 proportion of data.
The critical value i.e., Z95% or Zα/2 = 1.96 is calculated from the Z-scores table.
Now, take a look at the below figure for a better understanding of critical value, test-statistic, and p-value.

Steps of Hypothesis Testing
The steps of hypothesis testing typically involve the following process:
- Formulate Hypotheses: State the null hypothesis and the alternative hypothesis.
- Choose Significance Level (α): Select a significance level (α), which determines the threshold for rejecting the null hypothesis. Commonly used significance levels include 0.05 and 0.01.
- Select Appropriate Test: Choose a statistical test based on the research question, type of data, and assumptions. Common tests include t-tests, chi-square tests, ANOVA, correlation tests, and regression analysis, among others.
- Collect Data and Calculate Test Statistic: Collect relevant sample data and calculate the appropriate test statistic based on the chosen statistical test.
- Determine Critical Region: Define the critical region or rejection region based on the chosen significance level and the distribution of the test statistic.
- Calculate P-value: Determine the probability of observing a test statistic as extreme as, or more extreme than, the one obtained from the sample data, assuming the null hypothesis is true. The p-value is compared to the significance level to make decisions about the null hypothesis.
- Make Decision: If the p-value is less than or equal to the significance level (p ≤ α), reject the null hypothesis in favor of the alternative hypothesis. If the p-value is greater than the significance level (p > α), fail to reject the null hypothesis.
- Draw Conclusion: Interpret the results based on the decision made in step 7. Provide implications of the findings in the context of the research question or problem.
- Check Assumptions and Validate Results: Assess whether the assumptions of the chosen statistical test are met. Validate the results by considering the reliability of the data and the appropriateness of the statistical analysis.
By following these steps systematically, researchers can conduct hypothesis tests, evaluate the evidence, and draw valid conclusions from their analyses.
Decision Rules
The two methods of concluding the Hypothesis test are using the Test-statistic value and p-value.
In both methods, we start assuming the Null Hypothesis to be true, and then we reject the Null hypothesis if we find enough evidence.
The decision rule for the Test-statistic method:
if test-statistic (t) > critical Value (C), we reject Null Hypothesis.
If test-statistic (t) ≤ critical value (C), we fail to reject Null Hypothesis.
The decision rule for the p-value method:
if p-value (p) > level of significance (α), we fail to reject Null Hypothesis
if p-value (p) ≤ level of significance (α), we reject Null Hypothesis
In easy terms, we say P High, Null Fly, and P Low, Null Go.
Confusion Matrix in Hypothesis Testing
To plot a confusion matrix, we can take actual values in columns and predicted values in rows or vice versa.
(I am illustrating by taking actuals in columns and predicting in rows.)

Confidence: The probability of accepting a True Null Hypothesis. It is denoted as (1-α)
Power of test: The probability of rejecting a False Null Hypothesis i.e., the ability of the test to detect a difference. It is denoted as (1-β) and its value lies between 0 and 1.
Type I error: Occurs when we reject a True Null Hypothesis and is denoted as α.
Type II error: Occurs when we accept a False Null Hypothesis and is denoted as β.
Accuracy: Number of correct predictions / Total number of cases
The factors that affect the power of the test are sample size, population variability, and the confidence (α).
Confidence and power of test are directly proportional. Increasing the confidence increases the power of the test.
Types of Hypothesis Tests
In this section, we will see some examples of two different types of hypothesis tests.
Hypothesis Tests When the Data is Continuous

When dealing with continuous data, several common hypothesis tests are used, depending on the research question and the characteristics of the data. Some of the most widely used hypothesis tests for continuous data include:
- One-Sample t-test: Used to compare the mean of a single sample to a known value or hypothesized population mean.
- Paired t-test: Compares the means of two related groups (e.g., before and after treatment) to determine if there is a significant difference.
- Independent Samples t-test: Compares the means of two independent groups to determine if there is a significant difference between them.
- Analysis of Variance (ANOVA): Used to compare means across three or more independent groups to determine if there are any statistically significant differences.
- Correlation Test (Pearson’s correlation coefficient): Determines if there is a linear relationship between two continuous variables.
- Regression Analysis: Evaluates the relationship between one dependent variable and one or more independent variables.
Hypothesis Tests When the Data is Discrete

When dealing with discrete data, several common hypothesis tests are used to analyze differences between groups, associations, or proportions. Some of the most widely used hypothesis tests for discrete data include:
- Chi-Square Test of Independence: Determines whether there is a significant association between two categorical variables by comparing observed frequencies to expected frequencies.
- Chi-Square Goodness-of-Fit Test: Assesses whether the observed frequency distribution of a single categorical variable differs significantly from a hypothesized or expected distribution.
- Binomial Test: Determines whether the proportion of successes in a series of independent Bernoulli trials differs significantly from a hypothesized value.
- Poisson Test: Tests whether the observed counts of events in a fixed interval of time or space follow a Poisson distribution, often used in count data analysis.
- McNemar’s Test: Analyzes changes or differences in paired categorical data, typically used in before-and-after studies or matched case-control studies.
- Fisher’s Exact Test: Determines the significance of the association between two categorical variables in small sample sizes when the assumptions of the chi-square test are not met.
These tests are valuable tools for analyzing categorical data, identifying relationships between variables, and making inferences about populations based on sample data. The choice of test depends on the research question, the nature of the data, and the study design.
Types of Errors in Hypothesis Testing
In hypothesis testing, there are two main types of errors:
- Type I error (False Positive): This happens when one incorrectly rejects the null hypothesis, indicating a significant result when no true effect or difference exists in the population being studied.
- Type II error (False Negative): This occurs when one fails to reject the null hypothesis despite the presence of a true effect or difference in the population.
These errors represent the trade-off between making incorrect conclusions and the risk of missing important findings in hypothesis testing.
Problem-Solving
Example 1
Problem statement: Assume we are pizza makers and we are interested in checking if the diameter of the Pizza follows a Normal/Gaussian distribution?
Step 1: Collect data
import pandas as pd
data = pd.read_csv('diameter.csv')
Step 2: Define null and alternative hypotheses
H0 = 'Data is normal'
Ha = 'Data is not normal'
Step 2: Set the level of significance (α) = 5%alpha = 0.05Step 3: Run a test to check the normality
I am using the Shapiro test to check the normality.
from scipy.stats import shapiro
p = round(shapiro(data)[1], 2)
Step 4: Conclude using the p-value from step 3
if p > alpha:
    print(f"{p} > {alpha}. We fail to reject Null Hypothesis. {H0}")
else:
	print(f"{p} <= {alpha}. We reject Null Hypothesis. {Ha}")
The above code outputs “0.52 > 0.05. We fail to reject Null Hypothesis. Data is Normal.“
Example 2
Problem statement: Assume our business has two units that make pizzas. Check if there is any significant difference in the average diameter of pizzas between the two making units.
Before reading further, take a minute and think about which test would work. Now proceed further, and check if your answer is right.
Diameter is continuous data and we are comparing the data from two units
Y: Continuous, X: Discrete (2)
Now, go back to the image of Hypothesis tests for continuous data.
The possible tests are Mann Whitney Test, Paired T-test, 2 Sample T-test for equal variances, and 2 Sample T-test for unequal variances.
Step 1: Check if the data is normal
Check if the data has a normal distribution.
import pandas as pd
pizzas = pd.read_csv('pizzas.csv')
alpha = 0.05
# Defining Null and Alternative Hypotheses
H0 = 'data is Normally distributed'
Ha = 'data is not Normally distributed'
from scipy.stats import shapiro
def check_normality(df):
for columnName, columnData in pizzas.iteritems():
print('n' + "*** Shapiro Test Results of '{}' ***".format(columnName))
p = round(shapiro(columnData.values)[1], 2)
p>alpha:
print(f"{p} <= {alpha}. We reject Null Hypothesis. '{columnName}' {Ha}")

print(f"{p} > {alpha}. We fail to reject Null Hypothesis. '{columnName}' {H0}")
check_normality(pizzas)
The above code outputs 👇
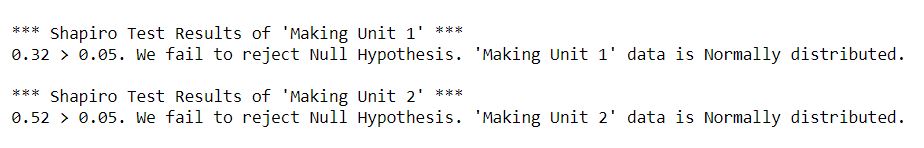
Data is normal, we can eliminate Mann Whitney Test. And external conditions are not given, so check for equality of variances.
Step 2: Check if the variances are equal.
We can use the Levene test to check the equality of variances
# Defining Null and Alternative Hypotheses
H0 = 'Variance of Unit A is approximately equal to Variance of Unit B'

Ha = 'Variance of Unit A is not equal to Variance of Unit B'


from scipy.stats import levene

def check_variances(df):

print('n' + "*** Variances Test Results' ***")

p = round(levene(pizzas['Making Unit 1'], pizzas['Making Unit 1'])[1],2)

if p>alpha:

print(f"{p} > {alpha}. We fail to reject Null Hypothesis. {H0}")

else:

print(f"{p} <= {alpha}. We reject Null Hypothesis. {Ha}")

check_variances(pizzas)
The above code outputs 👇
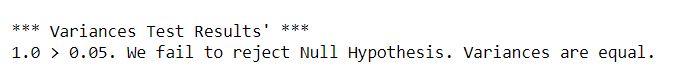
Variances are equal, so we go for 2 Sample T-test for equal variances
Step 3: Run the T-test for two samples with equal variances
Read more from T-test documentation
# Defining Null and Alternative Hypotheses
H0 = 'There is no significant difference.'

Ha = 'There exist a significant difference.'


from scipy.stats import ttest_ind

def t_test(df):

print('n' + "*** 2 Sample T Test Results ***")

test_results = ttest_ind(pizzas['Making Unit 1'], pizzas['Making Unit 1'], equal_var=True)

p = round(test_results[1],2)

if p>alpha:

print(f"{p} > {alpha}. We fail to reject Null Hypothesis. {H0}")

else:

print(f"{p} <= {alpha}. We reject Null Hypothesis. {Ha}")


t_test(pizzas)
Step 4: Conclude using the p-value from Step 3

The obtained p-value = 1.0 > alpha = 0.05. So we conclude by accepting the Null Hypothesis. There is no significant difference in the average diameter of pizzas between the two making units.
Conclusion
In the realm of data science, hypothesis testing stands out as a crucial tool, much like a detective’s key instrument. By mastering the relevant terminology, following systematic steps, setting decision rules, utilizing insights from the confusion matrix, and exploring diverse hypothesis test types, data scientists enhance their ability to draw meaningful conclusions. This underscores the pivotal role of hypothesis testing in data science for informed decision-making.
Here is a link to check out the code files.
Frequently Asked Questions
Q1. What is hypothesis testing in data?
A. Hypothesis testing in data involves evaluating claims or hypotheses about population parameters based on sample data. It helps determine whether there is enough evidence to support or reject a stated hypothesis, enabling researchers to draw reliable conclusions and make informed decisions.
Q2. Why do we use Hypothesis Testing?
A. We use hypothesis testing to evaluate claims about population parameters based on sample statistics, enabling us to draw reliable conclusions and make informed decisions in various fields such as science, business, and social sciences.
Q3. What is Data Analysis?
A. Data analysis involves examining and interpreting data to uncover patterns, trends, and insights. It includes calculating measures such as sample mean and standard deviation to understand central tendency and variability within a dataset. Random sampling ensures that collected data is representative of the population, facilitating generalization of findings.
The media shown in this article are not owned by Analytics Vidhya and are used at the Author’s discretion.
Hi, my name is Harika. I am a Data Engineer and I thrive on creating innovative solutions and improving user experiences. My passion lies in leveraging data to drive innovation and create meaningful impact.


Decision Rules seems to be for one tailed tests only. Kindly check it and update for two-tailed as well.