Introduction
Streamlight turns code into shareable applications in seconds. Everything is written in pure Python. No frontend experience required. Read on: Trusted by nearly 80 percent of the Fortune 50 companies. With Streamlit apps, a robust Python package, developers don’t need to have a lot of frontend knowledge to create dynamic web applications. Because of its user-friendly interface, data scientists and machine learning practitioners may easily deploy their models. With its emphasis on data visualization and quick prototyping, Streamlit app is a popular option for a variety of applications, including interactive data analysis tools and dashboards.
Table of contents
What is Streamlit?
After you create your Machine Learning model for a specific problem, usually the next step is to create a User Interface through which the end-users can input some data and then get the predicted output. For this purpose, a common process is to create a Flask application through which we can create routes and using those serve our ML model as a Flask application.
Although using Flask is simple, yet the user has to create HTML pages manually and serve them using the routes created.
But, if our project needs just a simple UI with a few fields then this process seems tedious. This is where the Streamlit app library comes in. It allows us to write all the code in a single python file without needing to write HTML and CSS ourselves. We can use several widgets provided by Streamlit app to create our UI and integrate with python code. In case you need to fine-tune the styling streamlit app also provides functionality to custom CSS styles if needed.
Saving your models
Let us have a look at how we can create a UI for a simple regression task. Before getting to UI let’s look at how we can export our simple ML model.
from sklearn.datasets import load_iris
from sklearn.model_selection import train_test_split, RandomizedSearchCV
import numpy as np
import pandas as pd
from sklearn.linear_model import LogisticRegression
import random
from sklearn.metrics import accuracy_score
import pickle
data = load_iris()
X = data.data
y = data.target
X_train, X_test, y_train, y_test = train_test_split(X, y, stratify=y, test_size=0.2, random_state=10)
clf = LogisticRegression(C=0.01)
clf.fit(X_train, y_train)
pickle.dump(clf, open('final_model.sav', 'wb'))
Here we create a very simple Machine Learning model for the classification of Iris Species. As this is just for demonstration we don’t perform any feature engineering or Hyperparameter tuning. Once our model is built we need to export it so that we can directly import it and make our predictions. For this, we can use the Pickle library. Once we export the model we get a final_model.sav file which we will use in our UI to predict results.
Why should data scientists use Streamlit apps?
Data scientists should consider using Streamlit apps for a multitude of reasons. Firstly, Streamlit apps offers an incredible advantage by enabling users to develop interactive web apps without delving into the complexities of traditional web development. With just a few lines of code, utilizing the `import streamlit` command, data scientists can effortlessly create captivating web apps. The “Sweet Streamlit Hello App” serves as a perfect introduction, showcasing the platform’s intuitive interface and functionalities.
For those in the field of data science, Streamlit presents an invaluable tool for deploying models with minimal programming knowledge. Its user-friendly nature empowers data scientists to share their insights and analyses with ease. Furthermore, in the realm of software creation, providing a seamless user experience is paramount. Streamlit apps streamlines this process by facilitating the rapid development of effective user interfaces for data-intensive mobile apps and web apps alike. By leveraging Streamlit’s capabilities, data scientists can focus on their core expertise in data analysis and model creation, while seamlessly translating their work into user-friendly, interactive applications for sharing with colleagues and stakeholders.
Getting started with Streamlit app
Installing Streamlit
Streamlit can be easily installed via pip using the following command:
$ pip install streamlitRunning Streamlit Share Data Apps
To run or start a Streamlit we use the streamlit run command followed by the name of the python file which contains the code. In our case, our main file would be app.py
$ streamlit run app.pyStreamlit provides the UI elements we can use in the form of Widgets. Let’s have a look at a few Streamlit widgets we will be using
1. st. title(string)
- It’s used to print the header of the webpage. This is similar to using tag in HTML
2. st.markdown(string)
- It allows us to print any data or text on the web page. As the name suggests the string we pass to this function can also support Markdown. So we can use Markdown syntax and the function renders the markdown on the web page.
3. st.text_input( Label, Placeholder)
- When we want to read text from the user we can use text_input. It takes 2 arguments i.e a Label for that text_input and some placeholder text for the Text field. We can assign the text entered in the text field to be stored in a variable.
sepal_length = st.text_input('Enter sepal_length', '')- Here whenever the User types or edits text in this textbox the value is automatically updated in the sepal_length variable which can then be used anywhere in the code just like any normal string.
4. st.button(label)
- It creates a button with a label specified. Whenever the user clicks on a button streamlit apps updates the value of the button as True, so using this code we can run a function whenever the user clicks a particular button.
if st.button(“Predict”):predict_class()
Project Structure
In our project, we would mainly have 2 files: app.py and model_methods.py. Let’s have a look at the content of each file.
model_methods.py
In this file, we will create methods that load our model and make predictions. These predictions will be displayed using the UI. Here we import all the libraries needed and write our code for prediction in the predict() function.
import numpy as np
import pandas as pd
from sklearn.linear_model import LogisticRegression
import pickle
def predict(arr):
    # Load the model
    with open('final_model.sav', 'rb') as f:
        model = pickle.load(f)
    classes = {0:'Iris Setosa',1:'Iris Versicolor',2:'Iris Virginica'}
    # return prediction as well as class probabilities
    preds = model.predict_proba([arr])[0]
    return (classes[np.argmax(preds)], preds)
In the predict() function, we get the data to be predicted as a list. We then load the model from the final_model.sav file which we had exported previously and then predict the classes using our model. This function returns the predicted class label as well as the probabilities of each class so that we can plot some charts using the probabilities of each class. As our model was a Logistic Regression model, to get the probabilities of the data belonging to each class we use the model.predict_proba() function.
As our use case was a simple one we could directly use the data for predictions, if any preprocessing of text or scaling needs to be done it could be included here as well. This file would act as the prediction pipeline for our Machine Learning model.
app.py
This file is the entry point to our application. We first import the required libraries including the streamlit app library itself.
To render the UI, we add a title and a description of our app. We then define 4 text input tags (sepal_length,sepal_width,petal_length, petal_width) to read the values from the user. We add a button with a Label as “Predict”. Whenever enters the data in the four text fields and then clicks on the Predict button we trigger a function predict_classes() which is defined below
import streamlit as st
import numpy as np
import pandas as pd
import seaborn as sns
import matplotlib.pyplot as plt
from model_methods import predict
classes = {0:'setosa',1:'versicolor',2:'virginica'}
class_labels = list(classes.values())
st.title("Classification of Iris Species")
st.markdown('**Objective** : Given details about the flower we try to predict the species.')
st.markdown('The model can predict if it belongs to the following three Categories : **setosa, versicolor, virginica** ')
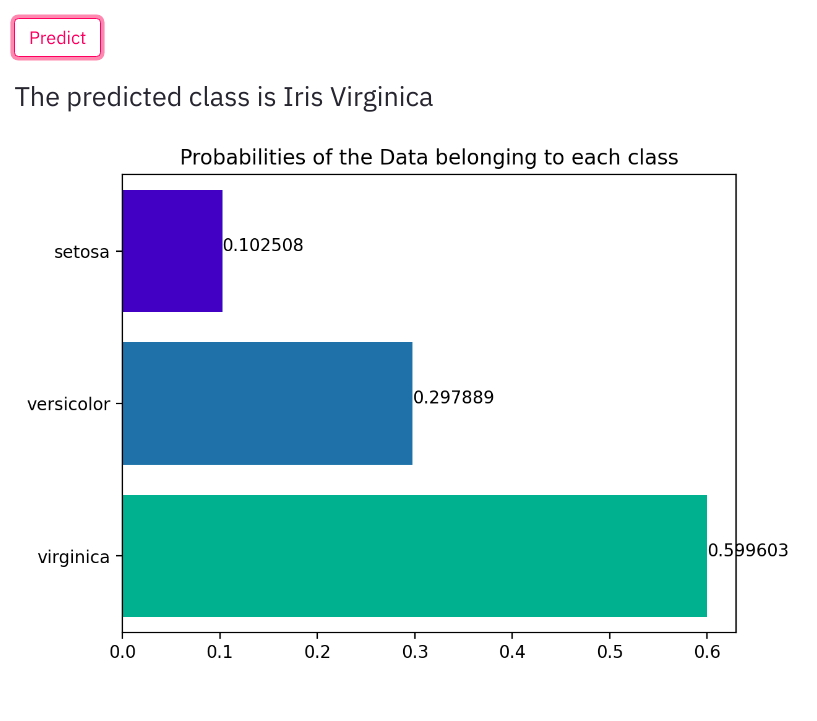
def predict_class():
data = list(map(float,[sepal_length,sepal_width,petal_length, petal_width]))
result, probs = predict(data)
st.write("The predicted class is ",result)
probs = [np.round(x,6) for x in probs]
ax = sns.barplot(probs ,class_labels, palette="winter", orient='h')
ax.set_yticklabels(class_labels,rotation=0)
plt.title("Probabilities of the Data belonging to each class")
for index, value in enumerate(probs):
plt.text(value, index,str(value))
st.pyplot()
st.markdown("**Please enter the details of the flower in the form of 4 floating point values separated by commas**")
sepal_length = st.text_input('Enter sepal_length', '')
sepal_width = st.text_input('Enter sepal_width', '')
petal_length = st.text_input('Enter petal_length', '')
petal_width = st.text_input('Enter petal_width', '')
if st.button("Predict"):
predict_class()In this file, the function predict_class() gets called automatically when the user clicks on the “Predict” button.
In the predict_class function first, we read all the data entered by the user. By default the values are strings, so we convert them to float first. We then call the predict() function we had previously created in the model_methods.py file. We get the predicted result and also the probabilities. We print the Result to the webpage. Also, we get the probabilities of each class. using which we plot a bar graph. For this, we can use the Seaborn library. Streamlit app will automatically print our output on the webpage.
Let us run our app and check how the results look like.
$ streamlit run app.py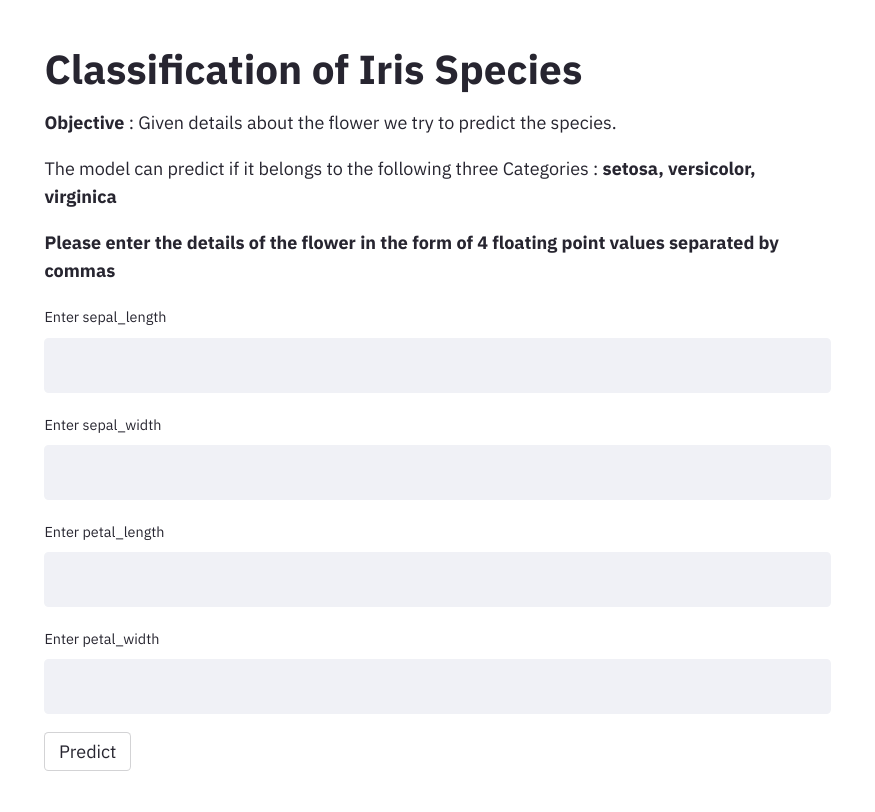
When a user enters the details along with predicted output we also display the predicted class probabilities.
Changes to be made for Deploying to Heroku
As we saw, using very few lines of codes and no HTML we were able to create a simple User Interface for our Machine Learning Model. Further, we can also easily deploy this web app to various cloud platforms. Let’s have a look at some things we need to add to deploy it to Heroku. We need to add 2 more files to our project which are specified below along with their content:
1. Procfile
web: sh setup.sh && streamlit run app.py2. setup.sh
mkdir -p ~/.streamlit/
echo "
[server]n
headless = truen
port = $PORTn
enableCORS = falsen
n
" > ~/.streamlit/config.toml
Our final Project structure would have the following files:
- app.py
- model_methods.py
- final_model.sav
- Procfile
- setups.sh
Why should data scientists use Streamlit?
Because it can be used to rapidly and simply develop interactive web apps for sharing data applications, Streamlit is a potent tool that is becoming more and more popular among data scientists. Without requiring in-depth knowledge of web programming, data scientists may easily convert their data science research into user-friendly online applications by utilizing Streamlit apps.
Streamlit’s simplicity is one of the main reasons data scientists should utilize it. They can develop a Streamlit app with a few lines of code by utilizing the import streamlit command. Streamlit app apps offers a simple method for converting any data-related project—be it machine learning, data visualization, or otherwise—into an interactive online application.
The “Sweet Streamlit app Hello App” is frequently where many data scientists who are interested in Streamlit apps begin their exploration. This sample project makes it simple for newcomers to get started by outlining the fundamental features and organization of a Streamlit app. Furthermore, by facilitating the development of interactive online applications, Streamlit expands the potential of conventional data science operations. With the help of these apps, users may explore various factors, work with data in real-time, and obtain insights through analysis and visualization.
The adaptability of Streamlit is another strong argument in favor of using it. No matter your level of experience, Streamlit app gives you the freedom to create unique web applications that are suited to your requirements. Users of various skill levels can easily utilize it thanks to its comprehensive documentation and user-friendly design.
Moreover, sharing data apps with others is a breeze with Streamlit app. With only a few clicks, a Streamlit app can be shared and deployed with clients, coworkers, or the larger community. This simplified sharing procedure encourages teamwork and the spread of insights derived from data.
Conclusion
Streamlit is a useful tool for data-driven initiatives because of its adaptability and simplicity of usage. Streamlit frees developers from the burden of intricate web development so they can concentrate on their primary skills and provide end users with engaging applications. Streamlit is a leading option for developing and distributing data-driven apps because of its easy interface with well-known Python modules and cloud platform deployment capabilities.
Frequently Asked Questions?
Q1. What is Streamlit used for?
A. The Streamlit Python library is an attractive free Python library which lets developers easily develop appealing user interfaces. Streamlit can be used by developers without coding experience to create an HTML web site.
Q2. What is Streamlit good for?
A. Data Visualization: Streamlit supports integrated data visualisation libraries such as Matplotlib, Plotly and Altair, making it ideal for data dashboards and interactive visualizations. Prototyping and rapid design: Streamlit offers excellent support for prototyping and rapid web application creation.
Q3. Is Streamlit better than flask?
A. Flask gives developers broader control over the deployment process, enabling developers to enhance performance. Streamlit’s services however are specifically targeted at distributing applications through the Streamlit platform.


