The Measure of Central Tendencies in Statistics -A Beginner’s Guide
This article was published as a part of the Data Science Blogathon
Statistics. Whenever I hear this term, I imagine of below
Looks pretty scary to me. In this blog, my aim is to introduce you to the measure of central tendency used in statistics in the easiest possible way. So, let’s get started.
Interesting Sidenote
Before starting with the measure of central tendency, let me share an interesting side note. Do you know these measures of central tendency were used way back during world war 1 and world war 2?.
To be precise, these measures were used in order to access the damage that happened to aircraft during dogfights. In addition to that, those measures were used to also assess the return of aircraft at the rendezvous points. Interesting isn’t it.

Population and Sample
Before we start with a measure of central tendencies, we need to understand few core concepts. One of them being population and sample.
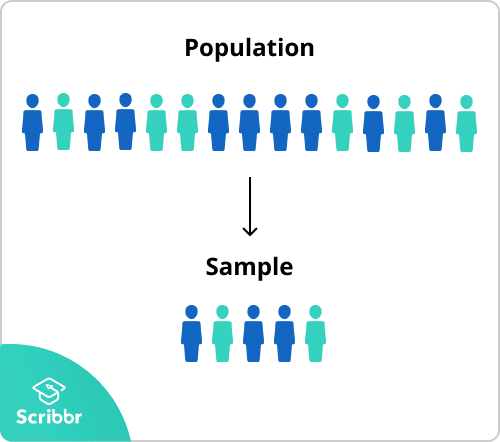
Population
From a definition viewpoint, the population is a collection of all data points of interest. Let’s get an understanding of this with the help of an example.
Example:- Let’s say we are conducting a survey. Our aim to find out the total number of employees an organization is having. In this case, the total number of employees in the organization is known as population.
Sample
From a definition viewpoint, a sample is a subset of the population. Let’s get an understanding of this with the help of an example.
Example:- Let’s say we are conducting a survey. Our aim to find out the total number of employees on a particular project. In this case, the total number of employees in a project is known as a sample.
What to chose between Population and Sample?
Well in most of the real-life case scenarios, we always deal with sample data. The reason behind this is that a sample is easy to collect and easier to compute than the population. Based on the result that we obtained for a sample, we can then use predictive analytics to make predictions about the entire population.
Parameter and Statistic
Now we have a core understanding of the difference between population and sample. Let’s quickly cover two more important concepts in this aspect – Parameter and Statistic
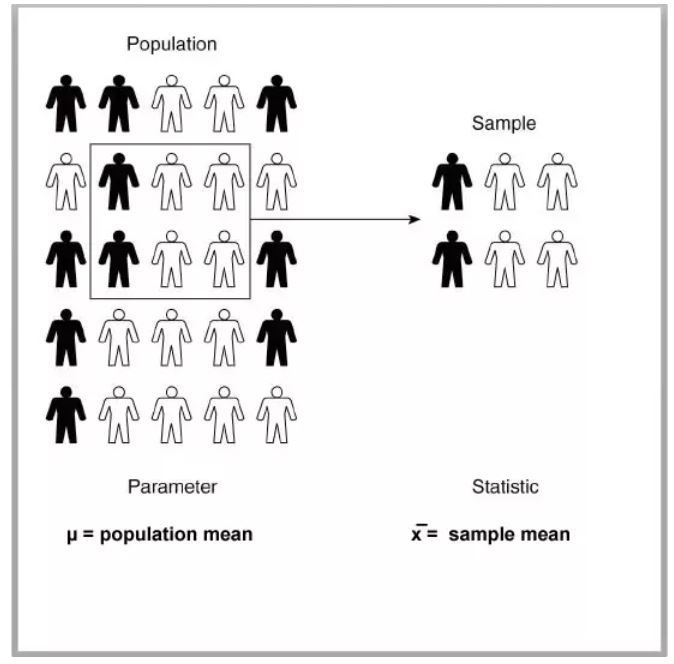
Parameter
From a definition viewpoint, numbers that are obtained when working with a population are known as a parameter.
Example:- Let’s consider the same example where we are going to count the total number of employees working in an organization. After completion of our survey, we arrive at number – 20000. In this context, 20000 is known as a parameter.
Statistic
From a definition viewpoint, numbers that are obtained when working with a sample is known as a statistic.
Example:- Let’s consider the same example where we are going to count the total number of employees working on a particular project. After completion of our survey, we arrive at number – 20. In this context, 20 is known as a statistic.
That’s why statistics is called statistics !!
The Measure of Central tendency
Now we have a core understanding of population and sample and their mapping with parameters and statistics. Before starting with our main topic, you might have a query – “What is meant by Central Tendency ?”.
Well, the concept of central tendency is based on the below fact –
“Provided with a larger number of observations of similar type, most of the observations seems to cluster around central position when represented as a graph”.
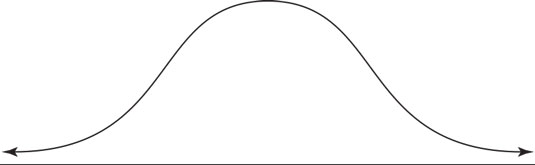
As we can see in the above graph, most of the observation tends to cluster around the central position and hence the term central tendency.
Now let’s start with the measure of central tendencies.
Mean
This is the very first measure of central tendency. Mean also known as the arithmetic mean is the statistical average of all data points in question.
Example :- Let’s consider first 10 natural numbers – 1,2,3,4,5,6,7,8,9,10
In this case, the mean will be the sum of all those numbers divided by the total number of numbers in questions.
( 1+2+3+4+5+6+7+8+9+10)/10 = 5.5
Advantages of mean:
1.Easiest measure of central tendency
2.Easier to compute
Disadvantages of mean:
1.Heavily affected by the presence of outlier
You might have a question here – “What is an outlier?”
Outlier is basically a data point that is significantly different from the rest of the data points in consideration. So if a dataset is having extremely high or extremely low value, that might be considered as an outlier. There are multiple techniques to detect the presence of outliers like Box plot, five-number summary, etc. but those concepts are out of the scope of this article.
Example:- Let say we have 10 people in a room. Our aim is to compute the average salary of all people in a room. It will be computed by adding the salaries of all people divided by the total number of people. Now imagine Jeff Bezos walked into our room and now if we compute our mean, it is going to be significantly different than previously computed. The reason being the presence of an outlier ( Jeff Bezos in this case since he is having an extremely high salary ).
Median
This is the second measure of central tendency. Median is basically the middlemost data point in the dataset when arranged in ascending or descending order.
In this aspect, there are two variations of the median.
Median with even number of data points
If there are an even number of observations or data points, then the median is simply the average of the middle two numbers.
Example :- Let’s consider first 10 natural numbers – 1,2,3,4,5,6,7,8,9,10
In this case, the median will be the average of the middle two numbers which is going to be 5.5
Median with an odd number of data points
If there are an odd number of observations or data points, then the median is simply the middlemost observation.
Example :- Let’s consider first 11 natural numbers – 1,2,3,4,5,6,7,8,9,10,11
In this case, the median will be the middlemost observation which is going to be 6 in this case.
Advantages of median:
1.Higher resistance to outlier as compared to mean
Disadvantages of median:
1.Data needs to be ordered either in ascending or descending order
Mode
This is the third and last measure of central tendency. Mode is basically the value that appears the most in the dataset.
Example:- Let’s say we have following numbers – 1,2,3,4,4,4,4,4,4,5,6,7,8,9
Here we can clearly see that number 4 is repeated the most number of times and hence going to be mode in this case.
Advantages of mode:
1.Higher resistance to outlier as compared to mean and median
Disadvantages of mode:
1.Difficult to determine if data has more than 1 mode
Hope you like this blog on measures of central tendency.
LinkedIn:
https://www.linkedin.com/in/shrish-mohadarkar-060209109/


I really appreciate with your efforts, may the almighty Allah reward you abundantly.
Good to some extent, but honestly there was nothing to learn......
Thank you so much Very good and informative topics discussed