Different Type of Correlation Metrics Used by Data Scientists
This article was published as a part of the Data Science Blogathon
Introduction
Before explaining the correlation and correlation metrics, I would like you to answer a simple question.
Let’s suppose you are the owner of a company that makes soft drinks. You have collected past one-year records which are the cost and sales of the product.
Now the question is, could you infer from the data whether the sales and cost have some relation between them. In other words, does low price helps in increasing the sales, or it does not affect sales at all ???
So we need some statistical tools that measure the relationship between variables.
Now you have an idea of what is the need for correlation.
Table of Contents
- What is Covariance
- What is Correlation Metrics
- Types of Correlation Metrics
- Pearson Correlation
- Spearman’s Rank Correlation
- Kendall Rank Correlation
- Point Biserial Correlation
What is Covariance?
A covariance is a statistical tool that helps to quantify the total variance of random variables from their expected value(Mean). In simple words, it is a measure of the linear relationship between two random variables. It can take any positive and negative values.
- Positive Covariance: It indicates that two variables tend to move in the same direction, which means that if we increase the value of one variable other variable value will also increase.
- Zero Covariance: It indicates that there is no linear relationship between them.
- Negative Covariance: It indicates that two variables tend to move in the opposite direction, which means that if we increase the value of one variable other variable value will decrease and vice versa.
Covariance between two variables X and Y can be calculated using the following formula:
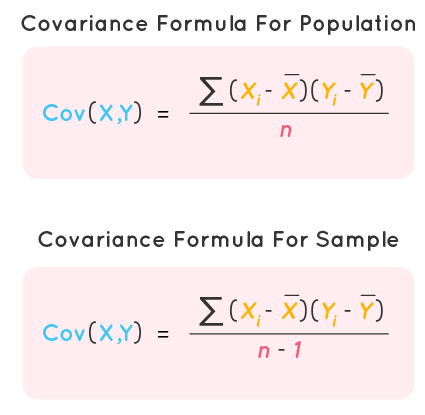
xi = ith data point of x
x̅ = mean of x
yi = ith data point of y
y̅ = mean of y
n = total number of data points
NOTE: Notice that while calculating population covariance, we use n in denominator, and while calculating sample covariance, we use n -1.
Limitations of Covariance
- Covariance magnitude does not signify the strength of their relationship, so what only matters is the sign, whether it is positive or negative which tells the relationship.
- If we convert or scale the measurements of the variable X and Y, then Cov(X’, Y’) ≠ Cov(X, Y) should not happen.
- Covariance does not capture the non-linear relationship between two variables.
Now let’s calculate the Covariance between two variables using the python library.
Importing the necessary modules
import numpy as np
Generating random dataset which is normally distributed
Calculating Covariance between two variables
np.cov(a,b)
Output
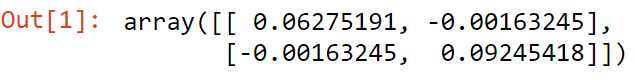
Here covariance value is -0.001, so we can say no linear relationship among them.
In order to quantify the strength of their relationship or how strongly they affect each other, we use Correlation.
What is the Correlation Metrics?
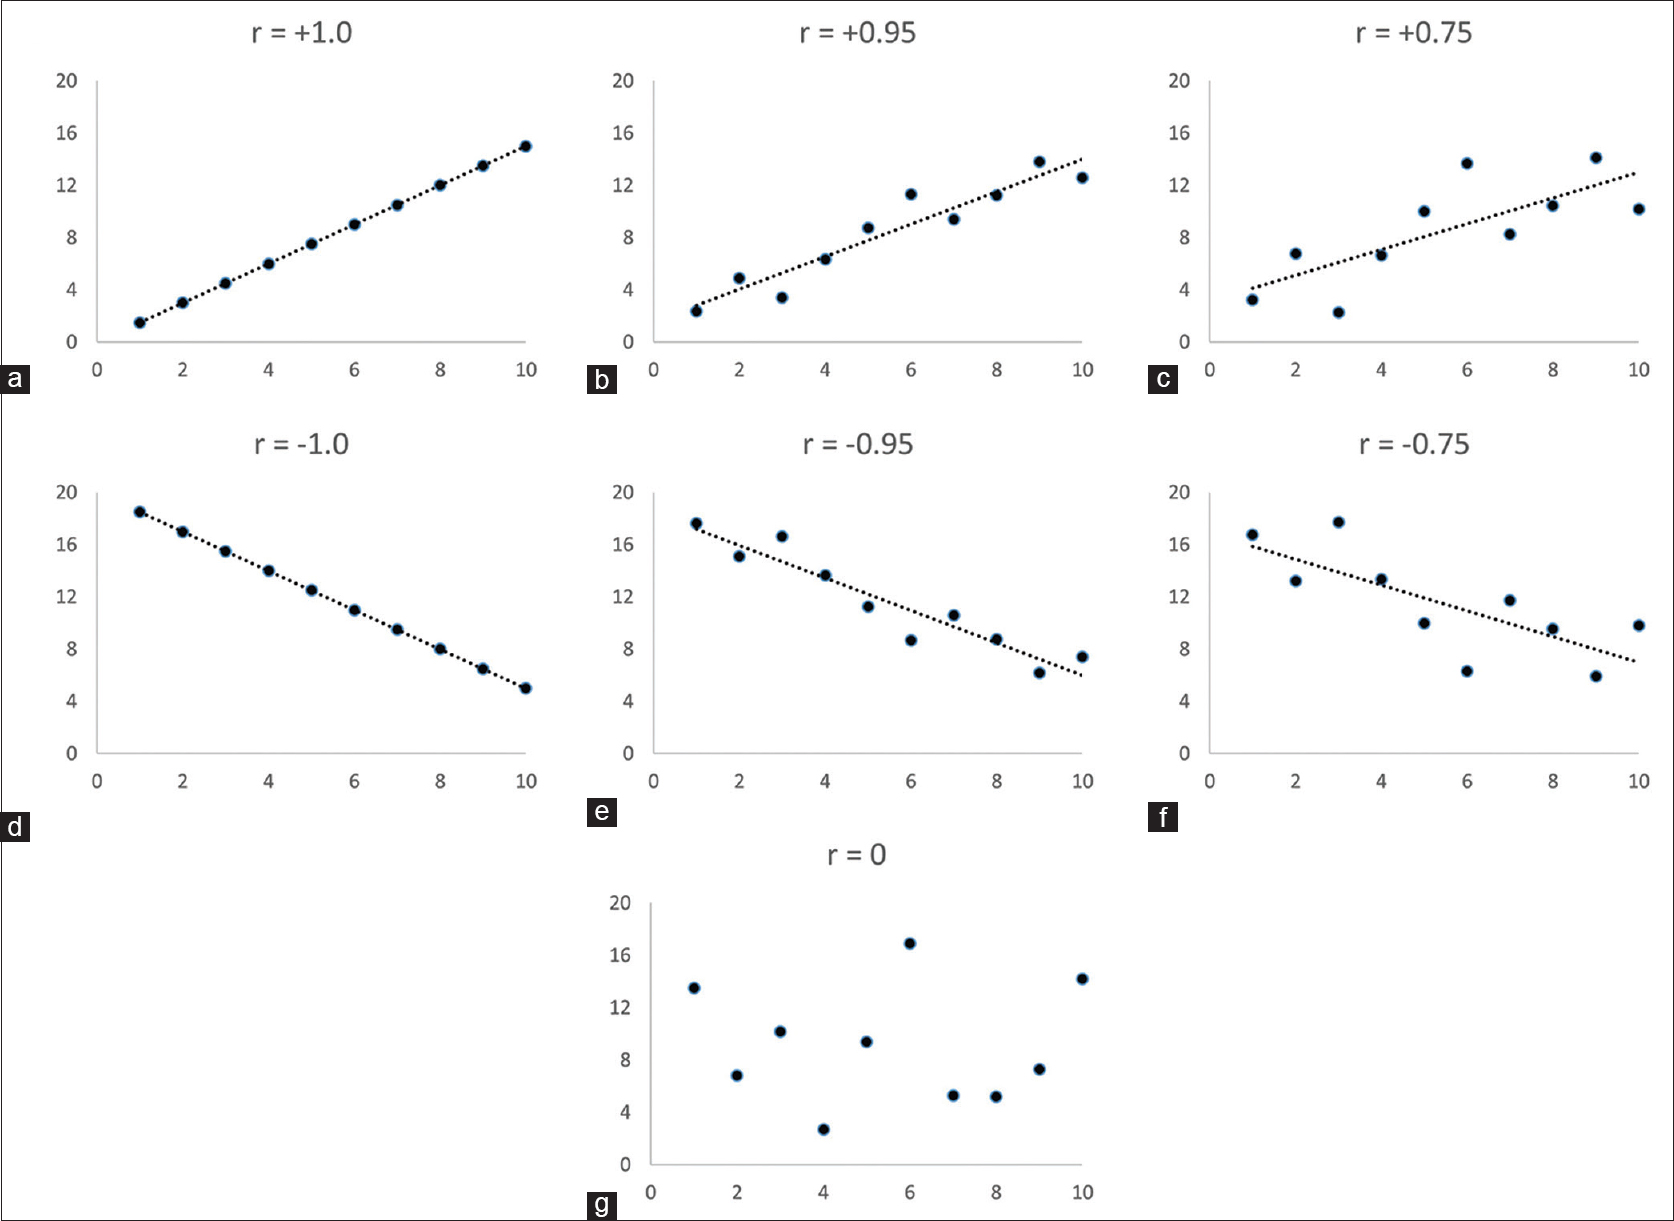
Correlation also measures the relationship between two variables as well as its magnitude defines the strength between variables. It ranges from -1 to 1 and is usually denoted by r.
- Perfectly Positive Correlation: When correlation value is exactly 1.
- Positive Correlation: When correlation value falls between 0 to 1.
- No Correlation: When correlation value is 0.
- Negative Correlation: When correlation value falls between -1 to 0.
- Perfectly Negative Correlation: When correlation value is exactly -1.
The following figure illustrates the linear relationship graphically
Types of Correlation Metrics
- Pearson Correlation
- Spearman’s Rank Correlation
- Kendall Rank Correlation
- Point Biserial Correlation
Pearson Correlation
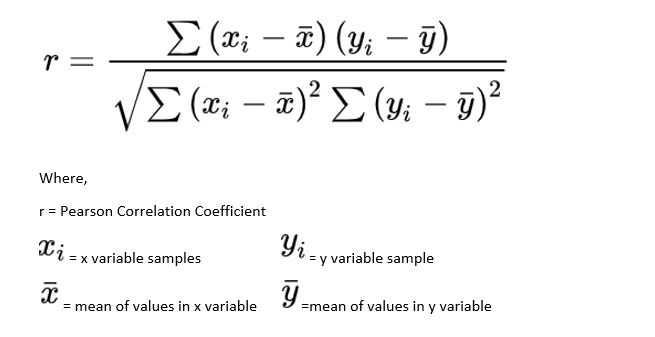
Pearson correlation is also known as the Pearson product-moment correlation coefficient and is a normalized measurement of the covariance. It also measures the linear relationship between two variables and fails to capture the non-linear relationship of two variables. Pearson correlation assumes that both variables are normally distributed. It can be used for nominal variables or continuous variables.
Pearson correlation coefficient between two variables X and Y can be calculated by the following formula:
Limitation of Pearson Correlation
- It fails to capture the non-linear relationship between two variables.
- Usually, we do not use the Pearson correlation coefficient for ordinal variables(where sequence matters).
Now let us calculate the Pearson correlation coefficient between two variables using the python library.
Importing the necessary modules
from scipy.stats import pearsonr
import numpy as np
Generating random dataset which is normally distributed
a = np.random.normal(size=10)
b = np.random.normal(size=10)
Calculating Pearson Correlation Coefficient between two variables
pearsonr(a,b)
Output

Here Pearson Correlation is -0.05, so we can no linear relationship among them.
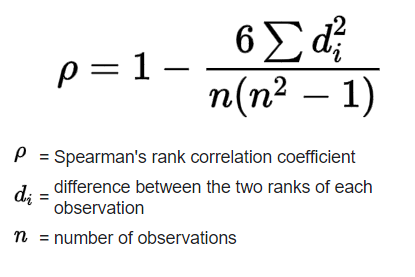
Spearman’s Rank Correlation
It is a nonparametric(no prior assumptions about distribution) measure for calculating correlation coefficient that is used for ordinal variables or continuous variables. Spearman’s rank correlation can capture both linear or non-linear relationships.
Spearman’s rank correlation coefficient between two variables X and Y can be calculated using the following formula:
Now let us calculate Spearman’s rank correlation coefficient between two variables using the python library.
Importing the necessary modules
import numpy as np
from scipy.stats import spearmanr
Generating random dataset which is normally distributed
a = np.random.rand(10)
b = np.random.rand(10)
Calculating Pearson Correlation Coefficient between two variables
spearmanr(a,b)
Output

Here Spearman’s Correlation is 0.15, so we can say positive correlation among them.
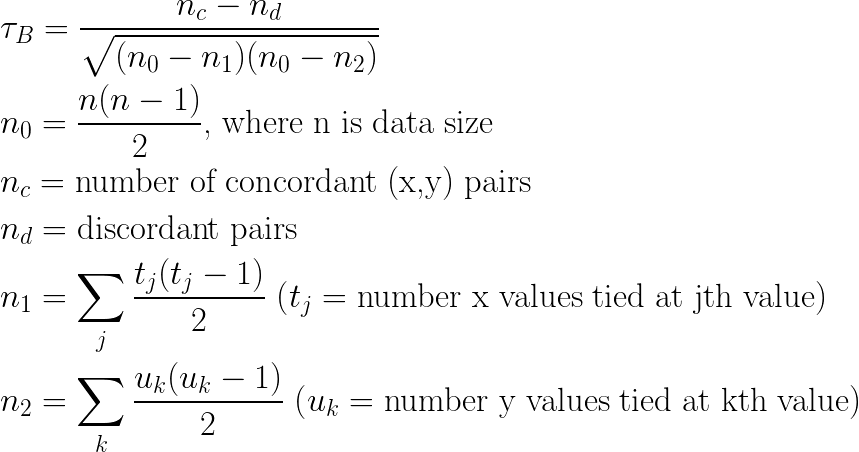
Kendall Rank Correlation
Kendell rank correlation, sometimes called Kendall tau coefficient, is a nonparametric measure for calculating the rank correlation of ordinals variables. It can also capture both linear or non-linear relationships between two variables. There are three different flavours of Kendall tau namely tau-a, tau-b, tau-c.
Generalized Kendall rank correlation coefficient between two variables X and Y can be calculated using the following formula:
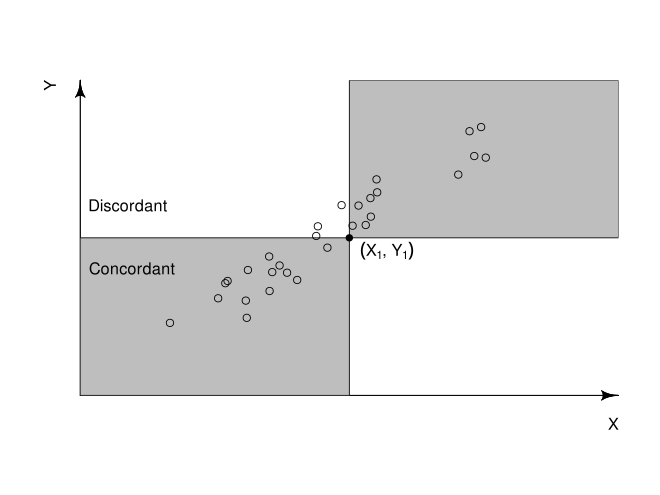
Concordant Pair: A pair is concordant if the observed rank is higher on one variable and is also higher on another variable.
Discordant Pair: A pair is discordant if the observed rank is higher on one variable and is lower on the other variable.
Now let us calculate the Kendall tau correlation coefficient between two variables using the python library.
Importing the necessary modules
import numpy as np
from scipy.stats import kendalltau
Generating random dataset which is normally distributed
a = np.random.rand(10)
b = np.random.rand(10)
Calculating Pearson Correlation Coefficient between two variables
kendalltau(a,b)
Output

Here Kendall Correlation is -0.19, so we can say negative correlation among them.
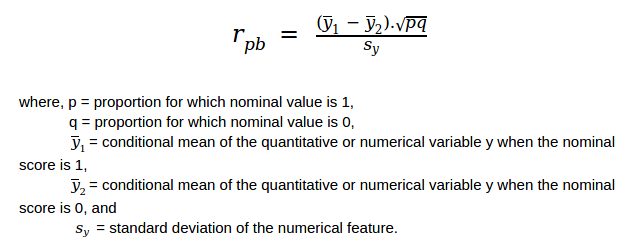
Point Biserial Correlation
Point Biserial Correlation is used when one variable is dichotomous(binary) and another variable is continuous. It can also capture both linear or non-linear relationships between two variables. It is denoted by rpb.
Dichotomous Variable: If a variable can have only binary values like head or tail, male or female then such variable is called a dichotomous variable.
Point Biserial correlation coefficient between two variables X and Y can be calculated using the following formula:
Now let us calculate the Point Biserial correlation coefficient between two variables using the python library.
Importing the necessary modules
import numpy as np
from scipy.stats import pointbiserialr
Generating random dataset which is normally distributed
a = np.random.rand(10)
b = np.random.rand(10)
Calculating Pearson Correlation Coefficient between two variables
pointbiserialr(a,b)
Output

Here Point Biserial Correlation is 0.305, so we can say positive correlation among them.
End Notes
I hope you enjoyed reading the article. If you found it useful, please share it among your friends and on social media. For any queries, suggestions, or any other discussion, please ping me here in the comments or contact me via Email or LinkedIn.
Contact me on LinkedIn – www.linkedin.com/in/ashray-saini-2313b2162
Contact me on Email – [email protected]


