This article was published as a part of the Data Science Blogathon
Introduction
Data is present everywhere. Any action we perform generates some or the other form of data. But this data might not be present in a structured form. A beginner starting with the data field is often trained for datasets in standard formats like CSV, TSV, or some text files. CSV files are the most preferred files as they can be loaded into a pandas dataframe and manipulated more easily. The text files can be loaded using naive Python file handling modules.
But in the real world, any type of document can have the data needed for analysis. While I was applying for an internship position in a company, my assignment was to draw analysis out of the data present in the Doc file. In this article, I will explain the ETL process for a Doc file, the difference between Doc and Docx extensions, conversion of Doc to Docx, and at the end, I will show you how I created some interactive plots from that data.

Difference Between Doc and Docx
While dealing with doc files, you will come across these two extensions: ‘.doc’ and ‘.docx’. Both the extensions are used for Microsoft word documents that can be created using Microsoft Word or any other word processing tool. The difference lies in the fact that till word 2007, the “doc” extension was used extensively.
After this version, Microsoft introduced a new extension, “Docx”, which is a Microsft Word Open XML Format Document. This extension allowed files to be smaller, easy to store, and less corrupted. It also opened doors to online tools like Google Sheets which can easily manage these Docx files.
Conversion of Doc to Docx in Python
Today, all the files are by default created with the extension Docx but there are still many old files with Doc extension. A Docx file is a better solution to store and share data but we can’t neglect the data stored in Doc files. It might be of great value. Therefore, to retrieve data from Doc files, we need to convert the Doc file to Docx format. Depending on the platform, Windows or Linux, we have different ways for this conversion.
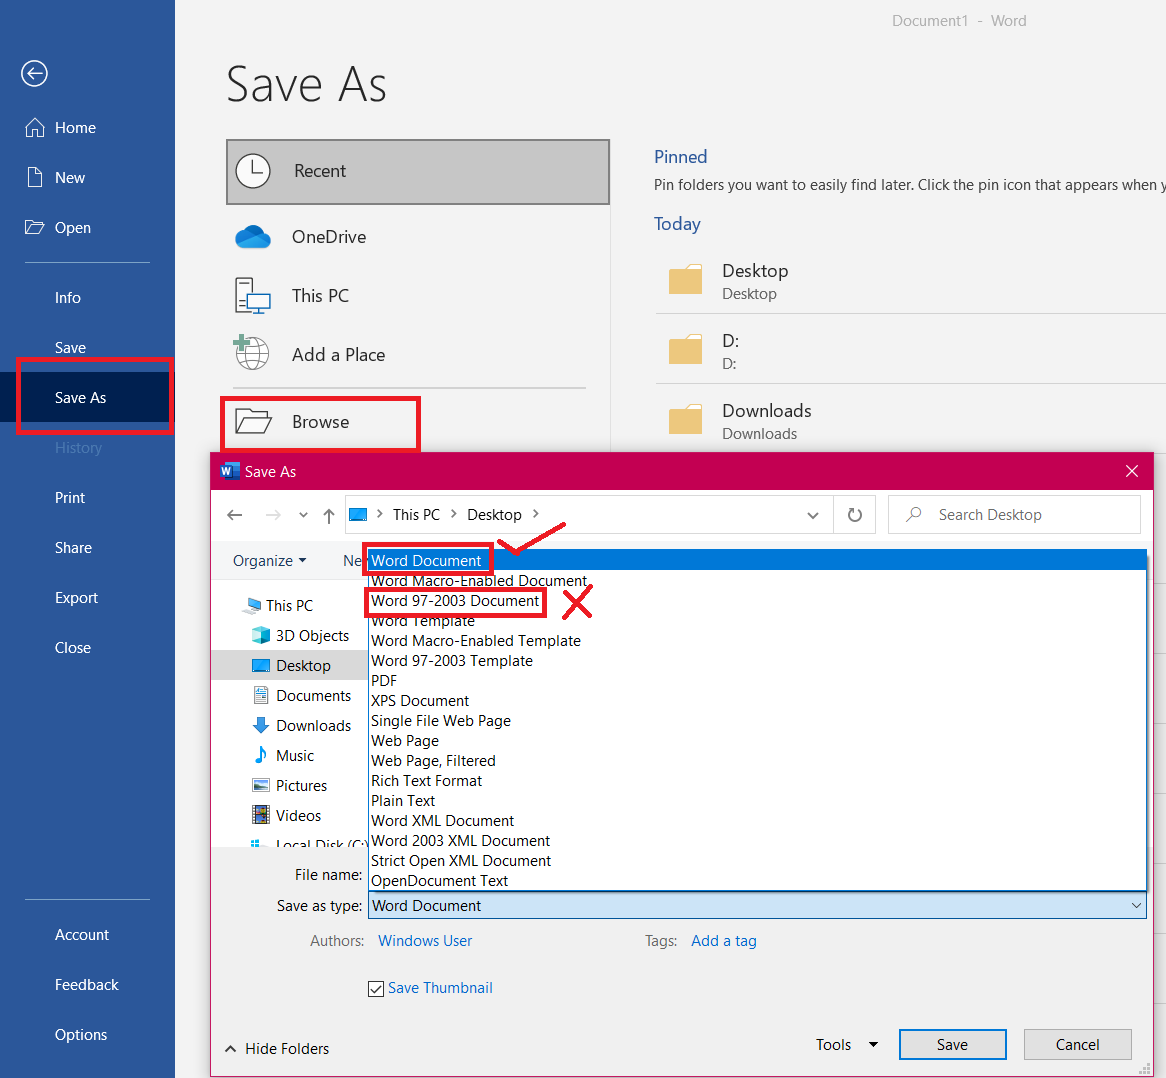
For Windows
Manually, for a word file to be saved as Docx, you simply need to save the file with the extension “.docx”
We will perform this task using Python. Window’s Component Object Model (COM) allows Windows applications to be controlled by other applications. pywin32 is the Python wrapper module that can interact with this COM and automate any windows application using Python. Therefore, the implementation code goes like this:
from win32com import client as wc
w = wc.Dispatch('Word.Application')
doc = w.Documents.Open("file_name.doc")
doc.SaveAs("file_name.docx", 16)
Breakdown of the code:
- First, we are importing the client from the win32com package which is preinstalled module during Python installation.
- Next, we are creating a Dispatch object for the Word Application.
- Then, we are opening this document and saving it with the Docx extension.
For Linux
We can directly use LibreOffice in-build converter:
lowriter --convert-to docx testdoc.docReading Docx files in Python
Python has a module for reading and manipulating Docx files. It’s called “python-docx”. Here, all the essential functions have been already implemented. You can install this module via pip:
pip install python-docx
I won’t go into detail about how a Docx document is structured but on an abstract level, it has 3 parts: Run, paragraph, and Document objects. For this tutorial, we will be dealing with paragraph and Document objects. Before moving to the actual code implementation, let us see the data will be extracting:
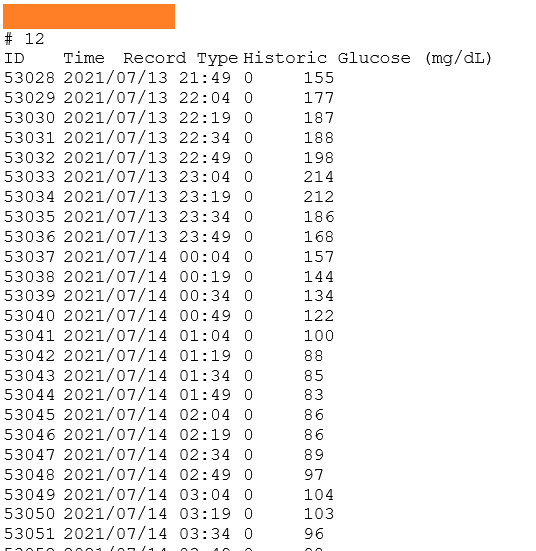
Data in new Docx file
The new Docx file contains the glucose level of a patient after several intervals. Each data row has an Id, Timestamp, type, and glucose level reading. To maintain anonymity, I have blurred out the Patient’s name. Procedure to extract this data:
1. Import the module
import docx
2. Create a Docx file document object and pass the path to the Docx file.
Text = docx.Document('file_name.docx')
3. Create an empty data dictionary
data = {}
4. Create a paragraph object out of the document object. This object can access all the paragraphs of the document
paragraphs = Text.paragraphs
5. Now, we will iterate over all the paragraphs, access the text, and save them into a data dictionary
for i in range(2, len(Text.paragraphs)):
    data[i] = tuple(Text.paragraphs[i].text.split('t'))
Here I had to split the text at “t” as if you look at one of the rows, it had the tab separator.
6. Access the values of the dictionary
data_values = list(data.values())
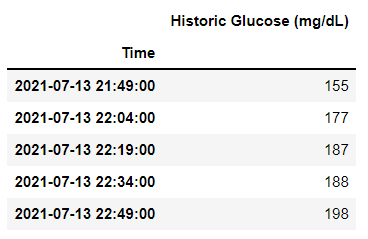
Now, these values are transformed as a list and we can pass them into a pandas dataframe. According to my use case, I had to follow some additional steps such as dropping unnecessary columns and timestamp conversion. Here is the final pandas dataframe I got from the initial Doc file:
There are a lot of things that can be done using the python-docx module. Apart from loading the file, one can create a Docx file using this module. You can add headings, paragraphs, make text bold, italics, add images, tables, and much more! Here is the link to the full documentation of the module.
Bonus Step: Plot using Plotly
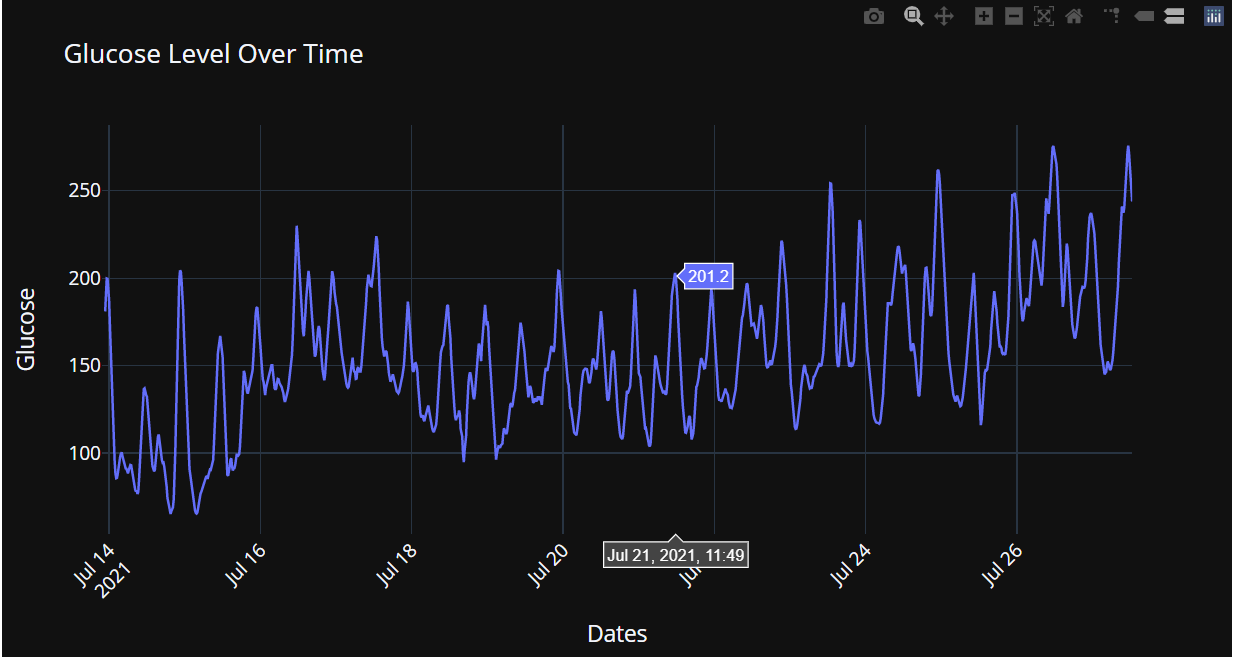
The main aim of this article was to show you how to extract tabular data from a doc file into a pandas dataframe. Let’s complete the ELT cycle and transform this data into beautiful visualizations using the Plotly library! If you don’t know, Plotly is an amazing visualization library that helps in creating interactive plots.
These plots don’t require much effort as most of the things can be customized. There are many articles on Analytics Vidhya describing the usage of this library. For my use case, here is the configuration for the plot:
import plotly.graph_objects as go

fig = go.Figure()

fig.add_trace(go.Scatter(x=doc_data.index,

                         y=doc_data['Historic Glucose (mg/dL)'].rolling(5).mean(),

                         mode='lines',

                         marker=dict(

                             size=20,

                             line_width=2,

                             colorscale='Rainbow',

                             showscale=True,

                        ),

                         name = 'Historic Glucose (mg/dL)'

                    ))

fig.update_layout(xaxis_tickangle=-45,

                  font=dict(size=15),

                  yaxis={'visible': True},

                  xaxis_title='Dates',

                  yaxis_title='Glucose',

                  template='plotly_dark',

                  title='Glucose Level Over Time'

                 )

fig.update_layout(hovermode="x")
Conclusion
In this article, I explained what are doc files, the difference between Doc and Docx file extensions, conversion of Doc files into Docx files, loading and manipulation of Docx files, and finally how to load this tabular data into a pandas dataframe.
If you want to read/explore every article of mine, then head over to my master article list which gets updated every time I publish a new article on any platform!
For any doubts, queries, or potential opportunities, you can reach out to me via:
1. Linkedin — in/kaustubh-gupta/
2. Twitter — @Kaustubh1828
3. GitHub — kaustubhgupta
4. Medium — @kaustubhgupta1828
Kaustubh Gupta
15 Sep, 2021
Hi, I am a Python Developer with an interest in Data Analytics and am on the path of becoming a Data Engineer in the upcoming years. Along with a Data-centric mindset, I love to build products involving real-world use cases. I know bits and pieces of Web Development without expertise: Flask, Fast API, MySQL, Bootstrap, CSS, JS, HTML, and learning ReactJS. I also do open source contributions, not in association with any project, but anything which can be improved and reporting bug fixes for them.


