Everything you need to know about Hypothesis Testing in Machine Learning
This article was published as a part of the Data Science Blogathon
What is Hypothesis Testing?
Any data science project starts with exploring the data. When we perform an analysis on a sample through exploratory data analysis and inferential statistics we get information about the sample. Now, we want to use this information to predict values for the entire population.
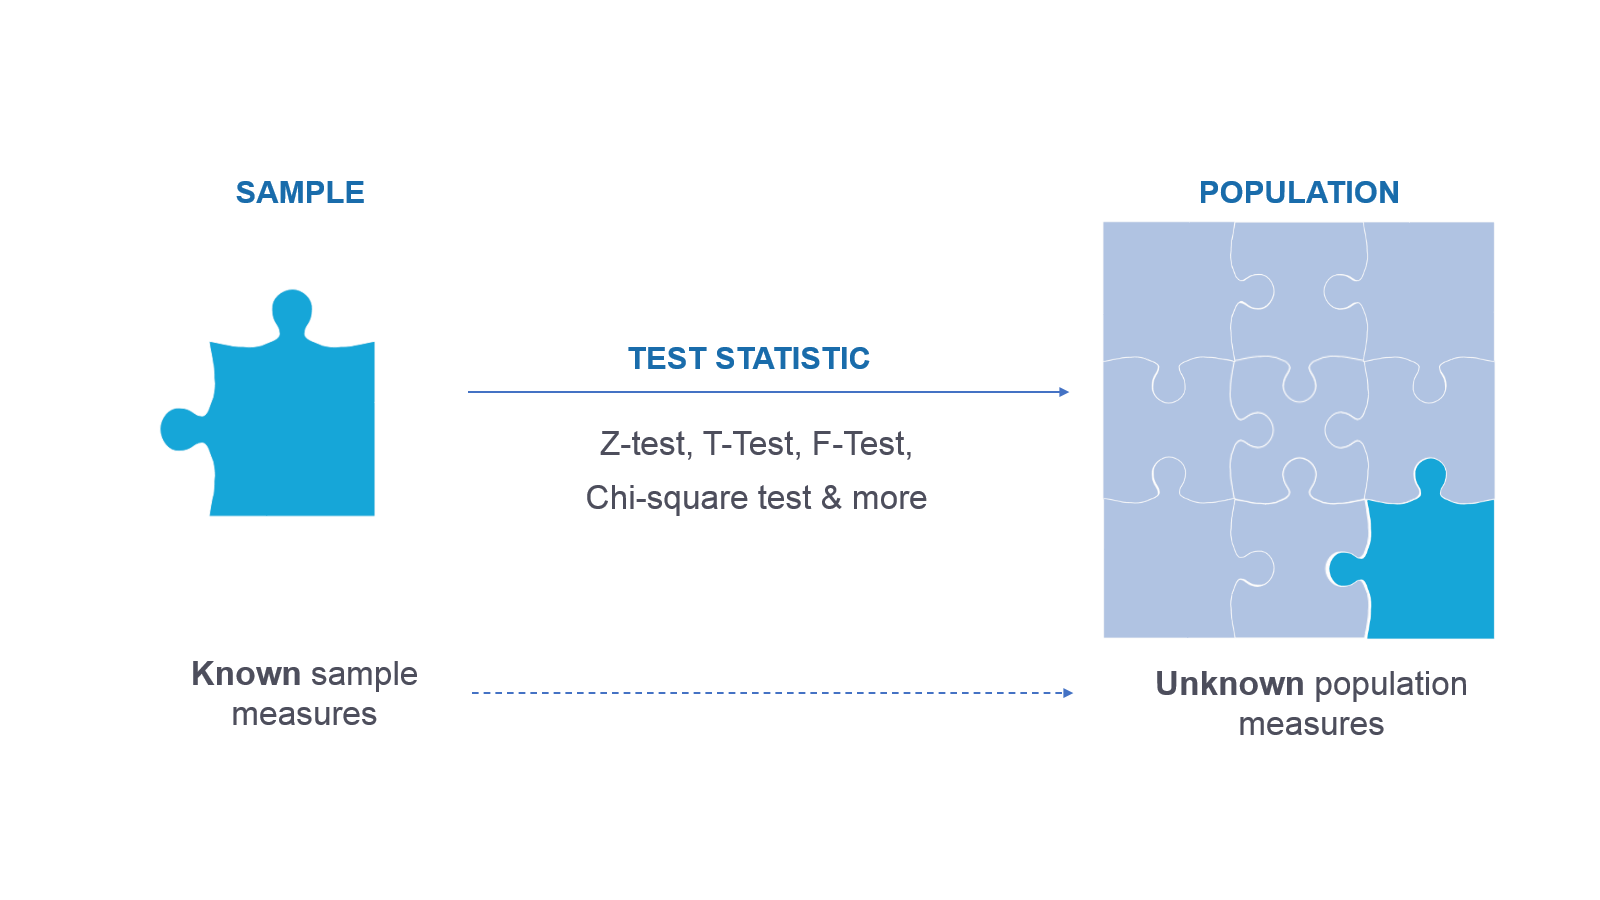
Hypothesis testing is done to confirm our observation about the population using sample data, within the desired error level. Through hypothesis testing, we can determine whether we have enough statistical evidence to conclude if the hypothesis about the population is true or not.
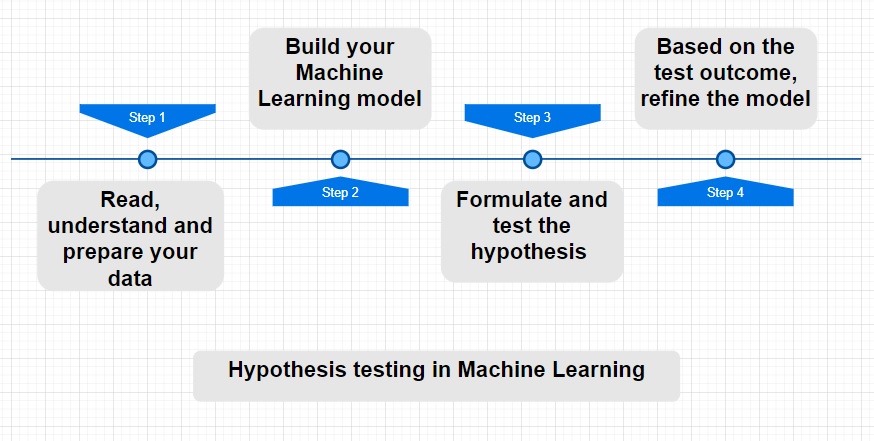
How to perform hypothesis testing in machine learning?
To trust your model and make predictions, we utilize hypothesis testing. When we will use sample data to train our model, we make assumptions about our population. By performing hypothesis testing, we validate these assumptions for a desired significance level.
Let’s take the case of regression models: When we fit a straight line through a linear regression model, we get the slope and intercept for the line. Hypothesis testing is used to confirm if our beta coefficients are significant in a linear regression model. Every time we run the linear regression model, we test if the line is significant or not by checking if the coefficient is significant. I have shared details on how you can check these values in python, towards the end of this blog.
Key steps to perform hypothesis test are as follows:
- Formulate a Hypothesis
- Determine the significance level
- Determine the type of test
- Calculate the Test Statistic values and the p values
- Make Decision
Now let’s look into the steps in detail:
Formulating the hypothesis
One of the key steps to do this is to formulate the below two hypotheses:
The null hypothesis represented as H₀ is the initial claim that is based on the prevailing belief about the population.
The alternate hypothesis represented as H₁ is the challenge to the null hypothesis. It is the claim which we would like to prove as True
One of the main points which we should consider while formulating the null and alternative hypothesis is that the null hypothesis always looks at confirming the existing notion. Hence, it has sign >= or , < and ≠
Determine the significance level also known as alpha or α for Hypothesis Testing
The significance level is the proportion of the sample mean lying in critical regions. It is usually set as 5% or 0.05 which means that there is a 5% chance that we would accept the alternate hypothesis even when our null hypothesis is true
Based on the criticality of the requirement, we can choose a lower significance level of 1% as well.
Determine the Test Statistic and calculate its value for Hypothesis Testing
Hypothesis testing uses Test Statistic which is a numerical summary of a data-set that reduces the data to one value that can be used to perform the hypothesis test.
Select the type of Hypothesis test
We choose the type of test statistic based on the predictor variable – quantitative or categorical. Below are a few of the commonly used test statistics for quantitative data
| Type of predictor variable | Distribution type | Desired Test | Attributes |
| Quantitative | Normal Distribution | Z – Test |
|
| Quantitative | T Distribution | T-Test |
|
| Quantitative | Positively skewed distribution | F – Test |
|
| Quantitative | Negatively skewed distribution | NA |
|
| Categorical | NA | Chi-Square test |
|
Z-statistic – Z Test
Z-statistic is used when the sample follows a normal distribution. It is calculated based on the population parameters like mean and standard deviation.
One sample Z test is used when we want to compare a sample mean with a population mean
Two sample Z test is used when we want to compare the mean of two samples
T-statistic – T-Test
T-statistic is used when the sample follows a T distribution and population parameters are unknown. T distribution is similar to a normal distribution, it is shorter than normal distribution and has a flatter tail.
F-statistic – F test
For samples involving three or more groups, we prefer the F Test. Performing T-test on multiple groups increases the chances of Type-1 error. ANOVA is used in such cases.
Analysis of variance (ANOVA) can determine whether the means of three or more groups are different. ANOVA uses F-tests to statistically test the equality of means.
F-statistic is used when the data is positively skewed and follows an F distribution. F distributions are always positive and skewed right.
F = Variation between the sample means/variation within the samples
For negatively skewed data we would need to perform feature transformation
Chi-Square Test
For categorical variables, we would be performing a chi-Square test.
Following are the two types of chi-squared tests:
- Chi-squared test of independence – We use the Chi-Square test to determine whether or not there is a significant relationship between two categorical variables.
- Chi-squared Goodness of fit helps us determine if the sample data correctly represents the population.
The decision about your model
Test Statistic is then used to calculate P-Value. A P-value measures the strength of evidence in support of a null hypothesis. If the P-value is less than the significance level, we reject the null hypothesis.
if the p-value < α, then we have statistically significant evidence against the null hypothesis, so we reject the null hypothesis and accept the alternate hypothesis
if the p-value > α then we do not have statistically significant evidence against the null hypothesis, so we fail to reject the null hypothesis.
As we make decisions, it is important to understand the errors that can happen while testing.
Errors while making decisions
There are two possible types of error we could commit while performing hypothesis testing.
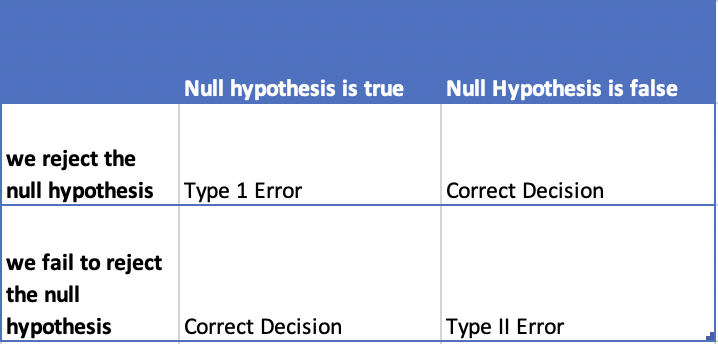
1) Type1 Error – This occurs when the null hypothesis is true but we reject it.The probability of type I error is denoted by alpha (α). Type 1 error is also known as the level of significance of the hypothesis test
2) Type 2 Error – This occurs when the null hypothesis is false but we fail to reject it. The probability of type II error is denoted by beta (β)
Hypothesis testing in python
The stats model library has the unique ability to perform and summarize the outcomes of hypothesis tests on your model. Based on your feature variables, you can determine which test value is relevant for your model and make decisions accordingly.
import statsmodels.api as sm
To create a fitted model, I have used Ordinary least squares
lr = sm.OLS(y_train, X_train_lm).fit()
Once we have trained the model, we can see the summary of the tests using the command
print(lr.summary())
The model summary will look something like below.
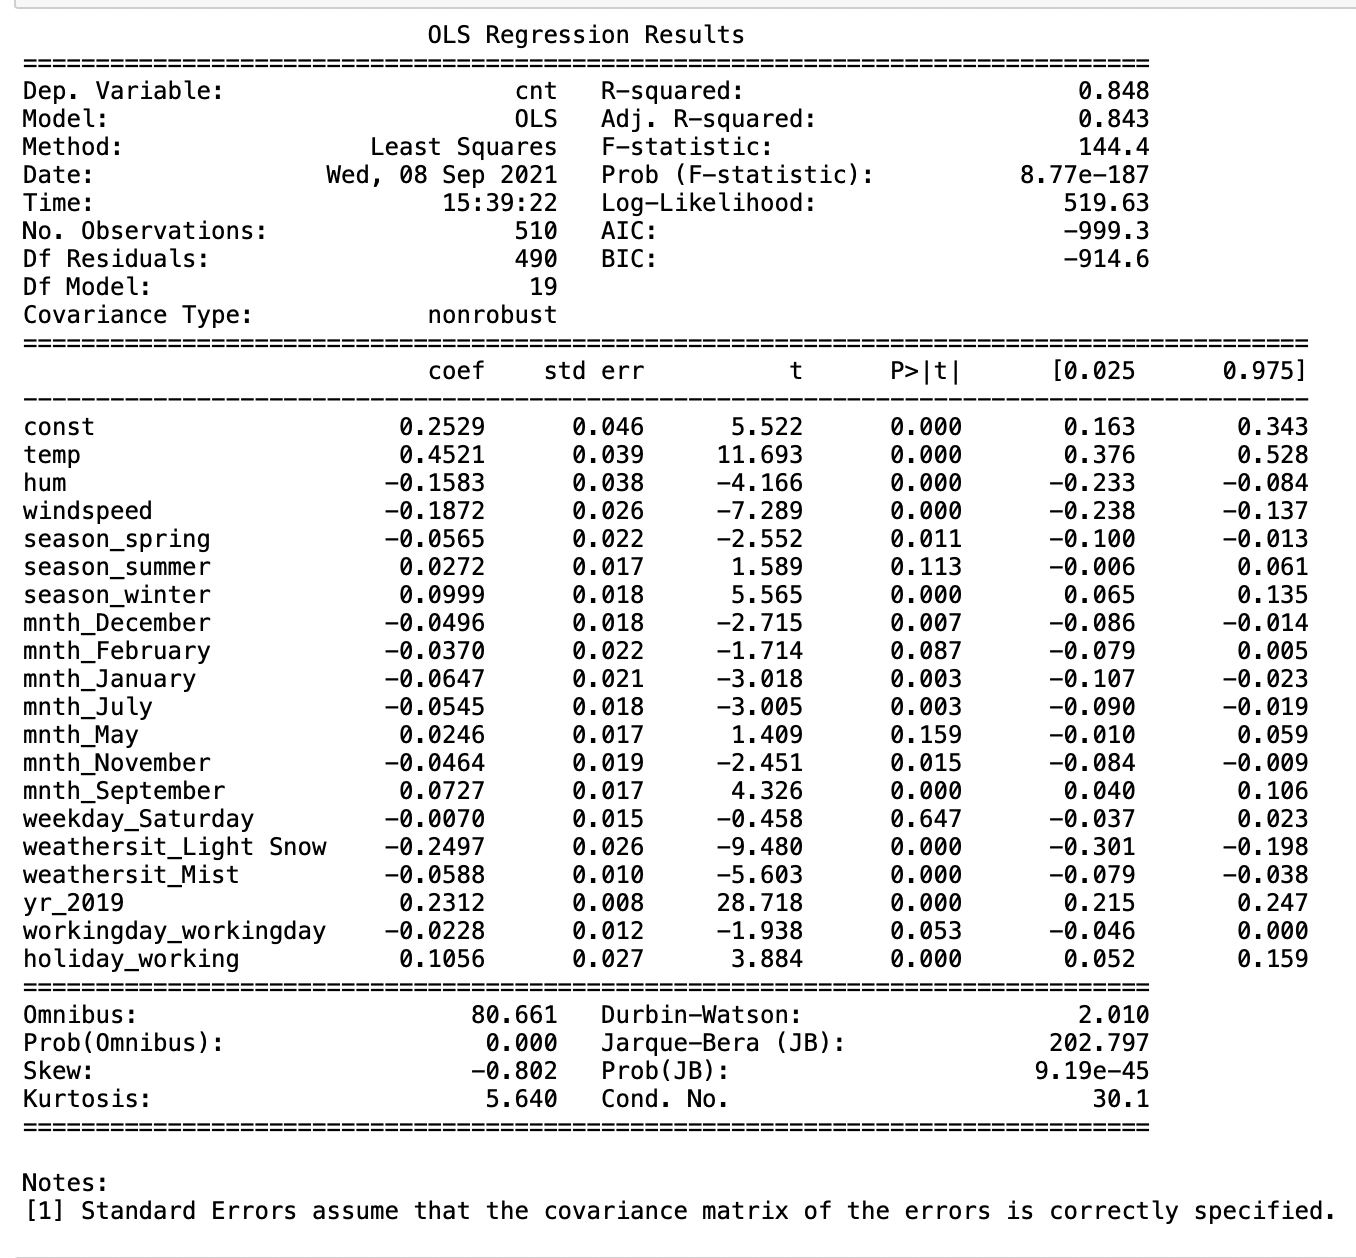
From a hypothesis testing standpoint, you need to pay attention to the following values decide if you need to refine your model
- Prob (F-statistic) – F-statistic tells us the goodness of fit of regression. You want the probability of F-statistic to be as low as possible to reject the null hypothesis.
- P-value is given in the column P>|t| – As mentioned above, for a good model, we want this value to be less than the significance level.
This is all about hypothesis testing in this article.
Image source: All images in this blog have been created by the author
The media shown in this article are not owned by Analytics Vidhya and are used at the Author’s discretion.


this article very help full to understand about the hypothesis testing :)