This article was published as a part of the Data Science Blogathon
Image Segmentation helps to obtain the region of interest (ROI) from the image. It is the process of separating an image into different areas. The parts into which the image is divided are called Image Objects. It is done based on the image properties like similarity, discontinuity, etc. The goal of image segmentation is to simplify the image for better analysis. It is the process of assigning labels to every pixel in an image. Image segmentation has wide applications in Machine Learning, Computer Vision, AI, Medical imaging, Recognition tasks, Video surveillance, Object detection, etc. It impacts several domains, from healthcare to space science.
In this article, we will be discussing different image segmentation algorithms like- Otsu’s segmentation, Edge-based segmentation algorithms, Region-based segmentation algorithms, Clustering-based segmentation algorithms, Neural networks for segmentation, and Watershed segmentation algorithms.
Below are methods for image segmentation with implementation code in python.
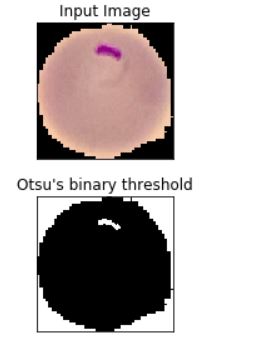
It comes under threshold-based segmentation. In Otsu’s Segmentation, the input image is first processed, and then we try to obtain the histogram of the image, which will show the distribution of pixels in the image. Here we focus on peak value. The next step is to compute the threshold value and compare it with the image pixels. Set the pixel to white; if they are greater than the threshold else, set it to black.
Thus, it performs automatic thresholding. This method is not suitable for noisy images. Applications include scanning documents, recognizing patterns.
# SEGMENTATION
import numpy as np
import cv2
from matplotlib import pyplot as plt
img = cv2.imread(r'C33P1thinF_IMG_20150619_114756a_cell_181.png')
b,g,r = cv2.split(img)
rgb_img = cv2.merge([r,g,b])
gray = cv2.cvtColor(img,cv2.COLOR_BGR2GRAY)
ret, thresh = cv2.threshold(gray,0,255,cv2.THRESH_BINARY_INV+cv2.THRESH_OTSU)
# noise removal
kernel = np.ones((2,2),np.uint8)
#opening = cv2.morphologyEx(thresh,cv2.MORPH_OPEN,kernel, iterations = 2)
closing = cv2.morphologyEx(thresh,cv2.MORPH_CLOSE,kernel, iterations = 2)
# sure background area
sure_bg = cv2.dilate(closing,kernel,iterations=3)
# Finding sure foreground area
dist_transform = cv2.distanceTransform(sure_bg,cv2.DIST_L2,3)
# Threshold
ret, sure_fg = cv2.threshold(dist_transform,0.1*dist_transform.max(),255,0)
# Finding unknown region
sure_fg = np.uint8(sure_fg)
unknown = cv2.subtract(sure_bg,sure_fg)
# Marker labelling
ret, markers = cv2.connectedComponents(sure_fg)
# Add one to all labels so that sure background is not 0, but 1
markers = markers+1
# Now, mark the region of unknown with zero
markers[unknown==255] = 0
markers = cv2.watershed(img,markers)
img[markers == -1] = [255,0,0]
plt.subplot(211),plt.imshow(rgb_img)
plt.title('Input Image'), plt.xticks([]), plt.yticks([])
plt.subplot(212),plt.imshow(thresh, 'gray')
plt.imsave(r'thresh.png',thresh)
plt.title("Otsu's binary threshold"), plt.xticks([]), plt.yticks([])
plt.tight_layout()
plt.show()
Output:
In this method, an edge filter is applied to the image. The image pixels are then classified as edge or non-edge depending on the filter output. Edge detection helps to remove unwanted and unnecessary information from the image. It includes 2 steps- Edge detection and edge linking.
The different types of edge detection operators are:
i. Robert operator: It highlights regions of high spatial frequency
ii. Prewitt operator: It is used for detecting vertical and horizontal edges in images
iii. Sobel operator: It is used for detecting vertical and horizontal edges in images. Similar to Prewitt
% Read Input Image
input_image = imread('[name of input image file].[file format]');
% Displaying Input Image
input_image = uint8(input_image);
figure, imshow(input_image); title('Input Image');
% Convert the truecolor RGB image to the grayscale image
input_image = rgb2gray(input_image);
% Convert the image to double
input_image = double(input_image);
% Pre-allocate the filtered_image matrix with zeros
filtered_image = zeros(size(input_image));
% Robert Operator Mask
Mx = [1 0; 0 -1];
My = [0 1; -1 0];
% Edge Detection Process
% When i = 1 and j = 1, then filtered_image pixel
% position will be filtered_image(1, 1)
% The mask is of 2x2, so we need to traverse
% to filtered_image(size(input_image, 1) - 1
%, size(input_image, 2) - 1)
for i = 1:size(input_image, 1) - 1
    for j = 1:size(input_image, 2) - 1
        % Gradient approximations
        Gx = sum(sum(Mx.*input_image(i:i+1, j:j+1)));
        Gy = sum(sum(My.*input_image(i:i+1, j:j+1)));
        % Calculate magnitude of vector
        filtered_image(i, j) = sqrt(Gx.^2 + Gy.^2);
    end
end
% Displaying Filtered Image
filtered_image = uint8(filtered_image);
figure, imshow(filtered_image); title('Filtered Image');
% Define a threshold value
thresholdValue = 100; % varies between [0 255]
output_image = max(filtered_image, thresholdValue);
output_image(output_image == round(thresholdValue)) = 0;
% Displaying Output Image
output_image = im2bw(output_image);
figure, imshow(output_image); title('Edge Detected Image');
% Read Input Image
input_image = imread('[name of input image file].[file format]');
% Displaying Input Image
input_image = uint8(input_image);
figure, imshow(input_image); title('Input Image');
% Convert the truecolor RGB image to the grayscale image
input_image = rgb2gray(input_image);
% Convert the image to double
input_image = double(input_image);
% Pre-allocate the filtered_image matrix with zeros
filtered_image = zeros(size(input_image));
% Prewitt Operator Mask
Mx = [-1 0 1; -1 0 1; -1 0 1];
My = [-1 -1 -1; 0 0 0; 1 1 1];
% Edge Detection Process
% When i = 1 and j = 1, then filtered_image pixel
% position will be filtered_image(2, 2)
% The mask is of 3x3, so we need to traverse
% to filtered_image(size(input_image, 1) - 2
%, size(input_image, 2) - 2)
% Thus we are not considering the borders.
for i = 1:size(input_image, 1) - 2
for j = 1:size(input_image, 2) - 2
% Gradient approximations
Gx = sum(sum(Mx.*input_image(i:i+2, j:j+2)));
Gy = sum(sum(My.*input_image(i:i+2, j:j+2)));
% Calculate magnitude of vector
filtered_image(i+1, j+1) = sqrt(Gx.^2 + Gy.^2);
end
end
% Displaying Filtered Image
filtered_image = uint8(filtered_image);
figure, imshow(filtered_image); title('Filtered Image');
% Define a threshold value
thresholdValue = 100; % varies between [0 255]
output_image = max(filtered_image, thresholdValue);
output_image(output_image == round(thresholdValue)) = 0;
% Displaying Output Image
output_image = im2bw(output_image);
figure, imshow(output_image); title('Edge Detected Image');
from skimage.feature import canny

edges = canny(coins/255.)

fig, ax = plt.subplots(figsize=(4, 3))

ax.imshow(edges, cmap=plt.cm.gray, interpolation='nearest')

ax.axis('off')

ax.set_title('Canny detector')

from scipy import ndimage as ndi

fill_coins = ndi.binary_fill_holes(edges)

fig, ax = plt.subplots(figsize=(4, 3))

ax.imshow(fill_coins, cmap=plt.cm.gray, interpolation='nearest')

ax.axis('off')

ax.set_title('Filling the holes')

from skimage import morphology

coins_cleaned = morphology.remove_small_objects(fill_coins, 21)

fig, ax = plt.subplots(figsize=(4, 3))

ax.imshow(coins_cleaned, cmap=plt.cm.gray, interpolation='nearest')

ax.axis('off')

ax.set_title('Removing small objects')
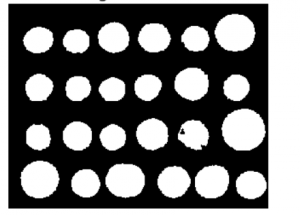
Here we grow the regions recursively by including the neighbour pixels which are similar and connected to that pixel, and we will use similarity measures for regions with homogeneous grey levels. The process is iterated in the same way as any general data clustering algorithm. Some of the advantages of this method include faster and easier computation, better performance etc.
from skimage.filters import sobel

elevation_map = sobel(coins)

fig, ax = plt.subplots(figsize=(4, 3))

ax.imshow(elevation_map, cmap=plt.cm.gray, interpolation='nearest')

ax.axis('off')

ax.set_title('elevation_map')

markers = np.zeros_like(coins)

markers[coins < 30] = 1

markers[coins > 150] = 2

fig, ax = plt.subplots(figsize=(4, 3))

ax.imshow(markers, cmap=plt.cm.spectral, interpolation='nearest')

ax.axis('off')

ax.set_title('markers')

segmentation = morphology.watershed(elevation_map, markers)

fig, ax = plt.subplots(figsize=(4, 3))

ax.imshow(segmentation, cmap=plt.cm.gray, interpolation='nearest')

ax.axis('off')

ax.set_title('segmentation')

from skimage.color import label2rgb

segmentation = ndi.binary_fill_holes(segmentation - 1)

labeled_coins, _ = ndi.label(segmentation)

image_label_overlay = label2rgb(labeled_coins, image=coins)

fig, (ax1, ax2) = plt.subplots(1, 2, figsize=(6, 3), sharex=True, sharey=True)

ax1.imshow(coins, cmap=plt.cm.gray, interpolation='nearest')

ax1.contour(segmentation, [0.5], linewidths=1.2, colors='y')

ax1.axis('off')

ax1.set_adjustable('box-forced')

ax2.imshow(image_label_overlay, interpolation='nearest')

ax2.axis('off')

ax2.set_adjustable('box-forced')

fig.subplots_adjust(**margins)
Output:
It includes methods like fuzzy c-means, k-means, improved k-means, etc. Here we will take each point as a separate cluster and merge two clusters with the minimum inter-cluster distance. Repeat this step until clustering is satisfactory.
Another approach is using K means algorithm where we select K points and assign them a cluster center by calculating the mean. Now, allocate other points nearest to the particular centers and form clusters. Repeat unlit the cluster centers don’t change.
Python Code implementation:
import math
n=int(input("Enter the number of points = "))
l1=[]
l2=[]
for i in range (1,n+1):
    l1.append(int(input("Enter the x-co-ordinate of %d point = "%(i))))
    l2.append(int(input("Enter the y-co-ordinate of %d point = "%(i))))
l=zip(l1,l2)                            #combines the 2lists to create a list of tuples #((1,1),(2,1))
p=list(l)                               #converts l to list           [(1,1),(2,1)]
print("The points are = ",p)
a=int(input("Enter the number of clusters = "))
k=[]
b=[]
for i in range (0,a):                   #a -> no. of clusters
    m=list(p[i])                        #converts each tuple(consisting of co-ordinates) to list [[1,1],[2,1]]
    k.append(m)                         #list carrying the centroids
    b.append(m)                         #copy of centroids used later to chk if the repeat
print("The centroids are = ",k)
print()
y=[]                                    #distance matrix
while True:
    for j in range (0,a):
        x=[]                            #sublist in y considering dist of each pt from each cluster
        for i in range (0,n):
            q=math.pow(p[i][0]-k[j][0],2)
            w=math.pow(p[i][1]-k[j][1],2)
            t=math.sqrt(q+w)
            x.append(t)
            h=list(x)
        y.append(h)
    print("The distance of all points from centroid is : ")
    print()
    for i in range (0,a):
        for j in range (0,n):
            v=y[i][j]
            print("{:.2f}".format(v))      # a=13.946 print("{0:.2f}".format(a)) #13.95
        print()
    print()
    g=[]                                #new cluster
    for i in range (0,a):
        g.append([])                    #creating sublists in g which is equal to no. of clusters
    for i in range (0,n):
        min1=y[0][i]                    #dist of pt from 1st cluster
        for j in range (1,a):
            if(min1>y[j][i]):
                g[j].append(i)
            else:
                g[0].append(i)
    print("New clusters are :",g)
    print()
    k.clear()                           #cal new centroids
    for i in range(0,a):
        j=0
        s1=0.0
        s2=0.0
        while(j<len(g[i])):
            e=g[i][j]
            s1=s1+l1[e]
            s2=s2+l2[e]
            j=j+1
        c1=s1/len(g[i])
        c2=s2/len(g[i])
        k.append([c1,c2])
    print("The new centroids are = ",k)
    print()
    x.clear()
    y.clear()
    g.clear()
    if(b==k):
        break
    else:
        b.clear()
        b=k
print()
print("Final centroids are = ",k)
Segmentation may require large neural networks. CNN is most widely used for object detection, pattern recognition etc. It can even process large datasets. They are used for image segmentation due to their high accuracy. It works as a hierarchical model with various layers and results in a segmented image as the output.
import tensorflow as tf
from tensorflow import keras
from tensorflow.keras.models import Sequential
from tensorflow.keras.layers import Dense, Dropout, Activation, Flatten
from tensorflow.keras.layers import Conv2D, MaxPooling2D
model = Sequential()
model.add(Conv2D(filters=16,kernel_size=3,padding="same",activation="relu",input_shape=(50,50,1)))
model.add(MaxPooling2D(pool_size=2))
model.add(Conv2D(filters=32,kernel_size=3,padding="same",activation="relu"))
model.add(MaxPooling2D(pool_size=2))
model.add(Conv2D(filters=64,kernel_size=3,padding="same",activation="relu"))
model.add(MaxPooling2D(pool_size=2))
model.add(Dropout(0.2))
model.add(Flatten())
model.add(Dense(200,activation='relu'))
model.add(Dropout(0.5))
model.add(Dense(2,activation='softmax'))
model.summary()
model.compile(loss="categorical_crossentropy",optimizer='adam',metrics=['accuracy'])
model.fit(X_train,y_train,batch_size=50,epochs=20,verbose=1)
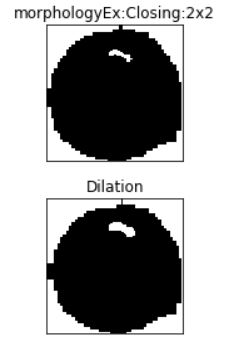
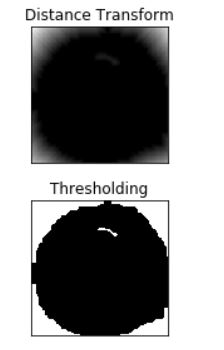
It is based on a topological interpretation of image boundaries. The closing operation helps close small holes inside the foreground objects, or small black points on the object. Morphological dilation will make objects more visible, and it fills small holes in the objects. Distance transform is calculated using the Euclidean distance formula. These distance values are calculated for all the pixels in an image, and a distance matrix is formed. It is an input for watershed transform.
Watershed segmentation can segment multiple objects in a single threshold setting. If the threshold is not set properly, then the objects can result in over-segmented or unsegmented images. It then creates the matrix of the distance between each pixel called label matrix. The label matrix is then fed as an input to the watershed. Then watershed segmentation is applied in which the image is segmented into regions where conceptually rainwater would flow into the same lake by identifying local minima in the image. This will result in segmenting the image.
Python Code implementation for Watershed segmentation:
# SEGMENTATION
import numpy as np
import cv2
from matplotlib import pyplot as plt
img = cv2.imread(r'C33P1thinF_IMG_20150619_114756a_cell_181.png')
b,g,r = cv2.split(img)
rgb_img = cv2.merge([r,g,b])
gray = cv2.cvtColor(img,cv2.COLOR_BGR2GRAY)
ret, thresh = cv2.threshold(gray,0,255,cv2.THRESH_BINARY_INV+cv2.THRESH_OTSU)
plt.subplot(211),plt.imshow(closing, 'gray')
plt.title("morphologyEx:Closing:2x2"), plt.xticks([]), plt.yticks([])
plt.subplot(212),plt.imshow(sure_bg, 'gray')
plt.imsave(r'dilation.png',sure_bg)
plt.title("Dilation"), plt.xticks([]), plt.yticks([])
plt.tight_layout()
plt.show()
Output:
plt.subplot(211),plt.imshow(dist_transform, 'gray')
plt.title("Distance Transform"), plt.xticks([]), plt.yticks([])
plt.subplot(212),plt.imshow(sure_fg, 'gray')
plt.title("Thresholding"), plt.xticks([]), plt.yticks([])
plt.tight_layout()
plt.show()
Output:
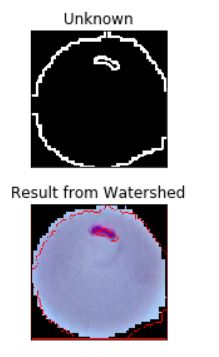
plt.subplot(211),plt.imshow(unknown, 'gray')
plt.title("Unknown"), plt.xticks([]), plt.yticks([])
plt.subplot(212),plt.imshow(img, 'gray')
plt.title("Result from Watershed"), plt.xticks([]), plt.yticks([])
plt.tight_layout()
plt.show()
Output:
A. The best image segmentation algorithm depends on the specific requirements and characteristics of the task at hand. There is no one-size-fits-all “best” algorithm, as different methods excel in different scenarios. Some popular image segmentation algorithms include:
1. U-Net: Effective for biomedical image segmentation and similar tasks.
2. Mask R-CNN: Suitable for instance segmentation, identifying multiple objects within an image.
3. GrabCut: A simple and widely used interactive segmentation algorithm.
4. Watershed Transform: Useful for segmenting objects with clear boundaries.
5. K-means Clustering: Simple and fast, but works best for images with distinct color regions.
The choice of algorithm depends on factors such as dataset size, image complexity, required accuracy, and computational resources available. Researchers and practitioners often experiment with multiple algorithms to find the most appropriate one for their specific application.
A. Image segmentation is the process of dividing an image into distinct regions or segments to facilitate analysis and understanding. For instance, in medical imaging, segmenting organs from a scan helps in diagnosis. In autonomous vehicles, segmenting objects like pedestrians and vehicles assists in real-time perception and decision-making.
Thus Segmentation is used to isolate the desired object from the image in order to perform an analysis of the object. CNN is a good approach for image segmentation but it can take more time during training if the dataset is huge. Clustering-based segmentation takes huge computation time. Edge-based segmentation is good for images having better contrast between objects.
The media shown in this article are not owned by Analytics Vidhya and are used at the Author’s discretion.
Lorem ipsum dolor sit amet, consectetur adipiscing elit,


