This article was published as a part of the Data Science Blogathon
Introduction to Geometric Intuition of Logistic Regression
Hello folks! You may generally come across the term classification and regression in our data science or machine learning community, this two are the main pillars of machine learning. classification is all about predicting the label and regression is all about predicting the real-valued data. There are many machine learning algorithms which we will use for the classification tasks, generally, most of you use the naive Bayes, KNN, logistic regression. So, here we will discuss details of logistic regression works, what is geometrical intuition, what is mathematical intuition, etc… Before going ahead we will take a brief introduction to logistic regression for better understanding.
 Image 1
Logistic Regression
Here, the name suggests logistic regression that it is a regression algorithm but stop thinking that!!! in reality, it’s a classification algorithm. It is the most popular classification machine learning algorithm that is used to solve many real-world problems. It is called regression because its main assumption is to find the line or plane which linearly separates the classes label. As it separates linearly to the data points so it will term as a regression. It is a very very simple algorithm by geometrically we can easily understand the flow of the algorithm.
We can derive logistic regression from multiple perspectives such as from probabilistic interpretation, loss- function but here we will see how to derive the logistic regression from the geometric intuition because geometry is much more visual much more easy to understand the problem. We also go through the probabilistic and loss-function approach but not in deep.
Let’s start>>
Understanding Geometric intuition of Logistic Regression
We didn’t have to forget our assumptions, the logistic regression is trying to find a line or a plane that linearly separates the class labels. on the basis of this assumption, we draw our plane and data points.
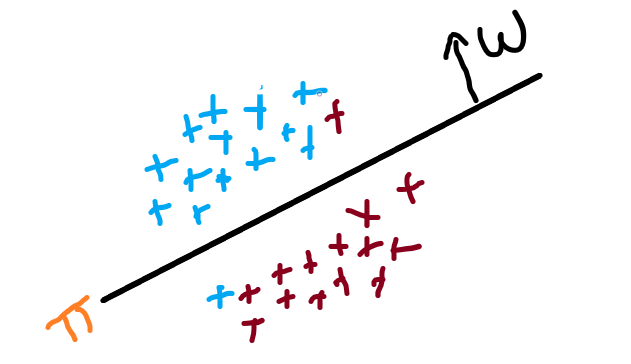
Imagine if we have two classes of points as you see in the image all the red points are our negative labeled points and all blue points are our positive labeled points, and draw a plane if it is in 2-D or if it is in N-D then draw a hyperplane. So, we draw a plane π which is linear separates the datapoints. as you can see in the image that on the plane there is normal W which is perpendicular to the plane.
We know that the equation of a plane in high dimensions is:
plane (π) = W^X + b
if the plane passes through the origin then b=0. overall we have to find or discovered the W and b which corresponds to the plane such that the plane π separates the +ve and -ve points.
Suppose we take a datapoint Xi as you see in the image which is our query point and we have to find a distance of that point from the plane (π). So the distance Di is written as:
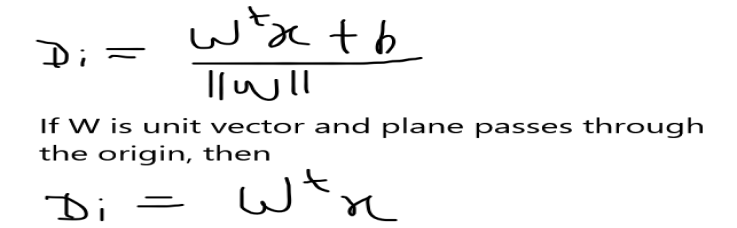
So this is the distance of the point Xi from the plane but how would you determine that the current distance of the point is considered as positive or negative?
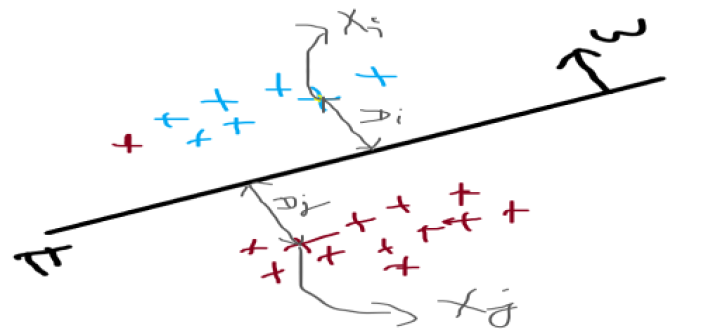
As you can see in the image that the one side our point Xi and another side there is point Xj and we have corresponding class label Y, the distance of Xi to plane is Di, and Xj to the plane are Dj. so we take constraints as:
* If Xi and normal W are lying on the same side or in the same direction then we considered that the distance Di > 0 or Yi is positive.
* if Xj and its distance Dj are opposite of the normal W then we considered that the distance Dj< 0 or Yj is negative.
How you can say that a certain point is positively or negatively predicted? so let’s check some simplifying assumptions or cases:
1. if our class label is positive Yi = +ve (actual class label) and the W^Xi > 0 or Xi and W lie on the same side then the classifier is predicted that the class label is also positive means its prediction is true.
2. if our class label is negative Yi = -ve(actual class label) and the W^Xi < 0 means point is opposite of the W then the classifier predicted the correct class label.
3. if our class label is positive Yi = +ve (actual class label) and the W^Xi < 0, So when this will happen then our actual class label is +ve and the classifier is predicted its -ve then the prediction is wrong.
4. if our class label is negative Yi = -ve(actual class label) and the W^Xi > 0, So our actual class label is -ve and the classifier predicted its +ve then the prediction is false.
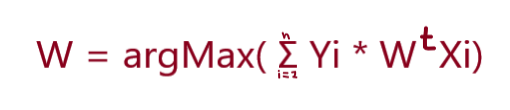
So our conclusion from the above cases is that classifiers have to predict the maximum number of correctly predicted points and a minimum number of incorrect predictions. So we have to find that optimal plane that maximizes the correctly predicted points and having a minimum no, of incorrect points.
So our optimal Equation will be:
How outlier will impact the model?
Generally, in our data, there are outliers are also present and they will impact our model performance, So let’s take a simple example to better understand how the model performance got impacted by the outlier.
Suppose, we take an example of two plans π1 and π2 that are used to separate the two-class label data points +ve and -ve.
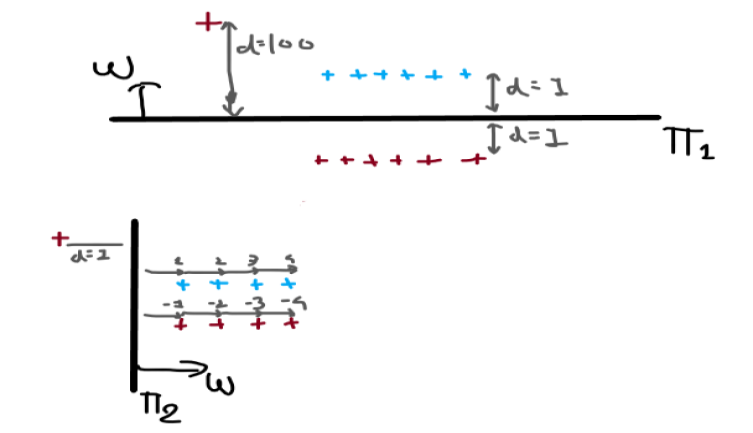
As you can see in the image there are plane π1 and plane π2 which separates two class label data points positive and negative. These points are equidistant from the plane as you can see in the image and there is one outlier present which was farther away from the plane π1 as compare to other data points and very close to π2 as compare to other data points.
If we calculate the Yi * W^Xi of π1 then it will be negative and for the plane π2, it will be positive. So as per our calculation, we conclude that the plane π2 is best fit the plane that we are finding and plane π1 is a dumb plane, Don’t think that in reality if we see that our plane π1 gives use best accuracy then our plane π2. π2 didn’t correctly classify the more no. of point as compare to π1. So such outliers impact more on our model.
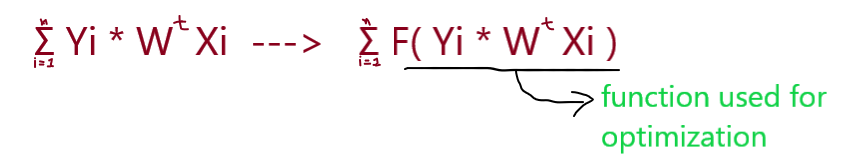
To preserving the model from the outlier we have to modify our optimal function W* = argmax( Σ Yi * W^Xi ). We will use Squashing.
Modifying Optimal Function using Squashing
To modifying our optimal function we will use the squashing technique, the idea is that:
1. if signed distance or the distance of a point from the plane is small then we will use it as is.
2. if the signed distance is large that we saw in the previous example, then we convert it into a smaller value.
We will use some function over our optimal equation for preserving the model from such outliers. Below you can see that we will convert optimal term by applying the squashing technique.
We will use the sigmoid (σ(x) )function to optimizing our equation. If the distance of Xi is increased from the higher plane then our sigmoid function squash that distance into the value between 0 – 1. It provides probabilistic interpretations.
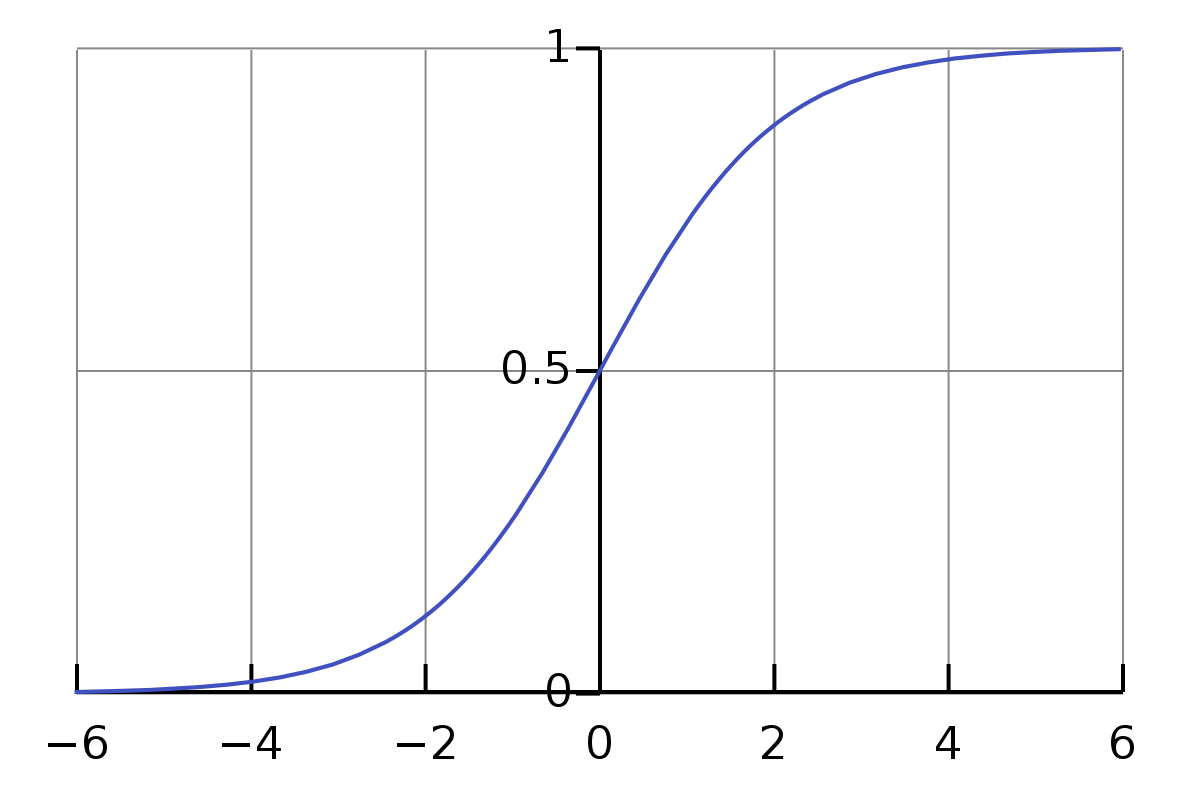
Image 2
The sigmoid function is written as:
σ(x) = 1/ (1 + e-x )
maximum value of sigmoid function is: 1
minimum value of sigmoid function is: 0
And, if the distance of point Xi from the plane is 0 then its probability will be 0.5.
After applying the sigmoid function to our optimal equation then our function looks like this:
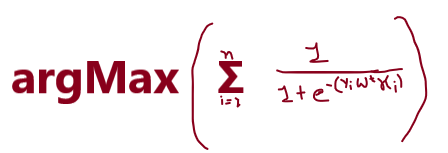
So, this is our optimal sigmoid function which will help for preserving the optimal equation from the outlier.
End Notes
So this is the geometric intuition of the logistic regression, and further, we solve our optimal function by using some interpretation in part 2. So hope you like this article.
Thank You.
Connect with me on Linkedin: Mayur_Badole
Image Sources
- Image 1 – https://engineering.eckovation.com/assumptions-regression-models/
- Image 2 – https://en.wikipedia.org/wiki/Logistic_regression
The media shown in this article are not owned by Analytics Vidhya and are used at the Author’s discretion.


So this final equation solved by gradient decent method, what is the role of coat function then?