This article was published as a part of the Data Science Blogathon
In this article, I’ll go over Market Basket Analysis and how to use it in R.
Table of Contents:
1. Market Basket Analysis
2. How is it used?
3. Association Rules
4. Applications
5. The Dataset
6. Math’s in Market Basket Analysis
7. Apriori Recommendation with R
8. Sorting
9. Redundancies
10. Targeting Items
11. Visualization
What is Market Basket Analysis?
Market Basket Analysis is one of the key techniques used to uncover links between items by large retailers. It works by searching for combinations of items that often happen in transactions together. In a different way, retailers can identify relations among the items they buy.
It is a method of identifying object associations that “go together” in a commercial context. Market basket analysis, in actuality, goes beyond the supermarket scenario from which it gets its name. The investigation of any collection of commodities to uncover affinities that may be exploited in some way is known as market basket analysis. In big transactional or relational data sets, frequent itemset mining leads to the finding of relationships and correlations between items. With vast volumes of data being collected and stored on a regular basis, many companies are interested in extracting patterns from their databases. Many commercial decision-making processes, such as catalogue design, cross-marketing, and customer buying behaviour research, might benefit from the finding of interesting correlation patterns across massive amounts of business transaction records.
Association rules are widely used to analyse retail basket or transaction data, with the objective of establishing strong rules based on a strong transaction information rules concept.
Market Basket Analysis uses the information to:
- Capable of recognizing customer purchasing patterns
- To identify who customers are(not by name)
- Understand why you buy certain items
Learn about your goods (products):
- Slow movements fast and slow
- Products that are jointly purchased
- Products that could be promoted
Action to take:
- Layouts Store
- What special products, promotions, coupons.
We would like to respond ideally to questions such as
What products are purchased jointly?
Which products could be promoted?
What are the best opportunities for cross-selling?
How is Market Basket Analysis used?
Most purchases are purchased at retail. The analysis of the market basket gives insights into what a customer could have purchased had the idea happened to them. As a first step, market basket analysis can therefore be used to determine where goods are to be placed and promote within a shop. If buyers of barbie dolls buy more sweets, high margin candy can be placed near the doll display of Barbie as observed.
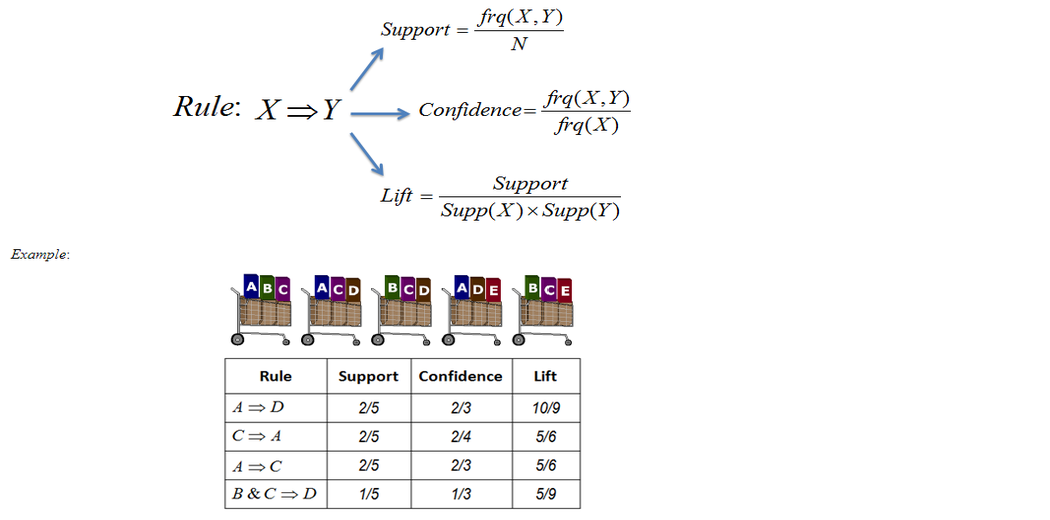
Image 1
A list of product sets with their likelihood is generated by Market Basket Analysis. Companies utilize recommendation engines to accomplish this. These are software components that allow other systems to access recommendation rules. A recommendation engine, for example, could be integrated into an online store to make offers or product placements. In a nutshell, Market Basket Analysis is helpful for predicting what customers will buy based on information you already know.
A list like this can be useful for:
- Determine whether items are attracted to or repellent to one another. As a result, a company may make more educated product placement selections.
- Sort the products into groups based on their likelihood. As a result, you can figure out which correlations are more common than others.
- Determine which products should be placed near one another to boost bundle sales.
- Plan marketing campaigns around products that will help you sell more of them.
- Avoid promoting both items at the same time (Since you know one will drive the sale of the other).
-
Cross-selling and up-selling opportunities should be increased. You can do this since you already know which products are best sellers and which ones stimulate sales of more items.
-
Aids marketing and sales organisations in properly distributing their resources (Channel optimization).
-
Customers should receive internet marketing efforts depending on their shopping habits.
Market Basket Analysis has applications that extend beyond online businesses and retailers. Furthermore, any activity that benefits from identifying patterns or behavior in transactional data. As an example:
- Fraud detection: How likely is it for a US customer to pay a Russian bill with his credit card? Suspicious transactions could be flagged by a company for further investigation.
- Patients at risk of illness: Based on their medical records, you could identify patients who are at high risk of adverse events.
- Web or email filtering: Association rule sets can detect spam emails. For instance, how likely is it that an email containing the word “Viagra” will be Spam? The correlation between these two events can be discovered using association rule learning.
Association Rules in Market Basket Analysis
The similarities between items are many ways to see. These techniques fall within the framework of the general association. Simply said, the end result of this method is a set of rules that can be interpreted as “if that is so.”
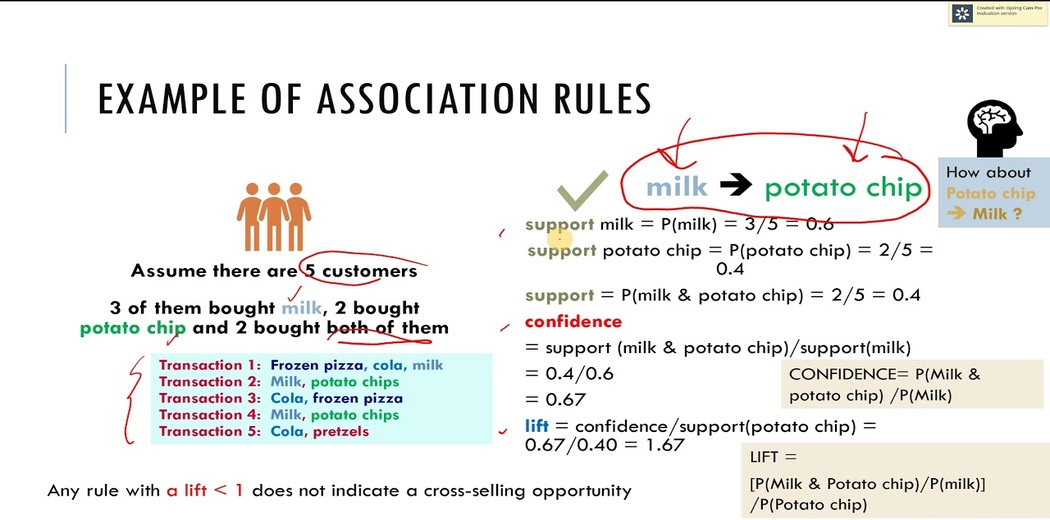
Image 2
From the above image:-
Assume there are 5 customers: 3 of them bought milk, 2 bought potato chips and 2 bought both of them.
| Transactions | Frozen Pizza | Cola | Milk | Potato Chips | Pretzels |
| Transaction 1 | 1 | 1 | 1 | 0 | 0 |
| Transaction 2 | 0 | 0 | 1 | 1 | 0 |
| Transaction 3 | 1 | 1 | 0 | 0 | 0 |
| Transaction 4 | 0 | 1 | 0 | 0 | 1 |
Any Rule with a lift < 1 does not indicate a cross-selling opportunity.
- Support (Milk —> Potato Chips)
Support(Milk) = P(Milk)
= 3/5 = 0.6
Support(Potato Chips) = P(Potato Chips)
= 2/5 = 0.4
Support = P(Milk & Potato Chips)
= 2/5 = 0.4
2. Confidence
Confidence = Support(Milk & Potato Chips)/ Support(Milk)
= 0.4/0.6 = 0.67
3. Lift
Lift = Confidence/ Support(Potato Chips)
= 0.67/0.40 = 1.67
Applications of Market Basket Analysis
So, what are we talking about, what sort of items? Many association applications exist:
- ·Product advice — like “customers of Amazon who bought this, also bought this”
- Music advice — as the artist recommendation of Last FM
This article focuses on the retail application — the data set comes with R and is simple, intuitive, and repeatable.
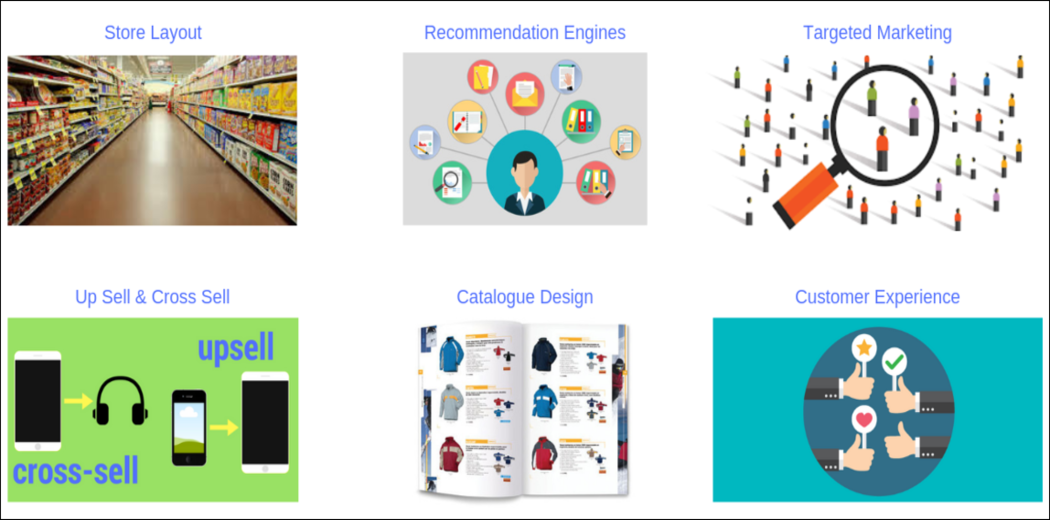
Image 3
The Groceries Dataset
Put on your table, imagine 10,000 receipts. Each receipt is a transaction of purchased items. The receipt represents stuff which was inserted into the basket of a customer — and thus ‘Market Basket Analysis.’
The foodstuffs dataset contains exactly this: a collection of receipts with a receipt of 1 receipt per line and items purchased. Every column in a column represents an item, each line is called a transaction.
The food dataset can be downloaded to view it.
Image 4
A little bit of Math to understand Market basket analysis
The concept of items and item sets has already been discussed. This reads: “When a user purchases a product in the item on the left side, the user probably purchases the product on the right. An instance that can be read more humanly is:
Three important proportions can be understood: support, confidence, and lift. I shall describe in the following bullet points the importance of these
- Support: The portion of our item set in our dataset occurs. Support tells us what percentage of transactions contain the combination of items A and B. It assists in identifying combinations that are frequent enough to be of interest (e.g., purchasing fish alone or purchasing fish and lemons together).
- Confidence: the probability that a rule is correct with items on the left for a new transaction. Confidence tells us what percentage of transactions with item A also have item B. (e.g., how many transactions that have bread also have butter).
- Lift: The ratio that exceeds the expected confidence by the confidence of the rule. The ratio of the number of respondents obtained with the model to the number obtained without the model is known as lift.
- Lift (A => B) = 1 means that within a set of elements there is no correlation.
- Lift (A = > B) > 1 means a positive correlation is more commonly purchased between the products in the product set, i.e. in items A and B.
- Lift(A =>B) <1 means that it is unlikely to be purchased together for the negative correlation of the itemset, i.e. the products in the item set, A, and B.
Association Algorithms based on rules are seen as a two-step approach:
- Generation frequent elements: Find all common item-sets with support >= min support count predetermined
- Generation of Rule: List all Association Rules in frequent item sets. To calculate all the rules, support and trust. Take the rules that fail min support thresholds and min confidence.
Note: if the lift is 1. the items on the right and left are separate.

Image 5
Assume that a transaction that includes Grapes, Apple, and Mango also includes Grapes, Mango. So, according to the Apriori principle, if Grapes, Apple, Mango are common, then Grapes, Mango must also be common.
Here is a dataset with six transactions. Each transaction is made up of 0s and 1s, with 0 representing the absence of an item and 1 representing it’s presence.
| Transaction ID | Grapes | Apple | Mango | Orange |
| 1 | 1 | 1 | 1 | 1 |
| 2 | 1 | 0 | 1 | 1 |
| 3 | 0 | 0 | 1 | 1 |
| 4 | 0 | 1 | 0 | 0 |
| 5 | 1 | 1 | 1 | 1 |
| 6 | 1 | 1 | 0 | 1 |
We will use the following matrices to find interesting rules among the many possible rules in this small business scenario:
1. Support: An item’s default popularity. In mathematical terms, item A’s support is simply the ratio of transactions involving A to the total number of transactions.
Support(Grapes) = (Grape-Related Transactions)/ (Total transaction)
Support(Grapes) = 0.666 Support
2. Confidence: The likelihood that a consumer who purchased both
A and B will return. It divides the number of transactions in which both A and
B are involved by the number of transactions in which B is involved.
Confidence(A => B) = (Transactions involving both A and B)/(Transactions involving only A)
Confidence({Grapes, Apple} => {Mango})
= Support(Grapes, Apple, Mango)/Support(Grapes, Apple)
= 2/6 / 3/6
= 0.667
3. Lift : When you sell B, you increase the sale of A.
As a result, the likelihood of a customer purchasing both A and B together is ‘lift-value’ times greater than the chances of purchasing either separately.
Lift(A => B) = Confidence(A, B) / Support(B)
Lift ({Grapes, Apple} => {Mango}) = 1
Apriori Recommendation for Market basket analysis with R
So, let’s get started by loading up our libraries and data set
# Load the libraries
library(arules)
library(arulesViz)
 library(datasets)
# Load the data set
 data(Groceries)
Lets explore the data before we make any rules:
# Create an item frequency plot for the top 20 items
 itemFrequencyPlot(Groceries,topN=20,type="absolute")
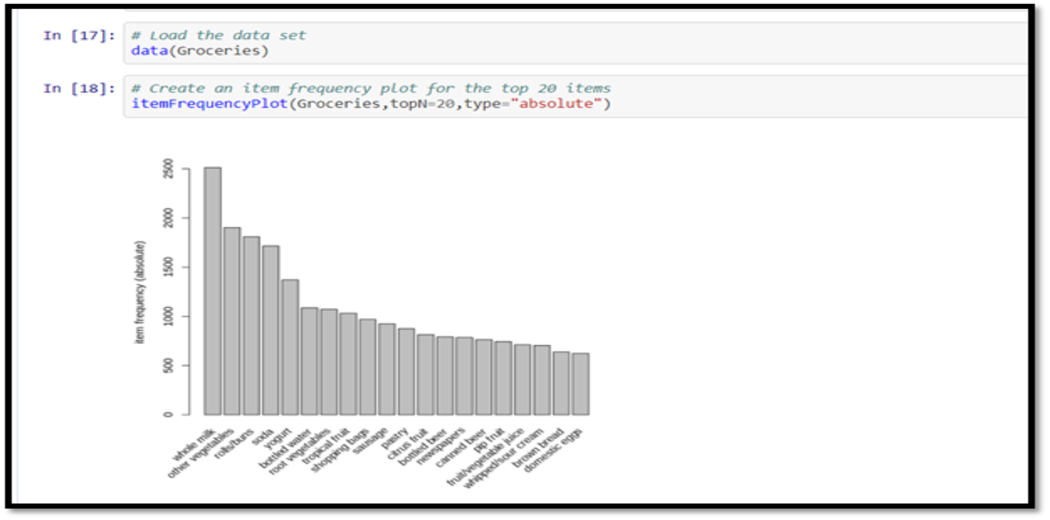
Now some rules are ready for mine! The minimum required support and trust will always have to be given.
The minimum amount of support is 0.001
We have established 0.8 minimum trust
The top five rules are shown.
# Get the rules
 rules <- apriori(Groceries, parameter = list(supp = 0.001, conf = 0.8))
# Show the top 5 rules, but only 2 digits
options(digits=2)
inspect(rules[1:5])
The output we see should look something like this:
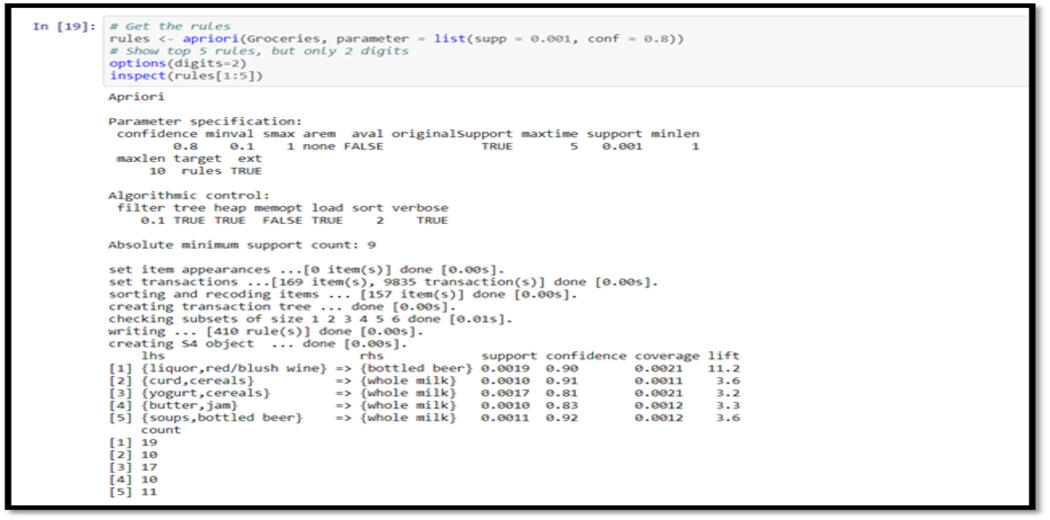
For example, this reads easily: 81 per cent of the buyer is likely to buy whole milk if someone purchases yoghurt and cereals. We can get summary information regarding the rules that provide us with some interesting information, like:
· The number of rules produced: 410
· Length allocation of the rules: The most common rules are 4 long items
· Quality measures summary: The rates of support, lift and trust are interesting to see.
· Total data and minimum parameters are extracted from the data mines.
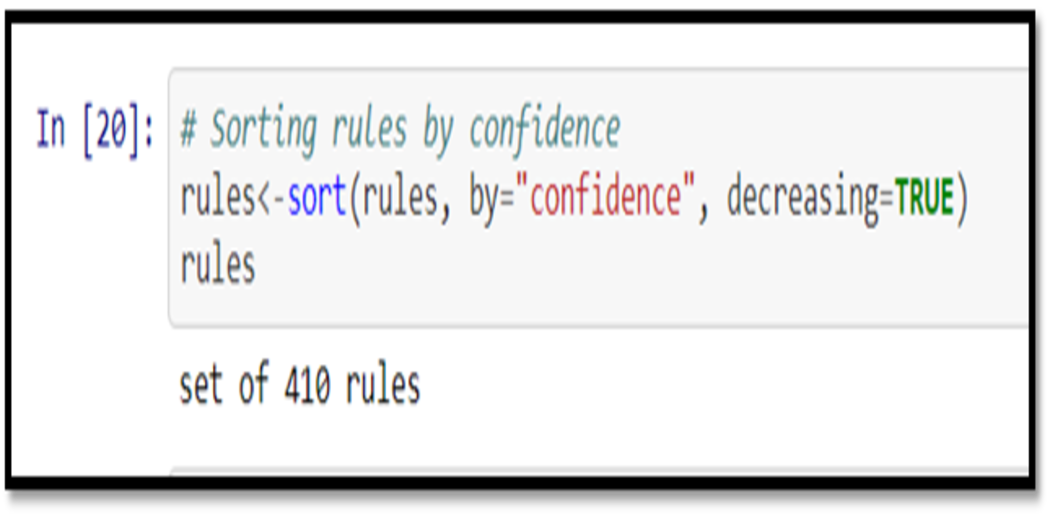
Sorting stuff out
The first problem is that the rules are not sorted. We often want first the most important rules. We wanted the most likely rules, let’s say. By executing the following code, we can easily sort by trust.
rules<-sort(rules, by="confidence", decreasing=TRUE)
Our top five outputs are now sorted by trust and thus the most relevant rules appear.
Rule 4 might be too long. You want more precise rules, let’s say. This can also be done easily by adding a ‘maxlen’ parameter to your apriori function:
rules <- apriori(Groceries, parameter = list(supp = 0.001, conf = 0.8,maxlen=3))
Redundancies
Rules will be repeated sometimes. Redundancy means one item could be specified. You have the option of removing the item from the dataset. Otherwise, redundant rules generated can be removed. These repeated rules can be deleted using the following code snippet:
subset.matrix <- is.subset(rules, rules)
 subset.matrix[lower.tri(subset.matrix, diag=T)] <- NA
 redundant = 1
 rules.pruned <- rules[!redundant]
 rules<-rules.pruned
Targeting Items
Now that we know how to generate rules, limit the output, we want to go for rules. We could be interested in two types of targets, illustrated in an example of “all milk”:
What are customers who can buy whole milk before buying?
1) If customers buy whole milk, what are they likely to buy?
2) In essence, we want the left side and the right side of the hand. It’s not hard to do with R!
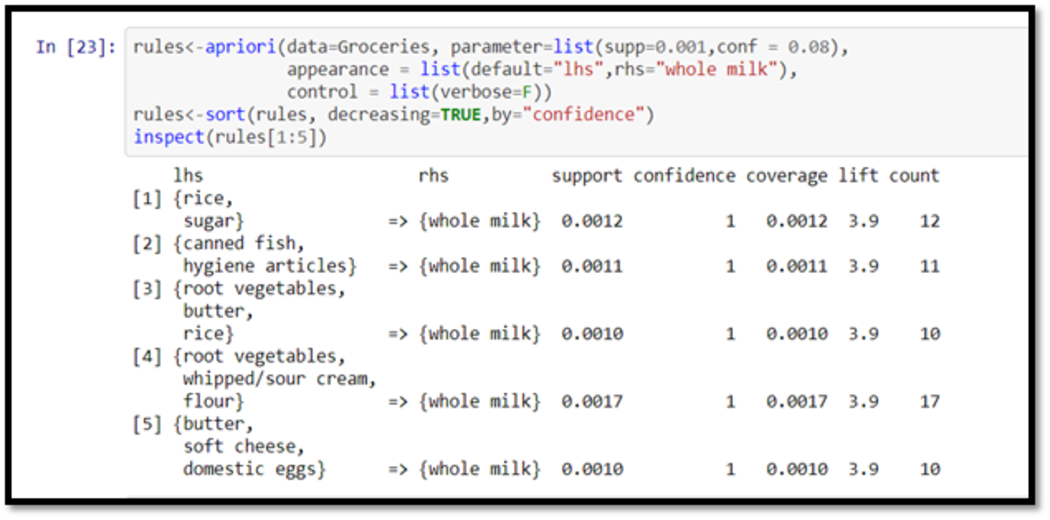
Response: We modify our apriori() function as follows on the first question:
rules<-apriori(data=Groceries, parameter=list(supp=0.001,conf = 0.08),
 appearance = list(default="lhs",rhs="whole milk"),
 control = list(verbose=F))
 rules<-sort(rules, decreasing=TRUE,by="confidence")
 inspect(rules[1:5])
The output will look like this:
We can also make the left side “full milk” and find its background. Please note that:
· We have set the trust to 0.15 because we do not have 0.8 rules.
· To avoid leaky left-hand items, we set a minimum length of 2
rules<-apriori(data=Groceries, parameter=list(supp=0.001,conf = 0.15,minlen=2),
 appearance = list(default="rhs",lhs="whole milk"),
 control = list(verbose=F))
 rules<-sort(rules, decreasing=TRUE,by="confidence")
 inspect(rules[1:5])
Now our output looks like this:
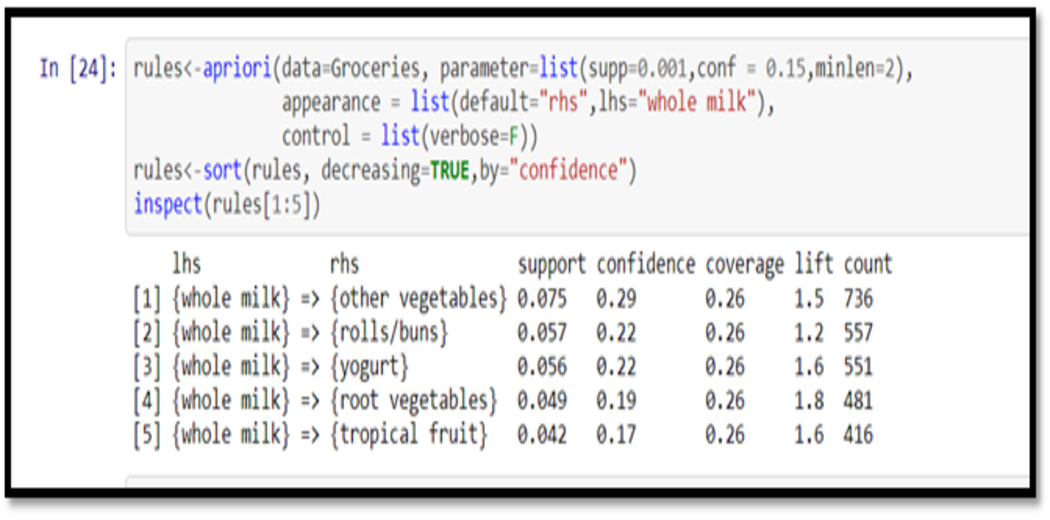
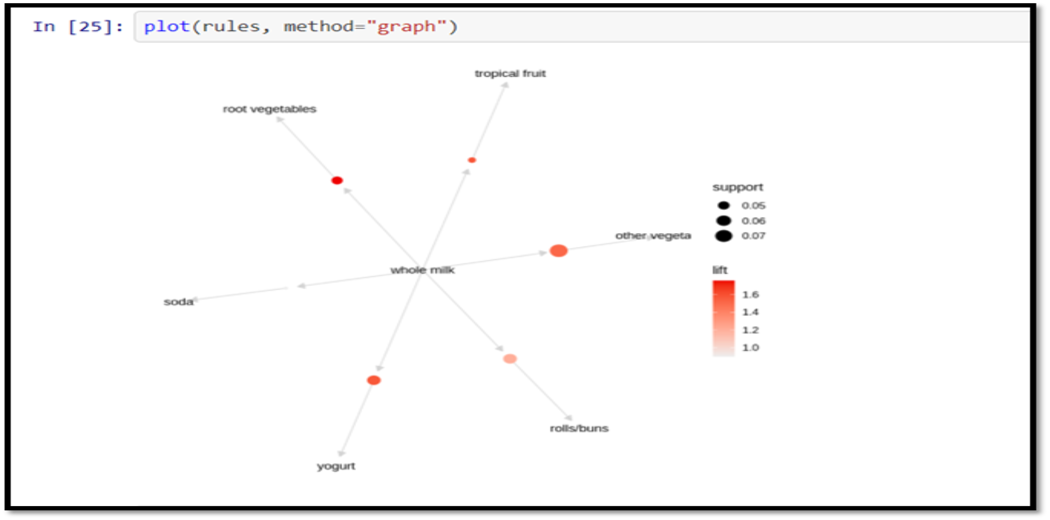
Visualization
Visualization is the final step. Let’s say that you wanted a graph to map the rules. This can be done with another “arulesViz” library.
plot(rules, method="graph")
Code:
Here you can browse for
the code!
End Notes:
Thank you for following with me all the way to the end. By the end of this article, we should have a good understanding of Market Basket Analysis and its implementation in R.
I hope you found this article useful. Please feel free to distribute it to your peers.
Author
Hello, I’m Gunjan Agarwal from Gurugram, and I earned a Master’s Degree in Data Science from Amity University in Gurgaon. I enthusiastically participate in Data Science hackathons, blogathons, and workshops.
I’d like to connect with you on Linkedin. Mail me here for any queries.
Image Source:
- Image 1: https://miro.medium.com/max/1067/1*–iUPe_DtzKdongjqZ2lOg.png
- Image 2: https://i.ytimg.com/vi/qMQfUy8ndco/maxresdefault.jpg
- Image 3: https://blog.rsquaredacademy.com/img/mba_why.png
- Image 4: https://1.bp.blogspot.com/-Fq-pkFIk3jE/X84mMTZx6lI/AAAAAAAADA0/YLdCl-Qfq4wjP3tDsAWKFgVV1Q3hwUxAQCLcBGAsYHQ/s1300/market-basket-analysis.jpg
- Image 5: https://wiki.smu.edu.sg/1718t3isss608/img_auth.php/thumb/b/b3/Lift_Confidence_Support.png/600px-Lift_Confidence_Support.png


