This article was published as a part of the Data Science Blogathon.
Introduction
Customers are the most important driver of growth and the foundation of every business. More customers translate into higher revenues and better profitability in the long run. But in recent times, and due to heavy competition customer loyalty to a brand has declined and keeps on deteriorating. How can businesses decide on customer loyalty? CLV is one measure to do so. It shows the value added by customers and helps businesses make important spending decisions. Growing CLV can directly grow customer loyalty.
Customer lifetime value means different things to different businesses, and different teams use CLV in various contexts. If you want to understand more about CLV, its use cases, and its implementation in different scenarios, then you are at the right spot.
Questions that CLV can Answer
- Lifetime – How long will the customer buy from us?
- Transactions – How many times will the customer buy from us?
- Spend – What’s the spending of the customer in one year?
Customers can be of Two Types
- New customers – Recently acquired customers with only one transaction or acquired customers in the last 1, 3, or 6 months.
- Old and retained customers – Existing customers or entrenched customers.
Business Actions-Based on CLV
- Decide cost of acquisition.
- Decide on marketing spend and which customers to spend those limited resources on.
- Plan customer journey, such that more customers move from lower spending to higher spending.
- Measure ROI (return on investment) of different business exercises.
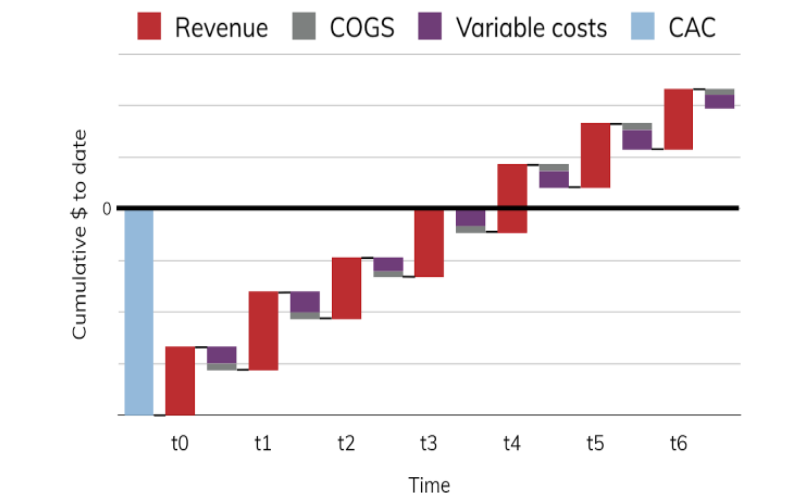
The below waterfall chart shows that unless a user transacts more than four times, he is not profitable. Only after the fourth transaction, the business can profit from the user. CLV aims to optimise this customer journey and provide long term value to the business. Another observation is CAC(customer acquisition cost) is very high compared to the sum of all variable costs, in simple terms, customer retention is a lot cheaper than customer acquisition. COGS(cost of goods sold ).
Basics Of Customer Lifetime Value
Impact of Customer Lifetime Value on business
- CLV directly impacts revenue, spending marketing budget only on relevant customers and reducing wasteful usage of scarce budget.
- Increases retention and loyalty, as optimized CLV provides a framework to target and retain good customers, thus reducing costs and providing better services and products to existing customers.
- Lowers customer acquisition cost.
- Customers with higher future value receive higher benefits thus increasing retention.
Companies Effective Using CLV
- Acknowledging the importance of CLV, Paytm provides subscriptions helping businesses retain customers by ensuring timely automated merchant payments.
- Kantar consulting provides a CLV framework to marketers to help them understand what drives customer loyalty.
- Pega solutions offer personalised recommendations, tailored offers, location-based messaging services and a host of other services using the CLV framework.
- Ad spends optimization by Google’s smart bidding algorithms.
- E-commerce uses CLV to streamline its retention efforts.
Caution Before Implementing
- Cautious about inherent bias – For example, a cohort of 18-22 might have lower spending power as compared to the 30+ cohort but 18-22 are probably the best customer cohort in the next 2 years and needs to be nurtured. CLV models would generally predict a lower value for the 18-22 cohort thus jeopardising future profitability. CLV models ignore some basic demographic parameters of a user.
-
Negative CLV users might turn positive and vice versa, hence CLVs are point in time, static metrics and cannot be extrapolated over time.
-
It does not apply a discount rate to future customer revenue and costs, resulting in customer lifetime value being overstated to the firm.
-
It assumes that the retention rate (loyalty rate) is stable and does not change over time – again making it inappropriate for firms pursuing increased loyalty marketing goals.
Different Types of Business Models that can Implement CLV
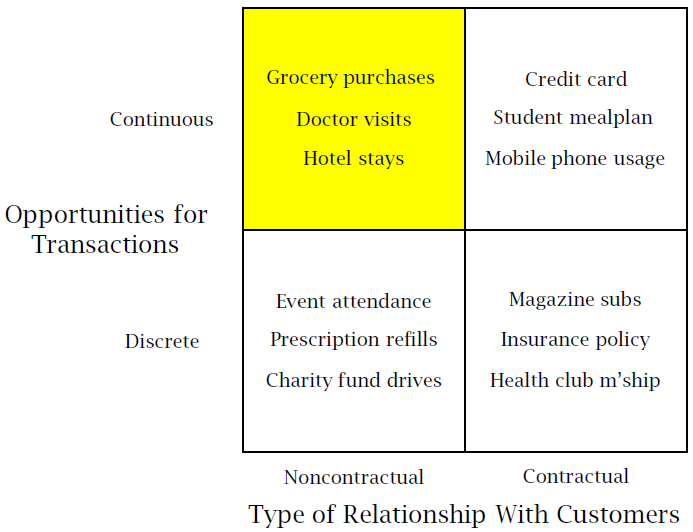
Non – Contractual (Always a share):
- Non-observable defection.
- No standard way to know if a customer has churned.
- Focus on churn probability model, and migration models.
Contractual (Lost for good):
- Observable defection or churn.
- Easy to define retention/churn and build models to predict the same
- Focus on survival models.
CLV in a freemium setting:
Youtube works in a freemium setting, users can freely avail of its services but for additional services, there is a subscription cost. Only a small subset of users pay for subscriptions and based on their payments, the rest of the users get free services. So CLV helps identify users with high values, and those who have a higher probability of conversion. One month’s trial service is another lever used by freemium providers to gauge customer value. In Youtube’s case, 50M subscribers help fund 2.9 Billion users as of September 2021.
Modelling Approaches :
- Continuous and Non-contractual
- Use lifetimes package from python
- Continuous and contractual
- Markov models
- Discrete and Non-contractual
- Use lifetimes package from python
- betageometric/beta-Bernoulli (BG/BB) model
- Pareto/NBD model
- Discrete and contractual
-
Geometric-beta model
-
Modelling Techniques
- RFM models – Very commonly used across industries based on recency, frequency and monetary value.
- Probabilistic models – Pareto/NBD models which describe the observed behaviour.
- Econometric models – Customer acquisition, retention, and expansion models are built to arrive at CLV of a customer.
- Persistence models – Vector-autoregressive (VAR) models.
- Machine learning models – Projection-pursuit models; neural network models; decision tree models; spline-based models such as generalized additive models (GAM), multivariate adaptive regression splines (MARS), classification and regression trees (CART); and support vector machines (SVM).
Important Metrics
Metrics help companies to gauge customer health, and provide day to day actionable insights. A few important metrics which help make better sense of CLV are noted below, the list is not exhaustive.
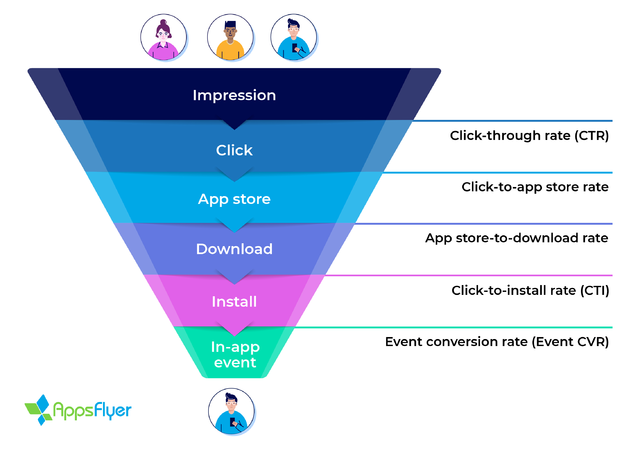
Conversion Rate
In Amazon’s context, of all people who visit the website, how many places an order. In Zerodha’s context, it can be of all people who visit the app, how many places are in order either on BSE/NSE or MCX.
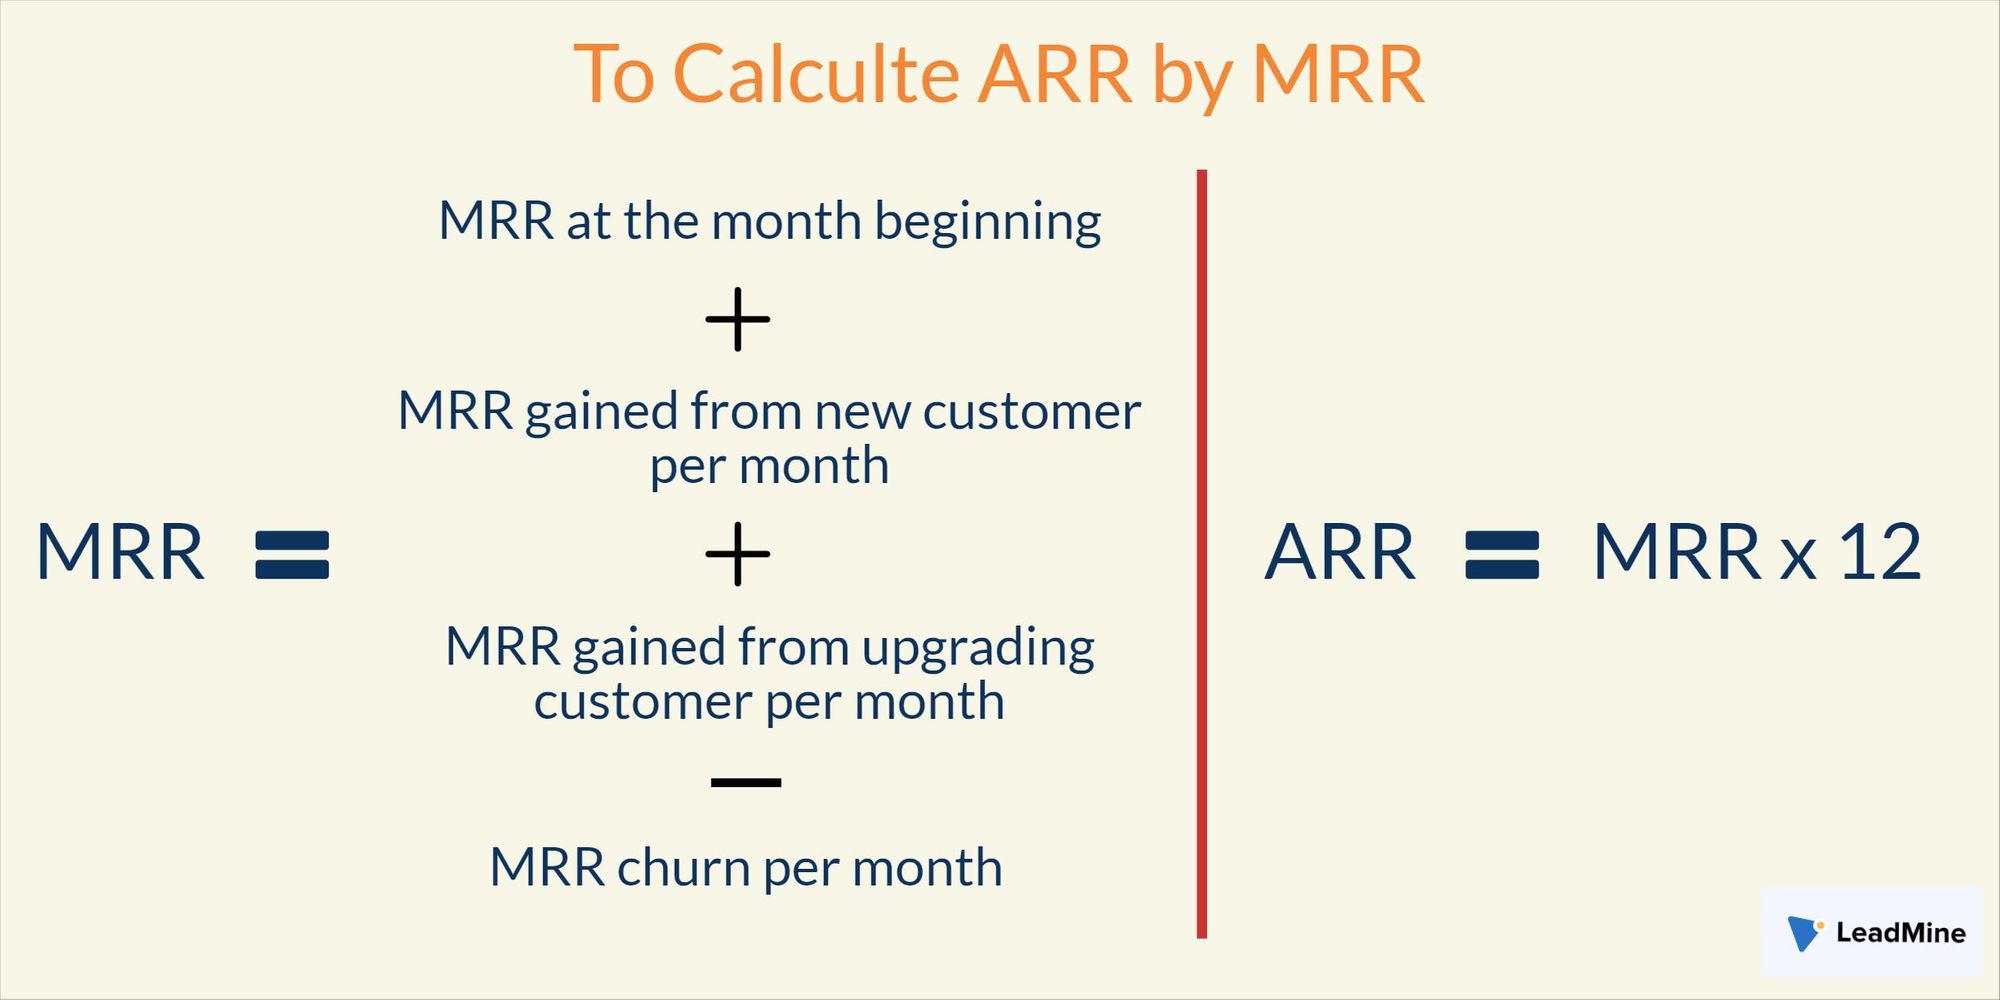
Monthly Recurring Revenue
Predictable revenue generated by the business across all active customers per month.
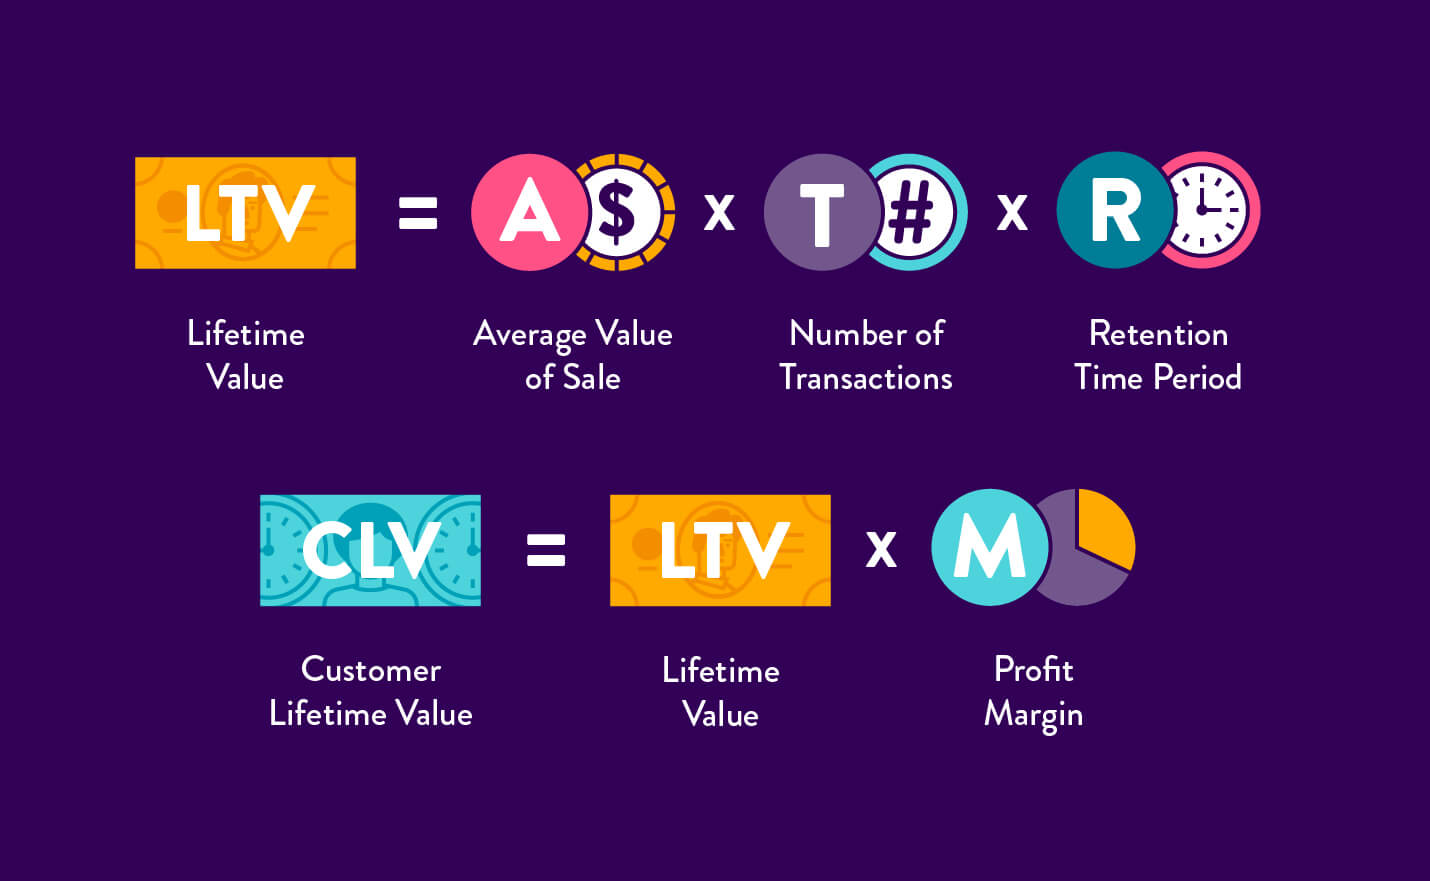
CLV
Average revenue regranted by customers over their entire relationship with the company.
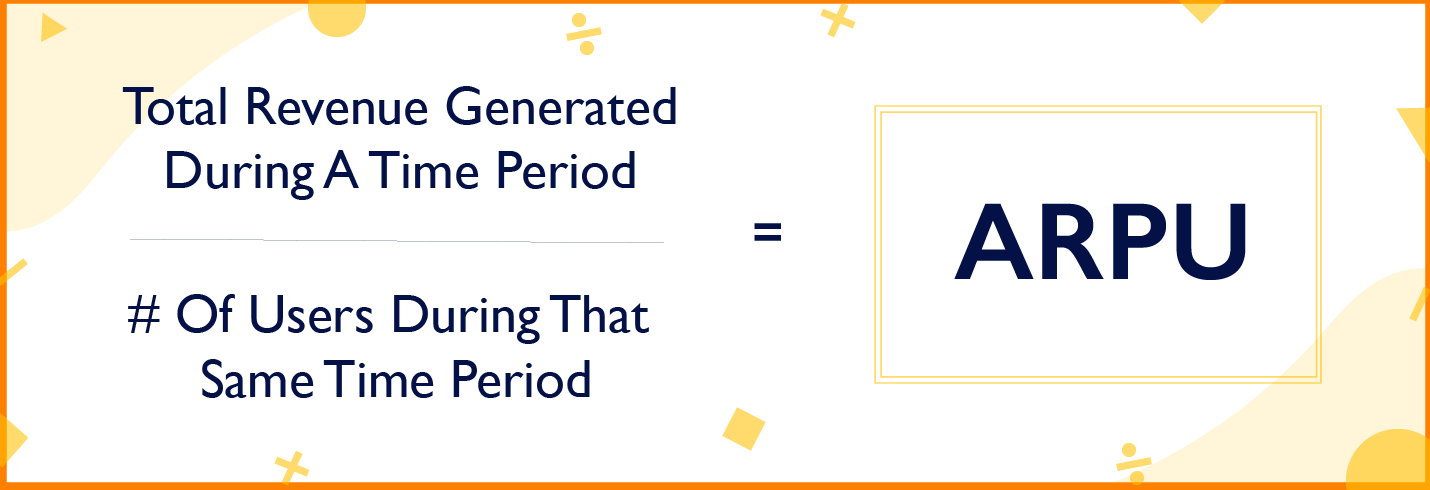
Average Revenue per customer
The average revenue per user measures the amount of money that a company can expect to generate from an individual customer.
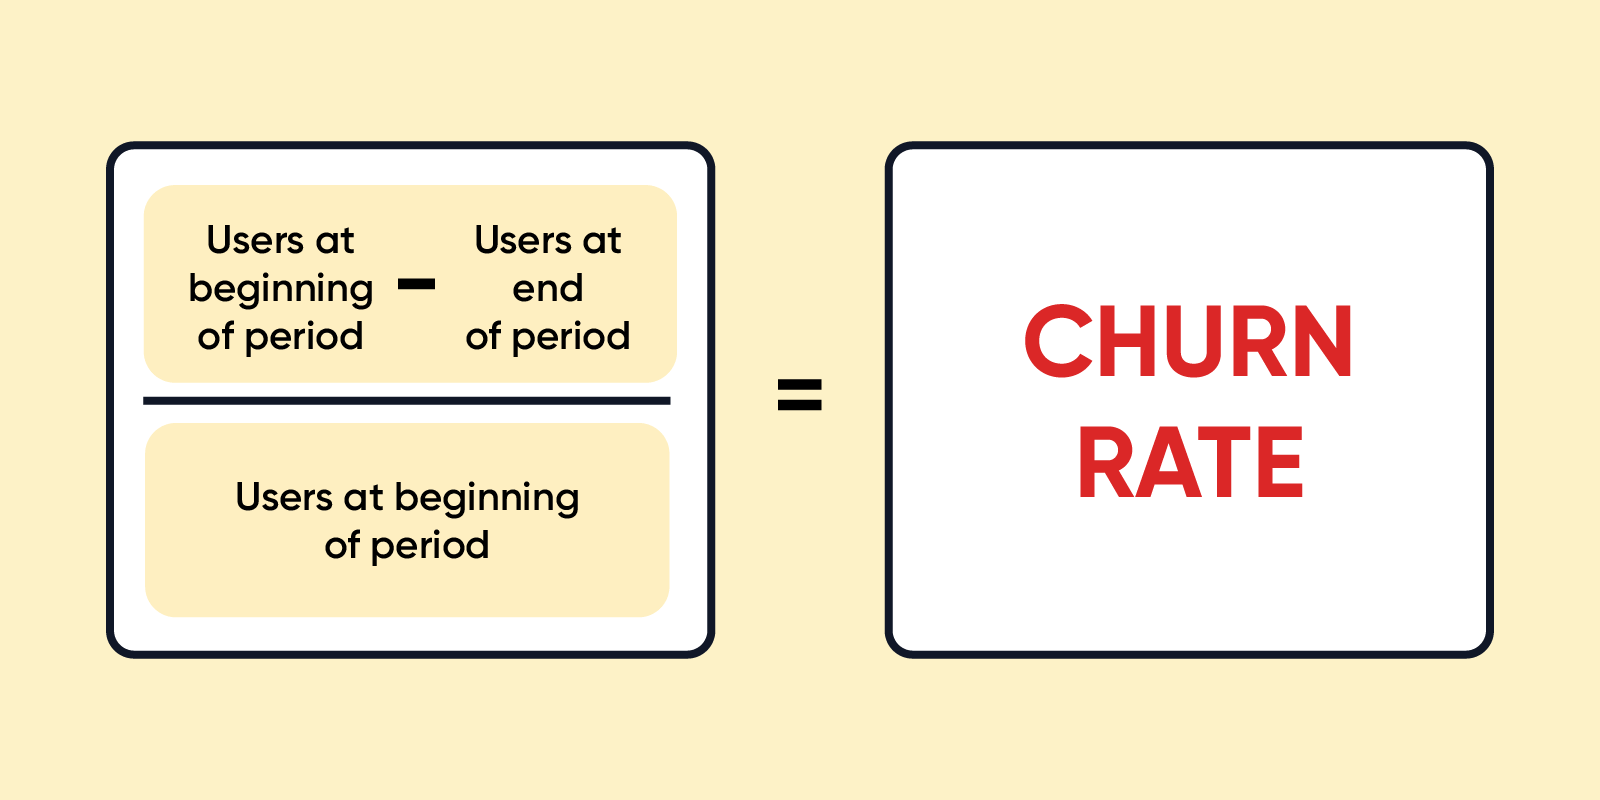
Churn Rate
The rate at which customers stop doing business with a company over a given period.
Rentention rate = 1 – Churn rate.
In a contractual setting, measuring churn is easier and its interpretation also is straightforward. In a non-contractual setting, retention rate can be used as the definition of churn can vary from firm to firm, but retention rate is more of a standard measure.
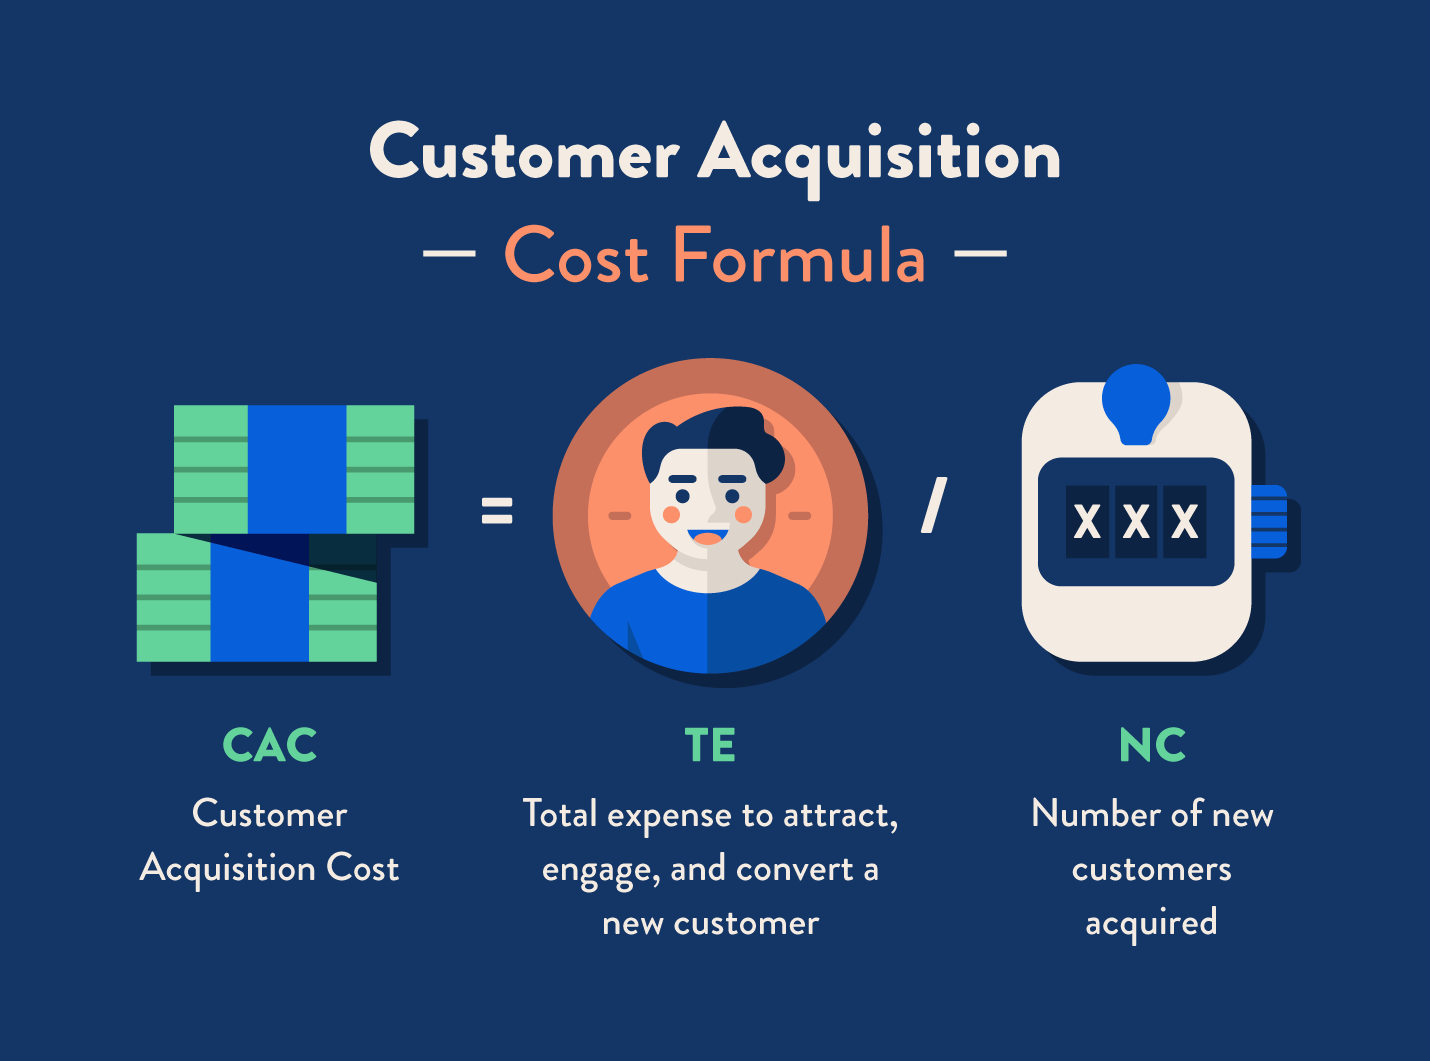
Customer Acquisition Cost
The average spending made by a company to acquire a customer.
Problem Statement
Datasets to explore CLV:
- Brazilian E-Commerce Public Dataset by Olist
- UCI Online Retail Data Set
- CDNOW dataset
-
Google Analytics Customer Revenue Prediction
Brazilian E-Commerce Public Dataset by Olist has been used in this guide to predict CLV.
Import Packages
%matplotlib inline
import numpy as np
import pandas as pd
import matplotlib.pyplot as plt
import seaborn as sns
import lifetimes
#Let's make this notebook reproducible
np.random.seed(42)
import random
random.seed(42)
import warnings
warnings.filterwarnings('ignore')
Read Data
df1 = pd.read_csv('../input/olist_orders_dataset.csv')
df2 = pd.read_csv('../input/olist_customers_dataset.csv')
df3 = pd.read_csv('../input/olist_order_payments_dataset.csv')
cols = ['customer_id', 'order_id', 'order_purchase_timestamp']
orders = df1[cols]
orders = orders.set_index('customer_id')
orders.drop_duplicates(inplace=True)
# too few
cols = ['order_id', 'payment_value']
payment = df3[cols]
payment = payment.set_index('order_id')
payment.drop_duplicates(inplace=True)
cols = ['customer_id', 'customer_unique_id']
customers = df2[cols]
customers = customers.set_index('customer_id')
elog = pd.concat([orders,customers], axis=1, join='inner')
elog.reset_index(inplace=True)
cols = ['customer_unique_id', 'order_purchase_timestamp']
elog = elog[cols]
elog['order_purchase_timestamp'] = pd.to_datetime(elog['order_purchase_timestamp'])
elog['order_date'] = elog.order_purchase_timestamp.dt.date
elog['order_date'] = pd.to_datetime(elog['order_date'])
cols = ['customer_unique_id', 'order_date']
elog = elog[cols]
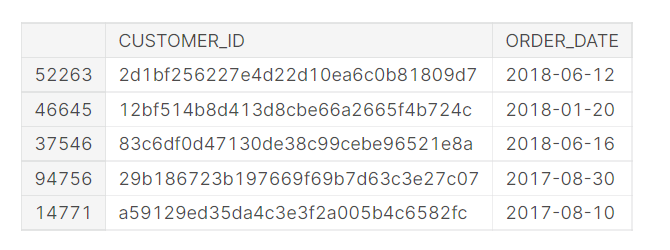
elog.columns = ['CUSTOMER_ID', 'ORDER_DATE']
elog.info()
display(elog.sample(5))
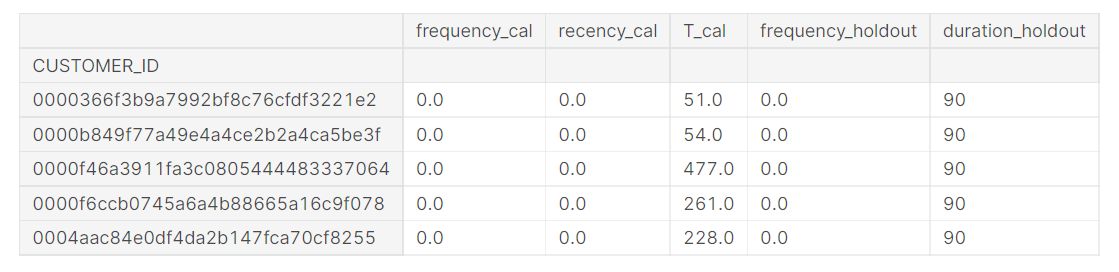
Creating RFM Matrix Based on the Transaction Log
calibration_period_ends = '2018-06-30'
from lifetimes.utils import calibration_and_holdout_data
summary_cal_holdout = calibration_and_holdout_data(elog,
                                                   customer_id_col = 'CUSTOMER_ID',
                                                   datetime_col = 'ORDER_DATE',
                                                   freq = 'D', #days
                                        calibration_period_end=calibration_period_ends,
                                        observation_period_end='2018-09-28' )
summary_cal_holdout.head()
Training Modell- MBG/NBD
from lifetimes import ModifiedBetaGeoFitter
mbgnbd = ModifiedBetaGeoFitter(penalizer_coef=0.01)
mbgnbd.fit(summary_cal_holdout['frequency_cal'],
        summary_cal_holdout['recency_cal'],
        summary_cal_holdout['T_cal'],
       verbose=True)
print(mbgnbd)
Predictions for each customer
t = 90 # days to predict in the future
summary_cal_holdout['predicted_purchases'] = mbgnbd.conditional_expected_number_of_purchases_up_to_time(t,
                                                                                      summary_cal_holdout['frequency_cal'],
                                                                                      summary_cal_holdout['recency_cal'],
                                                                                      summary_cal_holdout['T_cal'])
summary_cal_holdout['p_alive'] = mbgnbd.conditional_probability_alive(summary_cal_holdout['frequency_cal'],
                                                                         summary_cal_holdout['recency_cal'],
                                                                         summary_cal_holdout['T_cal'])
summary_cal_holdout['p_alive'] = np.round(summary_cal_holdout['p_alive'] / summary_cal_holdout['p_alive'].max(), 2)
display(summary_cal_holdout.sample(2).T)
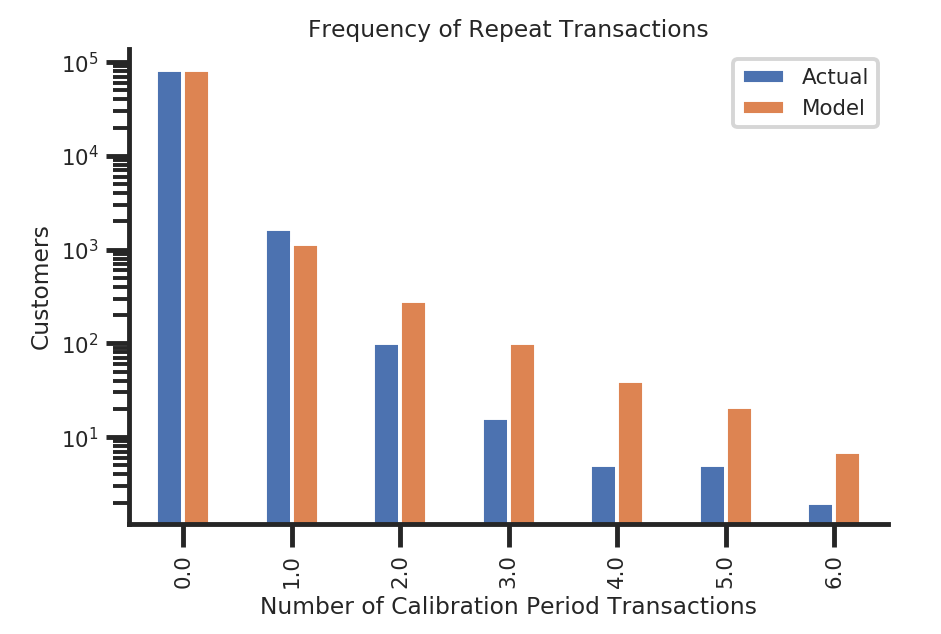
Model Evaluation
- Compare purchase frequencies between test and holdout set.
- Compare the average number of purchases between the test and holdout set.
from lifetimes.plotting import plot_period_transactions
ax = plot_period_transactions(mbgnbd, max_frequency=7)
ax.set_yscale('log')
sns.despine();
from lifetimes.plotting import plot_calibration_purchases_vs_holdout_purchases
plot_calibration_purchases_vs_holdout_purchases(mbgnbd, summary_cal_holdout)
sns.despine();
from lifetimes.plotting import plot_incremental_transactions
plot_incremental_transactions(mbgnbd, elog, 'date', 'CUSTOMER_ID', t, t_cal, freq='D')
sns.despine()
Cohort Analysis
Cohorts can be customers who exhibit similar traits over a period of time or customers acquired in a particular period. There isn’t a clear industry-wide definition, Segments and cohorts are sometimes used interchangeably. Cohorts have a time variable associated with it and segments do not, and this is how it’s widely used.
CLV across cohorts can vary drastically, for December cohort CLV can be higher compared to the March cohort. Or December to May cohort can have higher CLV than June to November. Identifying valuable cohorts and ensuring higher retention across those cohorts becomes essential in the long run.
Recommendation and Actionability
All models be they well researched and developed or vanilla models, all serve some business purpose that drives revenue. Online stores use these models to recommend products on the homepage. Some might say that’s what a recommendation system is for and they would be right, but the crux of any business is to drive revenue and that’s where CLTV comes into play. Example: Consider two users, users A and B, A has high CLV and B has lower CLV, and both of them are browsing for baby products in the kids’ category. A and B should ideally be recommended the same content, but due to their difference in CLV, A will be shown contents that drive long term value, for example instead of a stroller, which is a one time buy, A could be shown baby cereal(Rs300 per pack) and diaper(Rs1000 per pack). On the other hand, B will be shown a stroller(which costs about 3K to 5K) as it’s known that B has a low CLV and the chances of him returning to the platform are lower. Here’s the unit economics – User A for 2 years would have spent at least 20K whereas User B would have made a one-time purchase of 5K. An ideal recommendation model would use CLV intelligence to get the best value out of a user.
Facebook, for example, wouldn’t show content that’s best for the user, if that was the case a 15-year-old should always receive Khan Academy videos and academic-related content, it shows content that makes the user stick to the platform, which intern helps bring higher revenue, which profits facebook. This is true across all platforms and apps. Be it shopping, social media, payments, financial services, food delivery etc.
CLV isn’t just a model, nor it’s just a number, it’s the valuation of a business, in real terms decreasing CLV trends for more than 4 quarters for some could be the beginning of a job search, and for others opportunity to identify pain points and solve them, figure out areas of growth and work towards it.

Conclusion on Customer Lifetime Value
The actionability of CLV models can be broadly divided into customer loyalty and customer retention. A few other actionable items are listed below:
- Priority customer service to high CLV users. (Many subscription-based product companies boast of this feature, Swiggy and Zomato do it. Flipkart had Flipkart Plus).
- Rewards and gratification: Almost all apps reward users for transactions, some apps even ask users to share their rewards on social media. This helps build trust in low CLV users.
- Loyalty programs: Indian Oil, Shell, and HP have all had their loyalty programs or have a third party like Payback support their loyalty programs. This helps increase the CLV of a customer.
- Upsell and cross-sell initiatives: Swiggy, Zomato, and Paytm all have their co-branded credit cards, these cross-sell initiatives show customer loyalty to the platform. Online newspaper subscription for 6 months is Rs 700, 12 months is Rs 1000 and 24 months is 1500, such tiering helps bring more subscribers for longer periods. Below is an example of The Hindu cross-sell, up-sell initiatives.
- Pricing is one of the most important levers that can impact CLV directly.
Good luck! Here’s my Linkedin profile if you want to connect with me or want to help improve the article. Feel free to ping me on Topmate/Mentro; you can drop me a message with your query. I’ll be happy to be connected. Check out my other articles on data science and analytics here.
The media shown in this article is not owned by Analytics Vidhya and is used at the Author’s discretion.
Data scientist. Extensively using data mining, data processing algorithms, visualization, statistics, and predictive modeling to solve challenging business problems and generate insights. My responsibilities as a Data Scientist include but are not limited to developing analytical models, data cleaning, explorations, feature engineering, feature selection, modeling, building prototype, documentation of an algorithm, and insights for projects such as pricing analytics for a craft retailer, promotion analytics for a fortune 500 wholesale club, inventory management/demand forecasting for a jewelry retailer and collaborating with on-site teams to deliver highly accurate results on time.


