An Exploratory Data Analysis Guide for Beginners
This article was published as a part of the Data Science Blogathon.
Introduction on Exploratory Data Analysis
When we start with data science we all want to dive in and apply some cool sounding algorithms like Naive Bayes, XGBoost directly to our data and expects to get some magical results. But we tend to forget that before applying those algorithms, we should understand our data first. This is where EXPLORATORY DATA ANALYSIS comes in. It involves various steps such as-
- Data Cleaning (remove irrelevant data , handling missing values, handling outliers, etc.),
- Data Standardization ( converting data into more structured format),
- Finally data analysis (Uni-variate, Bi-variate and Multi-variate).
Exploratory Data Analysis not only helps us to understand our data, but ultimately it helps to make our predictions better.
Topics Covered-
- Data Cleaning ( handle missing values, checking outliers, standardize the values)
- Use of Lambda function, apply
- Plotting multiple plots with the help of for loop(through Pandas, Matplotlib and Seaborn)
- Data Analysis (Uni, Bi and Multivariate)
The screenshots are taken from my Kaggle notebooks-
How to Read Data?
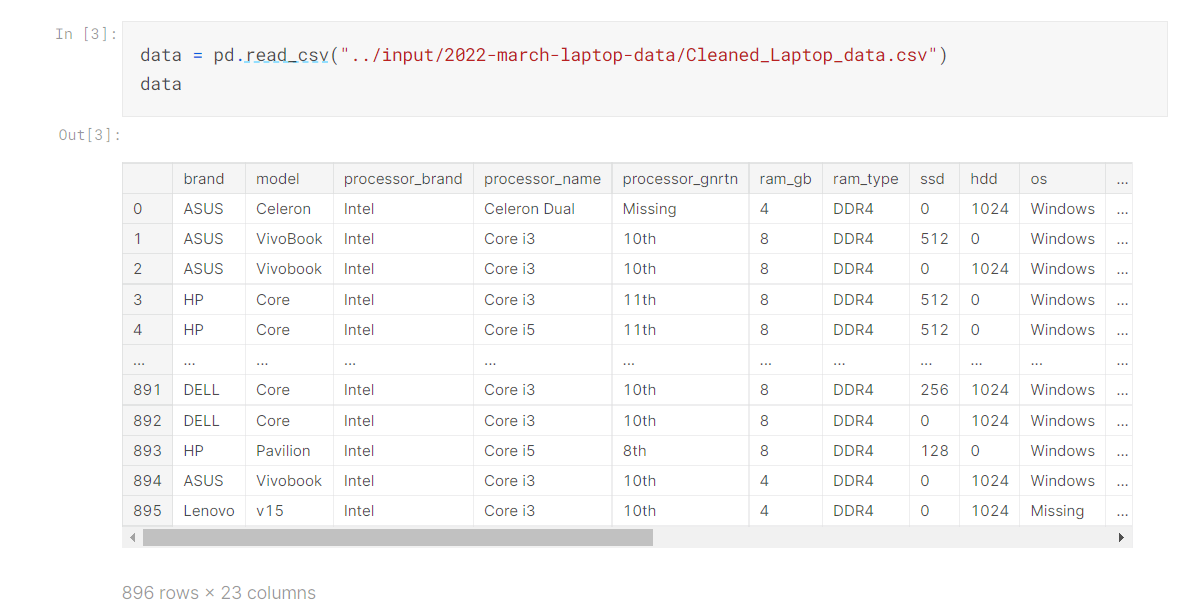
- As we can see there are 896 Rows and 23 Columns
- We can also see rows and columns of our data through data.shape()
Check Our Data, Type of Features, etc.
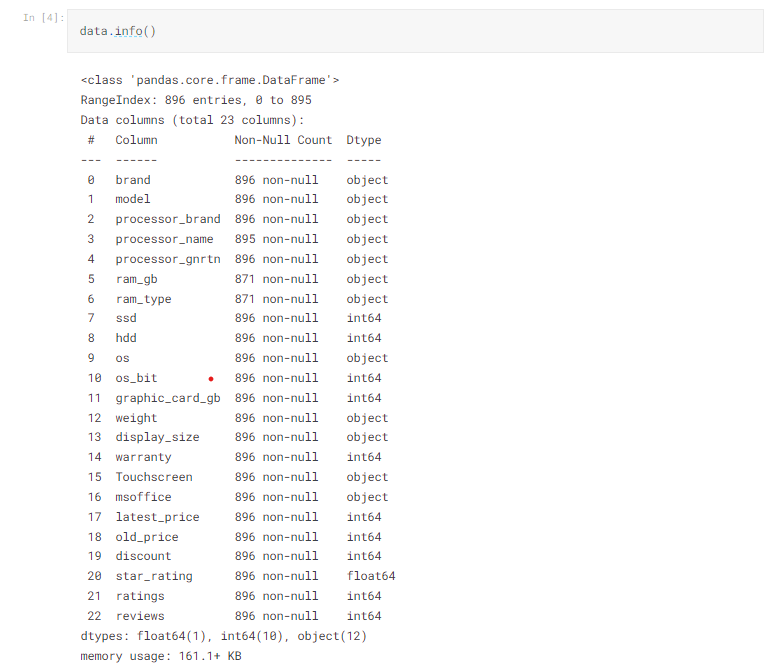
- We have used .info() in order to get to know about data type of columns and to check null values.
- To get to know more about each column we may use data[‘column_name’].describe().
Handling Null Values
- Handling Null values is always the tricky part
- We tend to follow the traditional way – to impute the nan values with mean but-
- We should observe whether by imputing nan values with mean will help us or will it complicate the data for this first of all we should-
- See number of nan values in target , its always better to remove nan values from target feature than imputing with any number because it may deviate the results,
- If nan values are very high, there is no benefit of imputing with anything, so either we can drop the column or if it is relevant feature, we can keep it as it is,
- Other thing is if there are outliers in our data ,we can always impute values with median as it is not affected by outliers else by mean,
- If the column is categorical, we can impute values with mode.
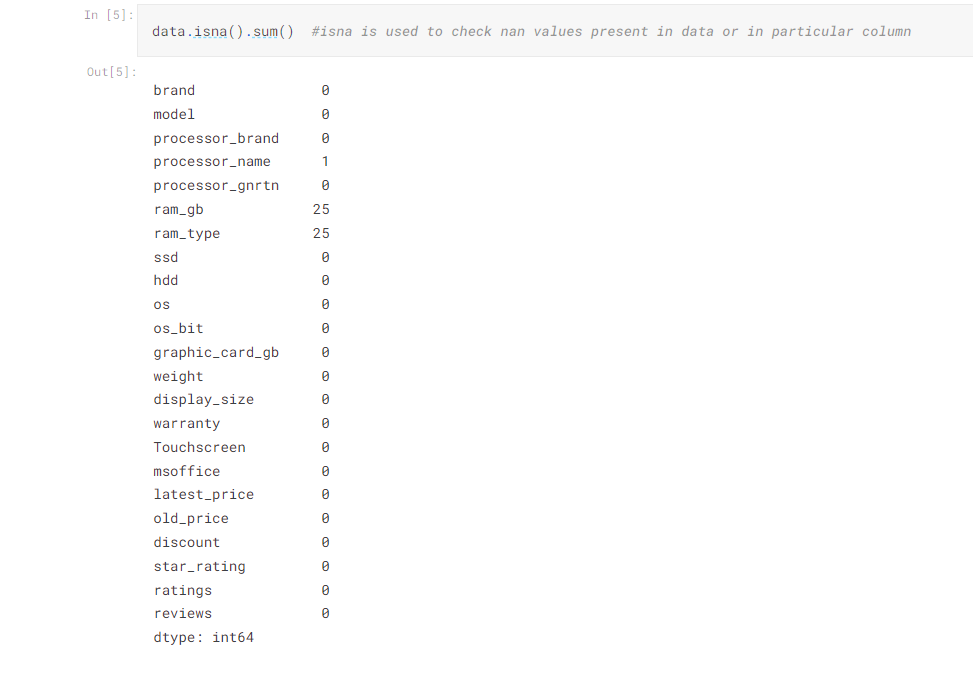
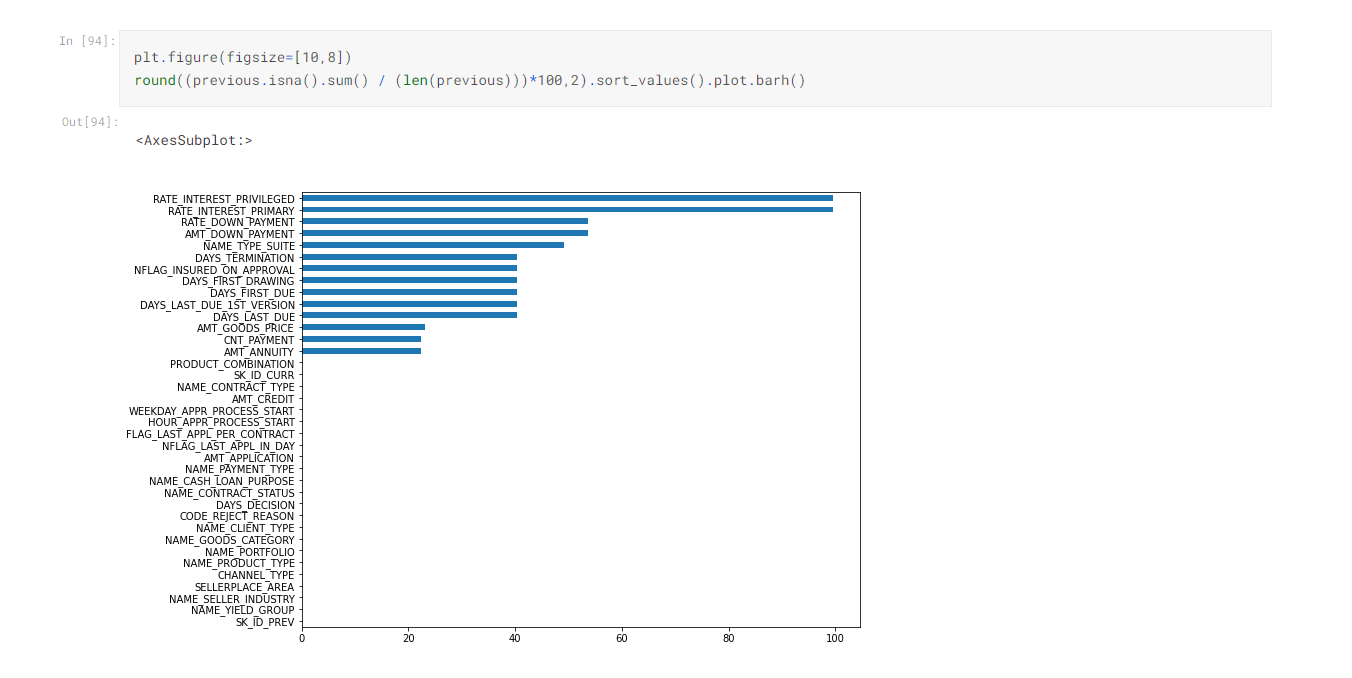
- One of the first step is to check null values.
- For this we have data.isna() method, we can see there are some null values present in data.
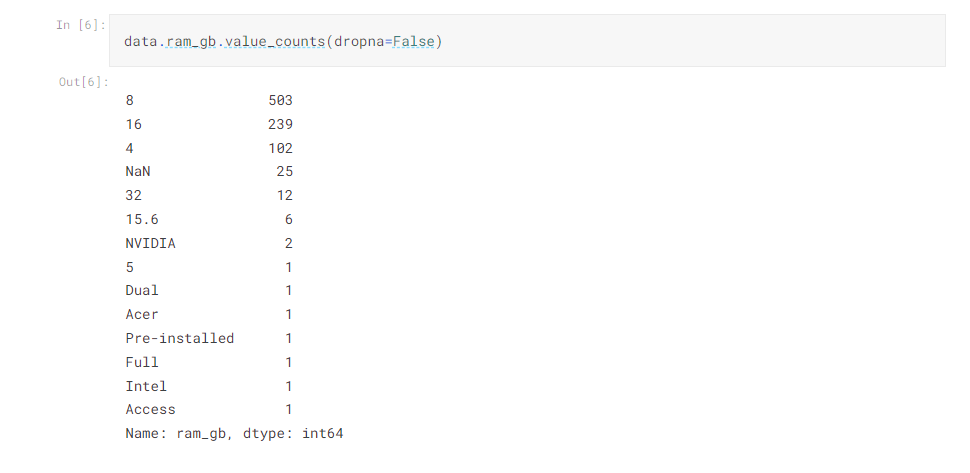
- .value_counts() comes handy to count number of values in one column including nan values.
Lambda Function

- Lambda function can be useful if we have to create new column on the basis of existing column or we have to transform existing column
- Other alternate of lambda function is assign()
- In order to get to know our data we can start with-
- Checking outliers(by using describe(), plotting boxplots etc.),
- Check if any type of standardization to be used
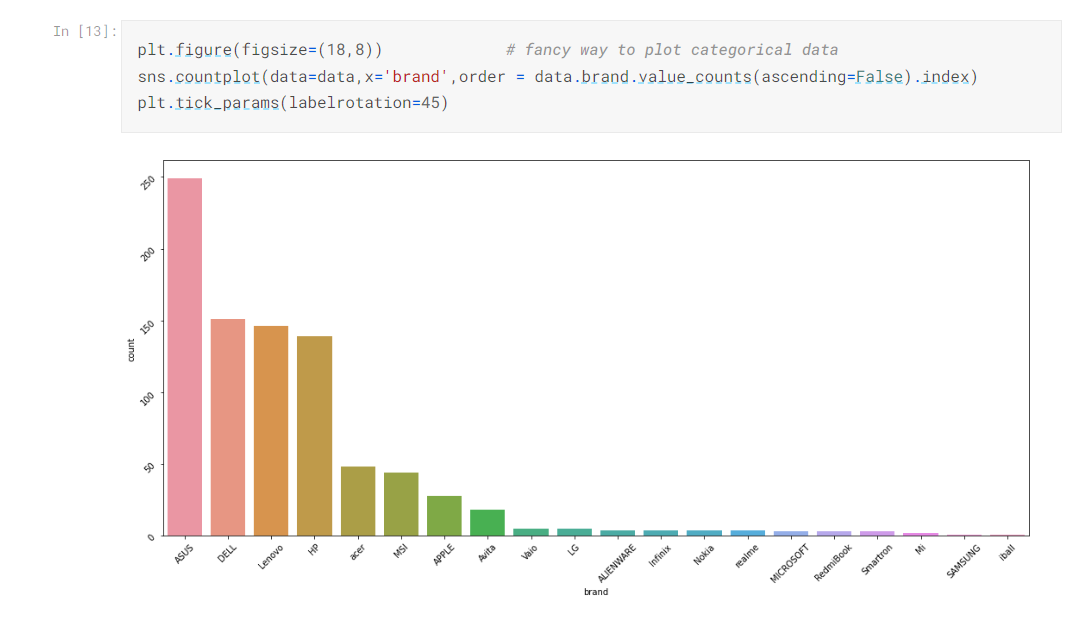
- Best way to get to know the data is to visualize it, for categorical data we may use countplot, bar chart, for continuous variables we may use boxplots(used to check outliers), line chart(majorly used in time series data) and many more
Steps in Data Analysis
- UNIVARIATE ANALYSIS (analyzing one column at a time)
- BIVARIATE ANALYSIS (two columns at a time, for continuous variables we can use scatter plot, for categorical variables we can use countplot and many more)
- MULTI-VARIATE ANALYSIS (combination of columns, use groupby, pivot table, heatmap etc.
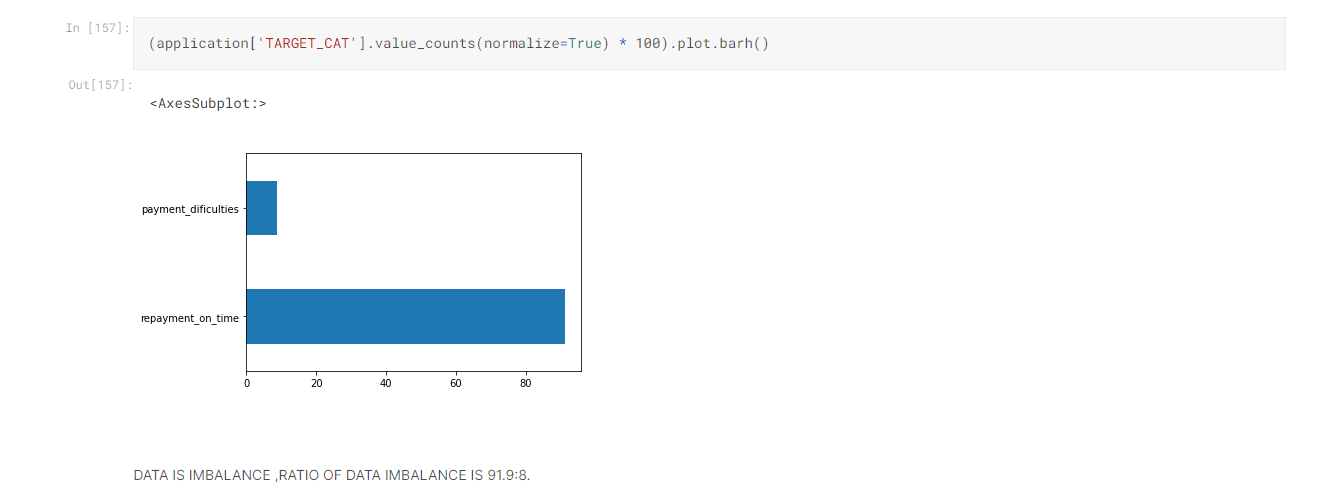
One important think that most of us tend to disregard is to check to if our target feature is balanced or not, we check it inoif data is biased or not –
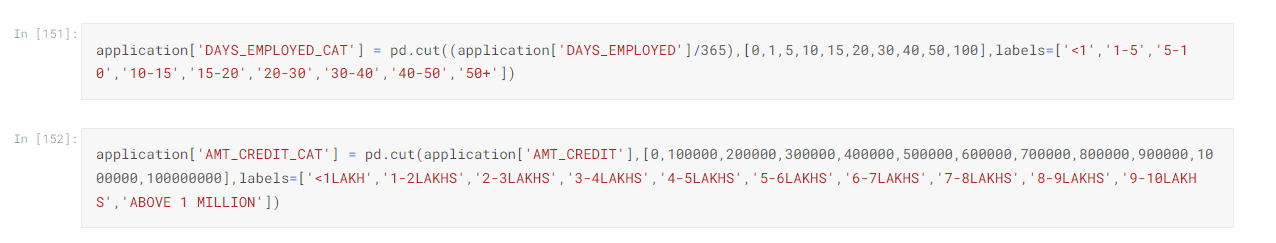
 It is always a good idea to divide our numerical data into categories for better understanding ( we can to it by pd.cut )-
Univariate Analysis
Seaborn Gives us More Interactive Visualization
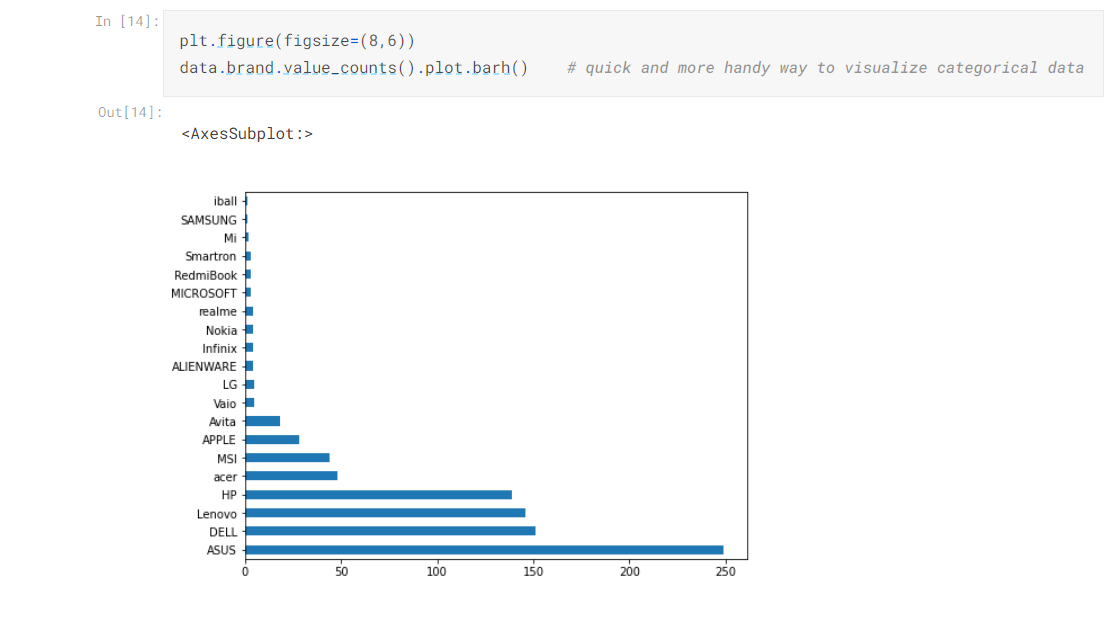
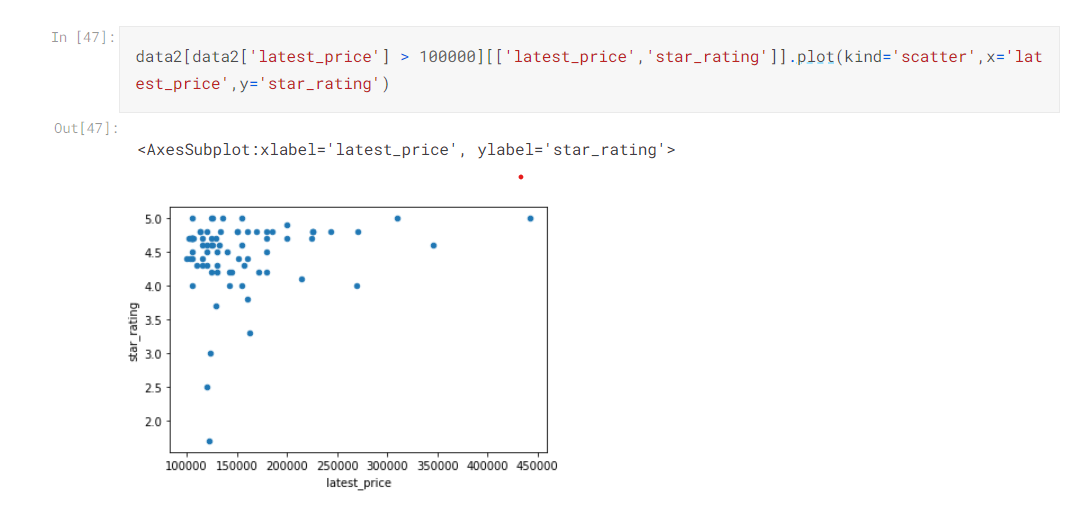
Pandas Plots are More Handy and Quick
Plotting Multiple Plots
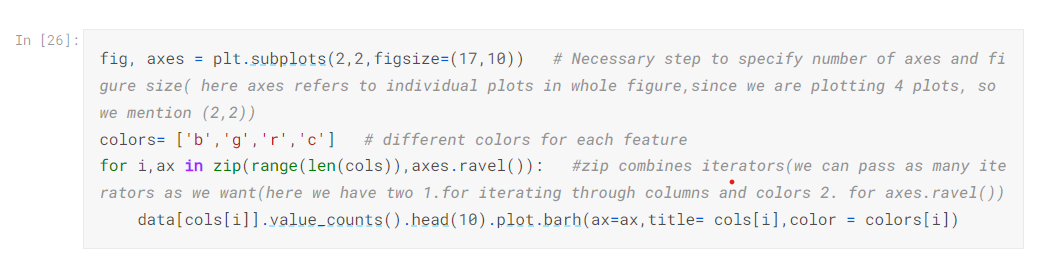
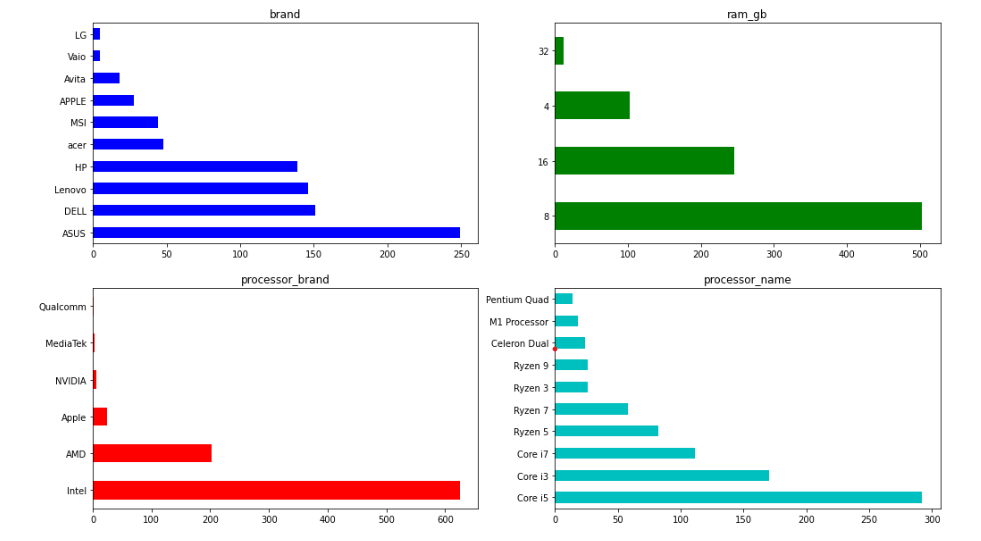
- As we can see subplots helps us to plot multiple plots
- We can mention colors also
- In for loop, we pass axes.ravel().
Plot Boxplot to Check Variation in Data
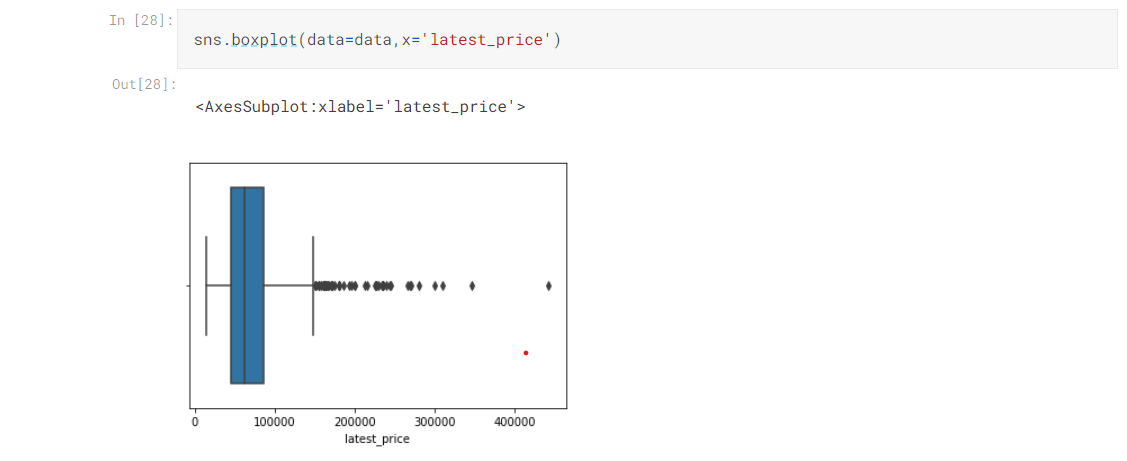
If there are any outliers present in our data we may limit our data to whatever percentile we want for ex 80 percentile.
Bivariate and Multivariate Analysis
- For Bivariate analysis, we can use scatter plot,
- Scatter plot helps us to find out correlation(linear relationship) between two continuous variables.
- Sometimes we can also use Boxplot for one categorical and one continuous variable.
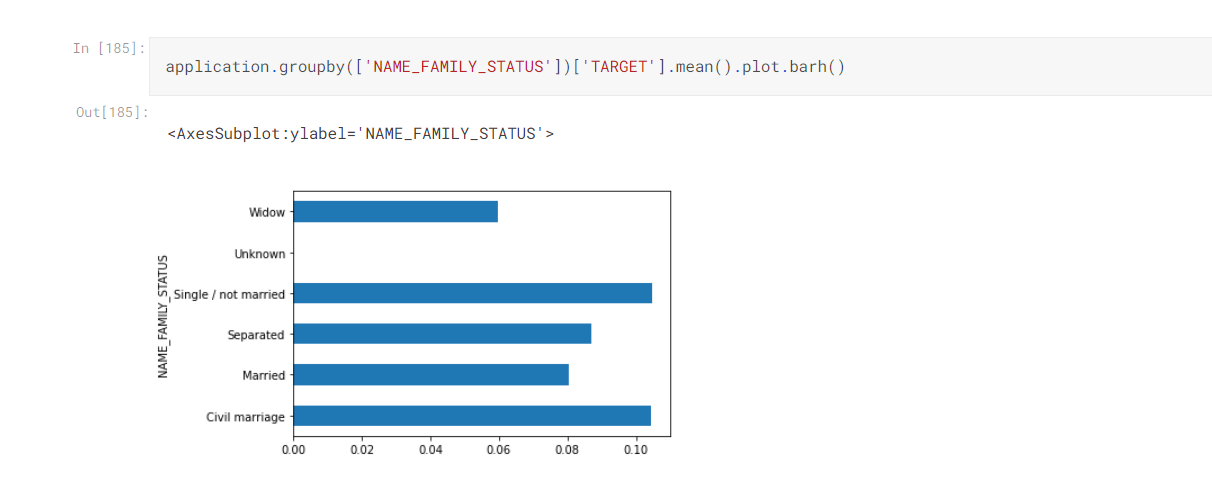
- For bivariate and multi-variate analysis groupby and pivot table comes handy
- In groupby we can aggregate data according to one or more categorical variables and also mention numerical columns on which aggregate function will work.
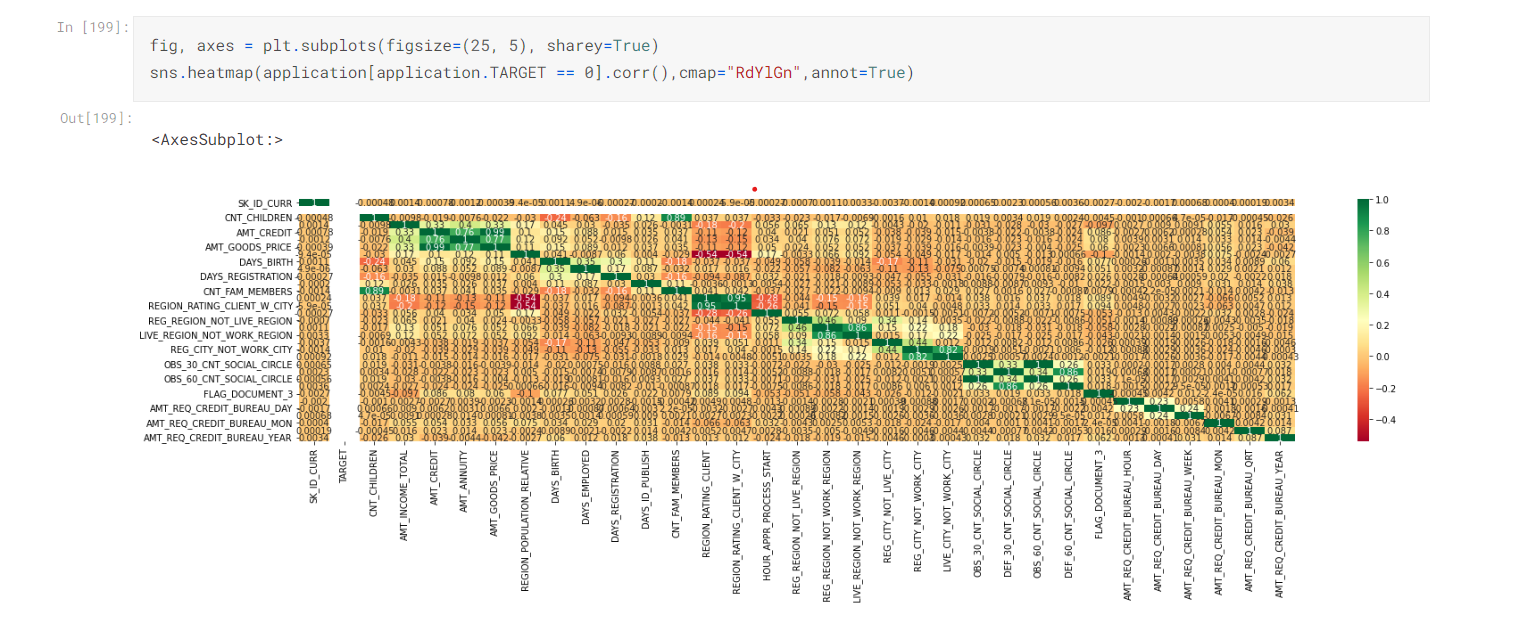
Pivot Table are Best Option to do Multi-variate Analysis in Which we can Summarize our Data

We can also use Heatmap for Multi-variate Analysis to find Correlation between the Variables
Conclusion
While doing EDA ON RISK ANALYTICS FOR BEGINNERS Kaggle notebook you will find out that-
- There are approx. 40% of columns that contains nan values. Some of the columns contains more than 80 % Nan values so I had to drop them.
- Some of the columns contains outliers so I had to limit the data.
- Some are not in correct format so I had to transform them.
- Finally in data analysis, I have found relations between different columns which would help me in deciding which algorithm is best suited for my data.
Finally, we have understood the importance of data cleaning , handling outliers, doing data analysis. There are no fixed steps in EDA as they depends on type of data set, but I’ve tried to include majority of them.
The media shown in this article is not owned by Analytics Vidhya and is used at the Author’s discretion.


