An End-to-end Guide on Anomaly Detection with PyCaret
This article was published as a part of the Data Science Blogathon.
Introduction
Have you ever wondered how a person or a bank is notified of the wrongful transaction of his credit card, like how did system can notify that particular person or the bank about the transaction, which will help save his money by blocking that particular card immediately? This process is called Anomaly Detection (Outliers). Here, the credit card example comes under the fraud detection problem.

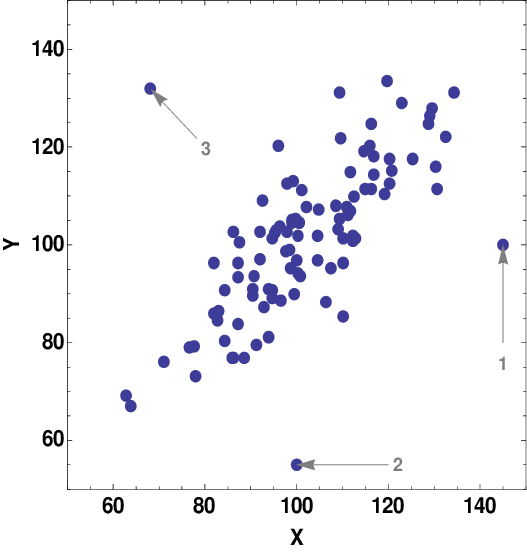
Outliers are the Data Points which lie outside the overall distribution of the dataset; outliers will have a huge impact on the results of any kind of analytics, from the basic analysis to model building. A few models are sensitive to outliers like Linear Regression etc. Even if we are trying to draw some insights from the data, removing the outliers before the analysis will make the result statistically significant.
What is Anomaly Detection?
Anomaly detection is a process which helps to find the Outliers in a dataset here; the process assumes that data will be in a certain range based on the data we have; if any data point is far away from that particular range, that will be considered as the Outlier it is one of the primary steps of Data Cleaning.
In today’s world, lots of data is generated, and monitoring the data is a crucial task where anomaly detection will help us to find any occurrence of the error; monitoring the error explains to us the origin of the error and helps us to inform the error so that the necessary action will be taken.
Anomaly Detection is commonly used for:
- Data Cleaning
- Fraud Detection
- Detection based on sensors
- intrusion detection
- health monitoring systems
Anomaly Detection Techniques
There are quite a few techniques to detect the outlier. Let’s discuss one of my favourite techniques called THE FIVE NUMBER SUMMARY.
The five-number summary is a descriptive statistic with the help of five values; we can describe the data here. The five-number summary deals with the interquartile range (IQR), which helps to find the outliers in the dataset.
- Minimum value: we can find the minimum value using the lower fence formula, which is Q1-1.5(IQR)
- Q1: Q1 denotes the first quartile, which consists of 25% of the data from the overall data distribution
- Median
- Q3: Q3 denotes the Third quartile, which comprises 75% of data from the overall data distribution.
- Maximum value: we can find the maximum value using the higher fence formula, which is Q3+1.5(IQR)
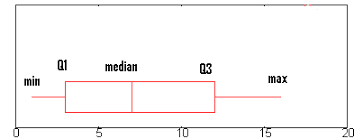
Source: Statistics How to
Another popular technique for anomaly detection is the Isolation forest, an unsupervised anomaly detection technique which is similar to the Random forest, which is constructed based on multiple decision trees; the isolation forest works with the principle that the anomalies are the observations which are different from the data points we have, it follows the approach of processing the samples and randomly selected features to find the outliers in the data.
The approach of the isolation forest algorithm is to Isolate the outliers from the data with the help of decision trees, Data Attributes are selected randomly to construct the decision trees, and the shortest path of the decision trees is considered as outliers which are easy to isolate from the data this process continues until all the data points are processed. At the end isolation level of each data, the point is noted, and then it generates the anomaly score, which defines whether the particular data point is an outlier or not, if the anomaly score is close to 1, it is likely to be an outlier, and if an anomaly score is less than 0.5 then that data point is not an anomaly.
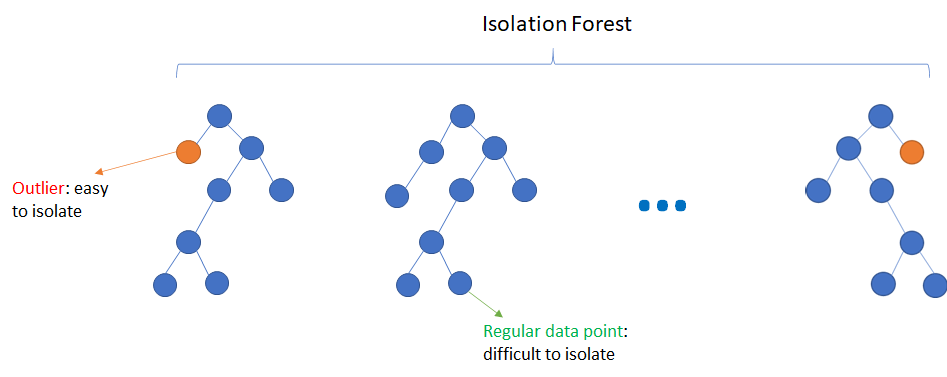
Source: Machine Learning Geek
PyCaret
PyCaret is the open source learning library in python, which helps us to implement various machine learning tasks more quickly.

PyCaret is very useful. Its low code python library helps us to implement various tasks with few lines of code. Here rather than focusing much on coding our focus will be on experiments.
It is easy to understand and implement almost every task related to the machine learning projects like handing missing values, encoding, feature scaling or hyperparameter tuning.
Implementation of PyCaret
pip install pycaret
from pycaret.datasets import get_data

from pycaret.anomaly import *

anomaly = get_data('anomaly')

exp_name = setup(data = anomaly)
The setup function is one of the basic functions in pycaret, which is responsible for the data preprocessing tasks like handling missing values, encoding, performing the Train -Test – Split, and all other necessary data preprocessing steps; after initializing the setup function, it shows us the data types of all the features then it processes to the environment which will have the information we need to perform data science project tasks.
.png)
iforest=create_model('iforest')

plot_model(iforest)
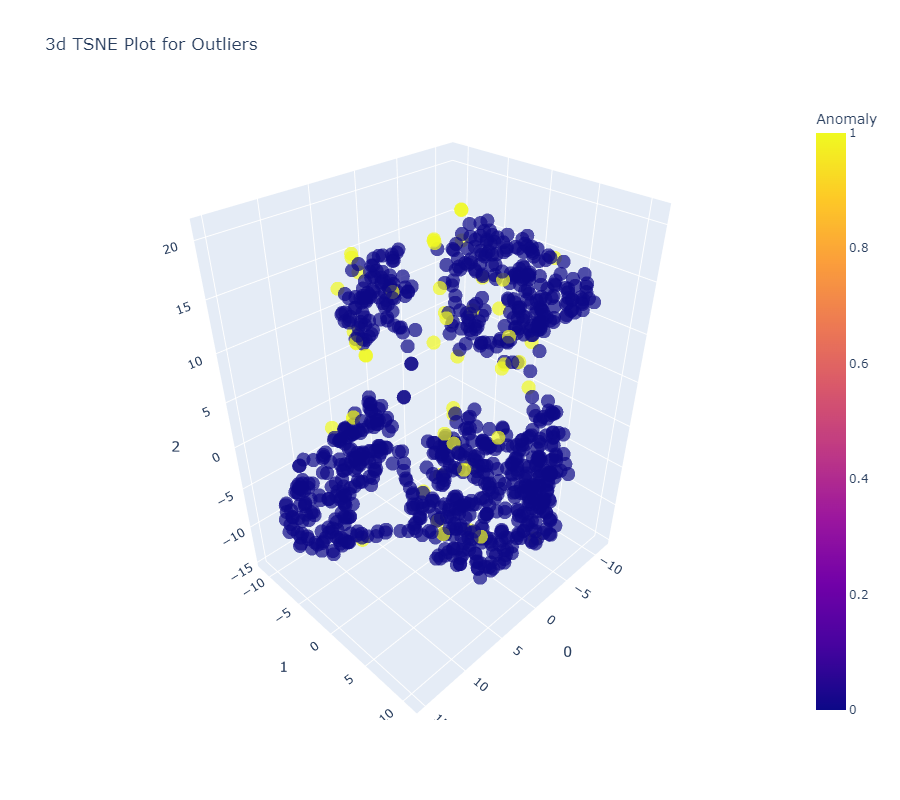
.png)
By plotting the model, we will get the interactive 3d plot, which helps us understand every data point’s information clearly.
Iforest_predictions = predict_model(iforest, data = anomaly)
Iforest_predictions
Here in the output, we can observe the anomaly detection values and the anomaly scores of the entire data
.png)
anomaly=Iforest_predictions[Iforest_predictions['Anomaly']==1]
anomaly
.png)
From the output, we have filtered the anomaly from the entire data along with their anomaly score so that we can drop them, or we can also filter them based on the 0 anomaly value, which denotes that the data point is not outliers, which helps us to give a better result in any kind of analytics and also used to perform basic analysis or to build a model.
save_model(iforest, 'IForest_Model')
.png)
The final step is to save the save_model function allows us to save the entire transformation pipeline for later use shortly, using the Load_model function, we can use the saved model to predict the unseen data.
Conclusion
Anomaly detection is a wide concept; here in this guide, we have discussed a few concepts of anomaly detection and its implementation using Pycaret:
- We have understood the concept of outliers and their use cases.
- We have learnt two techniques to detect outliers. One is the five-number summary basic method using statistics. Another one is the model-based approach, Isolation forest.
- We have understood the benefits of using Pycaret, which mainly helps us to focus more on experimentation.
I hope you got a good understanding of anomaly detection with pycaret, share this guide with your network, and kindly let me know if there are any queries or feedback. Connect with me on LinkedIn.
The media shown in this article is not owned by Analytics Vidhya and is used at the Author’s discretion.


