QlikView for Data Engineers Explained with Architecture
This article was published as a part of the Data Science Blogathon.
Introduction
QlikView is a popular enterprise discovery platform that enables all users in an organization to perform self-service BI. With QlikView, you can analyze and visualize data and their relationships and use these analyzes to make decisions. It Supports various data sources, including the relational database. If any data source is too large for QlikView’s memory, it can connect to that data source directly. QlikView compresses data and keeps it in memory so that it can be used by multiple users immediately for analysis purposes.
.png)
Although datasets are large, QlikView can analyze and grasp the big picture, find connections between data and provide insight into the data. QlikView works just like the human brain. Like the human brain, QlikView provides associative links between processed data.
Get a head start on your career by learning Qlikview with Mindmajix Qlikview online training.
Below are some QlikView features that quickly enable advanced reporting from multiple data sources.
- Since QlikView stores data in memory, aggregation can be done quickly because we do not need to store pre-calculated aggregate values.
- QlikView compresses the data to 10% of the original size.
- QlikView automatically finds the relationship between data as soon as it is fed into it. There is no need to configure the relationship between datasets.
- With QlikView, direct and indirect lookups will work thanks to the data association feature.
- Relationships between data items are shown as colors instead of arrows or lines.
QlikView has many different applications. Which method you have to use is up to you. Below are some applications where you can use QlikView.
- Dynamic graphic tables and graphs
- Create your expert systems
- Create new tables by merging data from different sources
- Statistical analysis and performance
- Get snapshots of data relationships
- Presentation based on
QlikView Architecture Overview
QlikView is a Windows-based application. The QlikView architecture is divided between different roles. Its frontend allows us to visualize the processed data, while its backend provides the security of QlikView documents. It consists of 3 main components:
- QlikView server
- Publisher of QlikView
- QlikView desktop
In addition, it also includes several other components, such as QlikView Management Console and QlikView User Access. All of these components contribute to and help QlikView design and develop applications.
Before going into its architecture, we will first explore all its components to know how and why they are used.
QlikView desktop
- QlikView Desktop is a Windows-based, wizard-driven tool through which users can develop the GUI and data model of QlikView applications. It also makes it easy for users to manipulate datasets using a SQL-like scripting language. Using QlikView Desktop, data can be transformed, read, and shared between different QlikView applications.
- Users can choose their data representation modes in QlikView Desktop. User interface details files are saved with a .qvw extension. However, if the files do not contain UI details, the file extension will be changed to .qvd.
QlikView server
- So you need a server, which is QlikView Server, to host all the developed QlikView applications. Once applications are hosted, only those applications are available to end users. QlikView Server communicates between the server and the client as a desktop, web browser, or mobile. QlikView Server is responsible for serving datasets from the backend to end users.
- QlikView Server has many features such as data management, security, data distribution, scaling, etc.
Publisher of QlikView
QlikView Publisher is a distribution service that can retrieve data from various data sources such as data files, Informatica, Salesforce, etc., and load it into QlikView files (.qvd or .qvw). The .qvw fill will get distributed among QlikView Users and its servers. In addition, it also manages access permissions and authorization.
QlikView Administration Console
The QlikView Management Console is a web interface managed by an IT professional. It is a central control console that serves all QlikView components.
QlikView user access
QlikView User Access is located on the front end, where users can access QlikView and manipulate data files. Users can access this interface from any media such as web, mobile, desktop, laptop, etc.
QlikView Directory Service Connector
The QlikView Directory Service Connector can retrieve various user details for end users from various sources such as Active Directory, ODBS, LDAP, and custom users. Web services use the Directory Service Connector to resolve any group and DSC will look up their email addresses.
How does QlikView work?
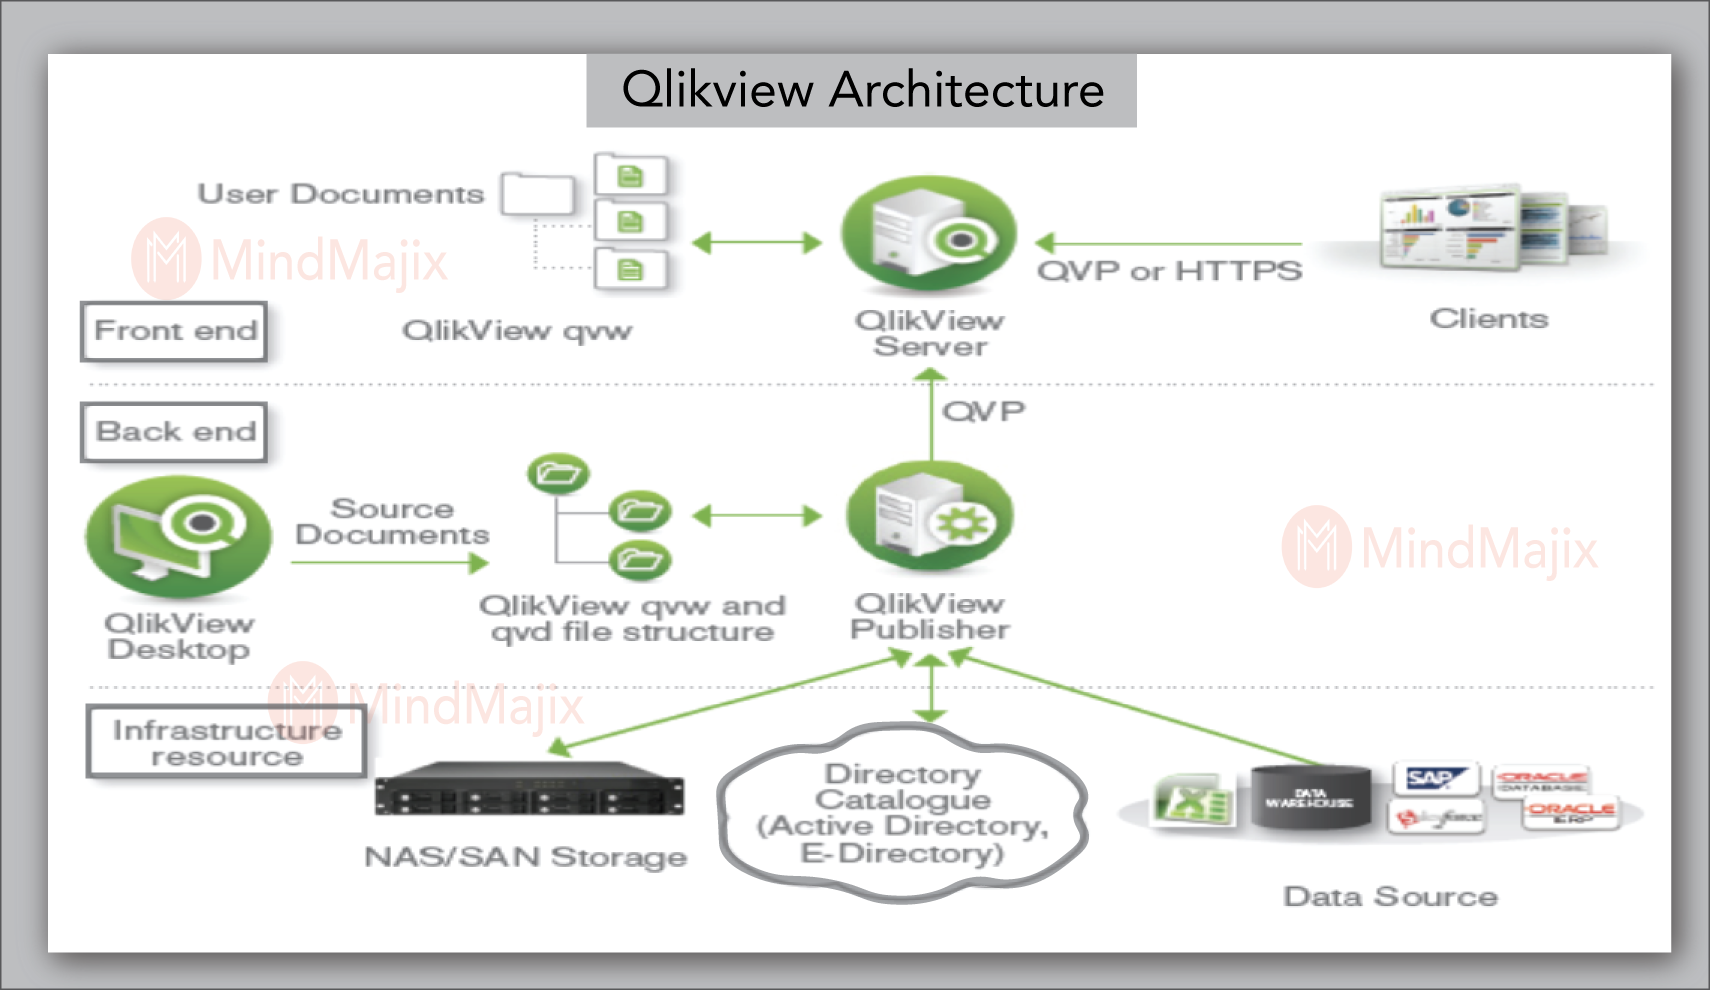
Now let’s see how all these components are related and communicate. The diagram below shows how all the components are connected.
The entire architecture is divided into 2 sets based on their roles:
Front end:
The front end is where users interact and manipulate the data and documents they are authorized to access using the QlikView server. In addition, the frontend contains documents created using QlikView Publisher on the backend. The front end is responsible for all client and server interactions.
Rear end:
The back end is where QlikView stores documents that QlikView Developer creates. Source files have scripts to load data from various data sources like Excel, Salesforce, Data warehouses, SAP, etc. The distribution service is responsible for loading and distribution in the backend. The back-end uses infrastructure resources such as directory catalogs or SMTP servers for clustering.
QlikView’s three-tier architecture
QlikView’s three-tier architecture includes 3 layers for extracting data from various sources, storing it in QlikView data files, applying business logic, and developing data models using QlikView data files (QVD files), and creating dashboards so that end users can analyze and process the data.
Let’s examine each layer in detail to understand the importance of that layer in the QlikView architecture.
Load layer
- This layer connects to various data sources to retrieve and save it to QlikView data files (QVD files). It can connect to a database using an ODBC, OLEDB connection, or any third-party tool like Salesforce to retrieve data.
- A QVD file contains data extracted from QlikView. It reads QVD files 10 to 100 times faster. It, therefore, increases the data loading speed and reduces the load on database servers. Incremental loading is also possible for QVD files, and you can also consolidate data from different QlikView applications into a single QVD file.
Transformation layer
• The transformation layer, as the name suggests, transforms QVD files into business logic. Based on this, a data model with a star or snowflake schema is created.
• Snowflake schema is a schema where large dimensional tables are normalized and converted to multiple tables. A star schema is a schema where a fact table is joined to a table of different dimensions, creating a star pattern. A star schema has one fact table and is associated with many dimension tables to display a star.
Presentation layer
• This layer has the binary from the second layer. This binary is used to load data and access parts of a QlikView document. Layout information is not loaded in this. Dashboards are prepared using this.
• A dashboard is a data visualization tool showing an organization’s metrics, status, and KPIs. It also has various widgets and filters for business end users to easily analyze and process data and identify business successes and failures.
Conclusion
Here, understanding the architecture of QlikView will tell you a lot about how QlikView works in practice. As this is self-service software, it is essential to know its architecture before working on it. All of these components contribute to and help QlikView design and develop applications.
- QlikView compresses data and keeps it in memory so that it can be used by multiple users immediately for analysis purposes.
- These are the 3 levels in the QlikView architecture – Load (extract and QVD layer), Transformation (QlikMart layer), Presentation
-
QlikView is a Windows-based application. The QlikView architecture is divided between different roles. Its frontend allows us to visualize the processed data, while its backend provides the security of QlikView documents.
-
QlikView can analyze and grasp the big picture, find connections between data and provide insight into the data. QlikView works just like the human brain. Like the human brain, QlikView provides associative links between processed data.
The media shown in this article is not owned by Analytics Vidhya and is used at the Author’s discretion.


