If you’re new to Power BI Desktop, this post is for you. You’ll learn the fundamentals of DAX in Power BI and how to apply them to common math and data analysis tasks in no time. We’ll review some abstract concepts, give you some exercises to do, and then have you take a quiz to see how much you’ve learned. It is expected that readers will finish this article with a firm grasp of DAX most crucial underpinnings.
This article was published as a part of the Data Science Blogathon.
Table of contents
What is DAX in Power BI?
Data Analysis Expressions, or DAX for short, are expressions and formulas for analyzing and calculating data. Expressions like this are made up of various parts, such as functions, operators, and constants, all combined into a single formula and evaluated to provide a result (value or values). Power BI and other BI tools make excellent use of the data at their disposal, and the DAX formulae they contain are a big reason.
Take a look at these highlights to have a firmer grasp of the idea.
- DAX is what’s known as a “functional language,” meaning that every bit of code written in it is a function. Conditional statements, nested functions, value references, etc., can all be part of a DAX expression ready for execution.
- DAX formulas can work with two basic data types: numeric and non-numeric or others. Integers, decimals, currencies, etc., are all examples of the numeric data type. Strings and binary objects make up the non-numerical category.
- Evaluating DAX expressions begins at the innermost function and progresses to the outermost function. Consequently, it is crucial to develop a DAX formula.
- When a DAX formula is executed, it will convert any values of a different data type than the one it was created for. The DAX formula will automatically cast the output values to the specified data type.
Why Learn DAX?
New Power BI Desktop files can be made and data imported with little effort. You don’t even need to know DAX to make reports displaying actionable insights. But what if you need to examine growth rates for several merchandise types and time intervals? Or perhaps you’re trying to figure out how to compare your company’s growth rates with the market as a whole; this functionality, among many others, is provided by DAX formulas. Writing efficient formulas will allow you to use your information better. Once you have all the facts, you can start fixing the issues plaguing your company’s bottom line. This is where Power BI shines, and you’ll find success with the support of DAX.
Requirements to Leaen DAX
You are probably already familiar with the ability to create formulas in Microsoft Excel. While familiarity with Excel formulae will aid in grasping DAX, the concepts outlined here will allow you to begin writing your own DAX formulas and solving practical BI problems immediately.
This lesson will teach us to employ DAX formulas in measures and calculating columns. It is assumed that you are already aware of the basics of Measures and Calculated columns and how to use Power BI Desktop to import data and add fields to a report.
Automatic Measures
In most cases, Power BI Desktop automatically generates a measure for you. Here’s how to construct a metric in Power BI Desktop:
Load the sales file in the Power BI Desktop.
Open the Sales table in the Fields panel. The SalesAmount field can then be added to the report canvas by checking the box adjacent to it or dragging it there.
.png)
When you click on the new column chart, you’ll get a graphical representation of the sum of all the numbers in the SalesAmount column of the Sales table.
Example workbook
The easiest method to understand DAX is to practise creating and using simple formulas on real data. We’ll import the Sales.xls dataset into Power BI Desktop for these exercises.
Parts of a DAX
Syntax, Functions, and Context will be the cornerstones upon which our DAX education will be built.
Let’s look at the syntax of DAX formulae before you start making your own. A formula’s syntax consists of its parts or, more simply, of how the calculation is written. This is a basic formula for a measure in DAX:
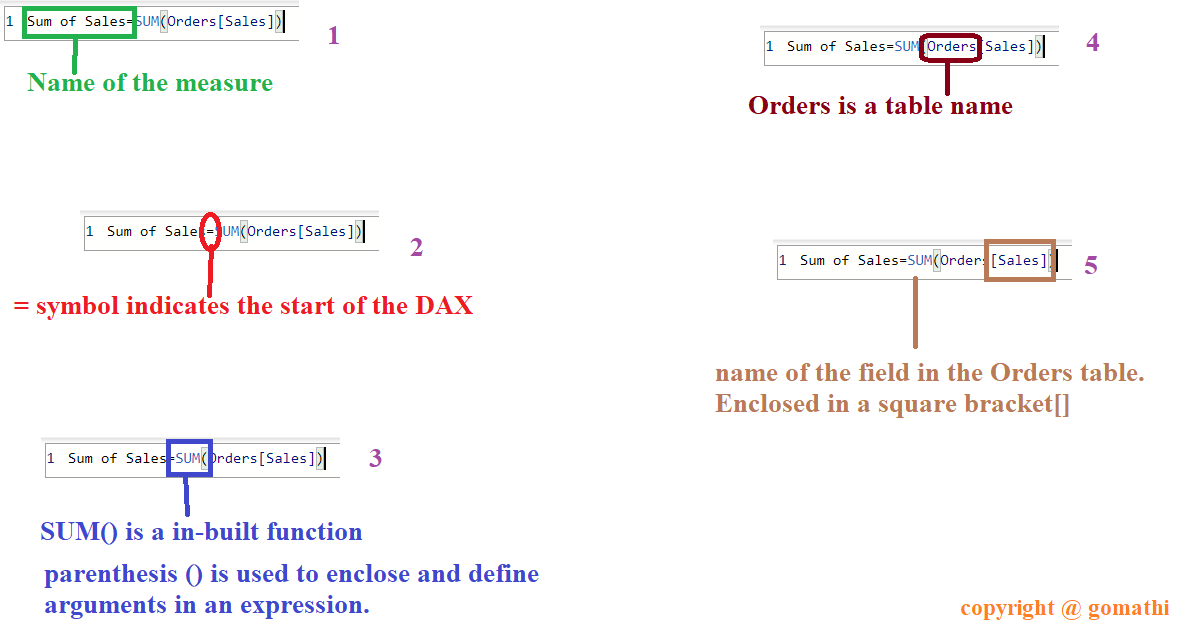
Types of DAX
In Power BI, DAX can be used to construct two distinct kinds of expressions and calculations:
- Calculated columns
- Calculated measures
Calculated Columns
When you use the calculated columns, a new column will be added to your table. A calculated column is identical to any other column, except that it must contain at least one function. You can use them to make a filtered or sorted column in your table.
Calculated Measures.
A field with consolidated data (a total, proportion, per cent, mean, etc.) is generated by a calculated measure.
Steps to Create the Calculated Columns
1. Turn on the Power BI Desktop
2. In the Power BI Desktop left pane, select the Data tab.
.png)
3. Next, click the New Column button
.png)
4. In the Formula bar, enter “Column =” and hit enter.
.png)
5. Column can be changed to the desired column name.
Steps to Create a Calculated Measure
1. Power BI Desktop’s Modeling section.
2. Next, choose the “New Measure” menu item.
.png)
3. The words “Measure =” will appear in a Formulas window.
.png)
4. You can change “Measure” to any other name for a unit of measurement.
.png)
5. Next, type the expression for the resultant size to the right of the equals sign.
.png)
6. Once you’ve made a measurement, you may give it a new name by clicking on the calculator icon that appears next to the measure’s name in the table where it was made.
Context in DAX
Knowing the DAX context is crucial for mastering the DAX syntax with Power BI. In DAX, you can work with either a Row context or a Filter context.
- Row Context: Using a filtering row as a reference in a DAX expression means “row context.” The formula’s action on the current row is the primary concern in the row context. The rows of measures typically receive this kind of context.
- Filter Context: The filter context goes beyond a simple emphasis on values. Row context allowed us to select which rows to process and eliminate others. However, the phrase narrows in on particular values inside a row when used as a filter. Therefore, the filter context is used with the row context to restrict the range of values to which a calculation is applied. We apply filter context when we use CALCULATE, FILTER, RELATED, ALL, etc..
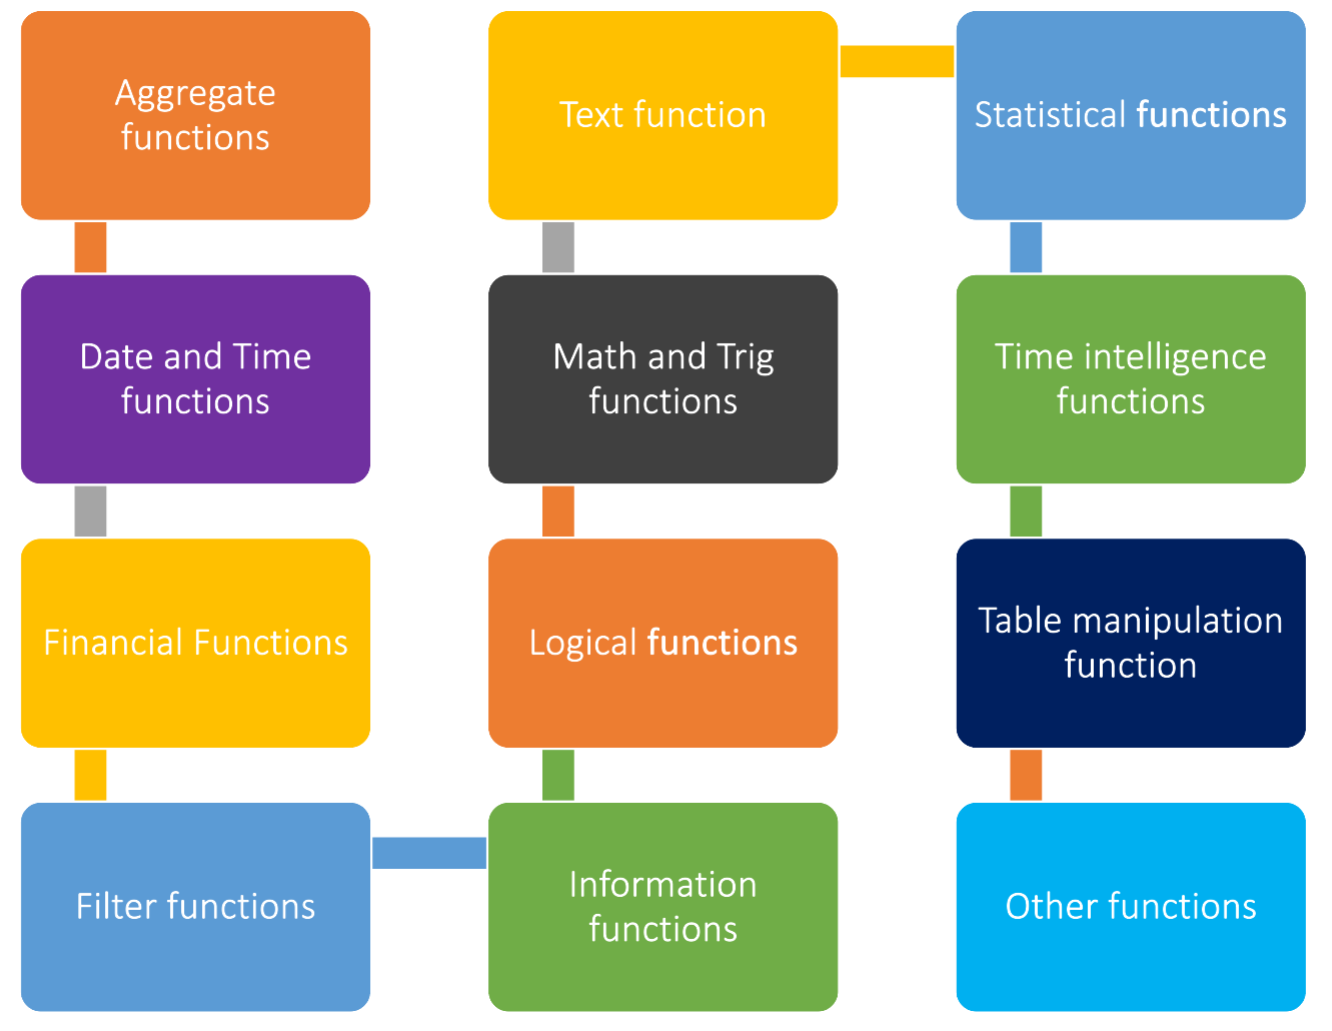
Different Types of DAX in Power BI
Conclusion
In conclusion, DAX is a powerful formula language that can be used to handle data modelling, add value to data, and visualize measures in Power BI. This tutorial has provided an overview of the basics of DAX, the components of a DAX expression, and the types of DAX measures. We have also discussed the detailed steps to create calculated columns and measures in Power BI. To continue learning and mastering DAX, we recommend checking out the Analytics Vidhya Blackbelt program.
Frequently Asked Questions
Q1. What is DAX used for?
A. DAX (Data Analysis Expressions) is a formula language used in Power BI to create custom calculations and aggregations for data analysis. It manipulates and analyzes data from different sources, creates new calculated columns and measures, and performs complex calculations and analyses.
Q2. What are the 2 types of DAX?
A. The two types of DAX are calculated columns and measures. Calculated columns are created by using a DAX formula to derive a new column based on an existing column in the table. Measures, on the other hand, are used to aggregate data and perform calculations on a dataset.
Q3. How do you write DAX for Power BI?
A. To write DAX for Power BI, you need first to create a new calculated column or measure in the table or visual. Then, enter the DAX formula in the formula bar, which contains a variety of functions, operators, and constants to help you create complex calculations.
Q4. What is DAX syntax?
A. DAX syntax refers to the rules and conventions used to write DAX formulas. It includes functions, operators, and expressions that are used to manipulate and aggregate data. The basic syntax of DAX is similar to Excel formulas, with additional functions and operators specific to Power BI.
Q5. What are the 3 fundamental concepts of DAX?
A. The three fundamental concepts of DAX are tables, columns, and measures. Tables store data, columns describe the attributes of the data, and measures perform calculations on the data. These concepts form the foundation of DAX and are used to create complex data models and analyses in Power BI.
The media shown in this article is not owned by Analytics Vidhya and is used at the Author’s discretion.


Thanks for this blog. very informative and easy to understand