2. Variance is the spread of the data we have observed, which is how far it is from the mean.
3. Standard deviation is simply the root of the variance
4. CLT (Central limit theorem)
Given a sufficiently large sample size from a population with a finite level of variance, the mean of all sampled variables from the same population will be approximately equal to the mean of the whole population
Thinking A/B Testing Hypothesis
The A/B testing needs to have some hypothesis. So whatever the feature you are launching, you have to have some hypothesis, like what kind of effect it will do at the end. And defining a hypothesis is not easy. The industry has grown and defined multiple things to capture the impact of that feature.
So defining a matrix is critical for the hypothesis, like what kind of Matrix will be looking for in general across the industry people use HEART for launching any feature.
HEART
It is happiness, engagement, adoption, retention & task success. What does it mean? It means a proxy for user satisfaction. Engagement is like how the user gets engaged with that feature, for instance, how often a user interacts with that feature. The adoption is the new user who has been exposed to this feature or how likely the person will adopt that feature. Retention means the existing user will be in continuous touch or not like next month. The task success is the revenue one gets from launching this feature. So this becomes a kind of indicator. If somebody launches a feature, these indicators can help him/her understand that scenarios like these impact what he/she is getting or thinking about some hypothesis.
While giving the treatment, we define two types of hypothesis – one is the null hypothesis, and one is the alternative hypothesis. So null hypothesis means no effect in the controlled budget treatment. Let’s say, in treatment. You have learned some features, so the hypothesis is creating is that this group of people and this group of people will behave exactly the same. In the alternative hypothesis, there will be some effect, either it can be positive or either it can be negative.
The objective of A/B testing
The objective of the A/B experiment is to reject the null hypothesis. Therefore, we define whatever hypothesis we have as not the same as the part we are trying to define in the A/B expected.
Statistical Significance
What is the statistical significance? It’s like what we want to observe is–the two groups. We want to find like which one is going better, but we also want to define it as being that the community users are growing in nature. So there can be a chance where you see the uplift just by luck or chance. We want to avoid those things. Whatever we are observing is not by luck, but the treatment has made that effect, and we see some updates in the treatment group.
Then we are trying to define here two kinds of terms -> one is the p-value, and one is the significance level (alpha). So P value is basically whatever the result we are looking into, how extreme the observation is when the null hypothesis is true. What does it mean? The null hypothesis means that there is no change in the group. So it says like the probability of getting the lift when the conditional probability, the null hypothesis, is true. Defining whatever value we are getting is not by luck, but it’s the treatment thing we have observed. The alpha is a kind of hyperparameter.
We accept the null hypothesis whenever the P value is less than Alpha.
Confidence Interval
As if we are going to accept the null hypothesis, but whatever treatment you are giving to a particular group, the number is not enough you have got a lift, and you are going to launch the product. You also want to know what confidence you have for that result and what you are observing if you want to define confidence — 95 per cent confidence that the same result will be observed if the simulation is done 100 times.
Confidence Level = 1 – α, α = 0.05
Let’s understand this with a normal distribution graph.

95 confidence means if it’s sampling the data from this normal distribution, we will be getting the data between Mu -2 standard deviation to Mu +2A standard deviation. The data will lie between these two ranges with 95 per cent confidence. So confidence and confidence level becomes 95 per cent, and mu -2 standard deviation to Mu +2 standard deviation becomes the confidence interval for that curve.
Overall, we can say that the confidence interval ≈ mean is +/- 2*standard deviation. We are 95 confident that whatever result we are expecting will fall between these two range of 95 confidence
Everything is prone to an error whenever we are modelling something or doing some experiment. In the A/B experiment, we define these errors into two parts:
- Type one error
- Type 2 error
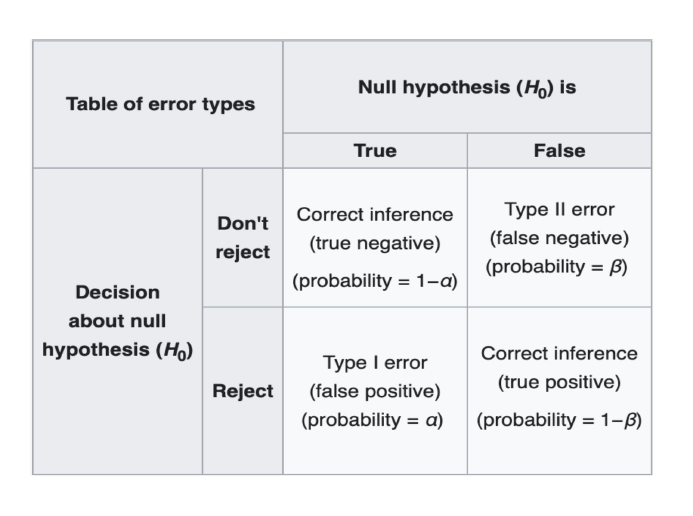
So, if you define the type 1 error, what is it? It’s a false positive, meaning if you’ve not given the treatment, the people still have used it. Let’s say you have not changed the colour but people are still clicking on that; that becomes a false positive. And that becomes a kind of error which is biased merely by luck. The people have used that feature by luck or by mistake but not by your change which becomes a type 1 error we want to avoid.
The type 2 error is the false negative, which defines that whatever the treatment you are giving the people is not onboarding to that; that becomes a type 2 error because it’s not coming to that. We don’t give much attention to this error because it just helps us define the sample size. But type 1 error is critical to us, and we defined it as 0.05 (a default value).

With this graph, we’ll observe what type 1 and type 2 error is. So if you see that we have two curves, one is the blue curve, and one is the red curve; the blue curve is the distribution of the first group, which is controlled, and the red is the curve which got the treatment. It can be anything. The type one error is the part which got converted, but it’s just by luck they’ve got converted, and type 2 is those parts that have not converted but got the treatment.
So we don’t ignore type 2 but need to care more about type 1 errors every moment.
One-tailed vs Two-tailed Test
For example, let’s say you want to measure an effect of a drug on a user on a user called now; that drug can affect the user positively and negatively. So, in that case, what we want to do is we want to measure both extremes of the data. Assuming the mean effectiveness of the drug is 0.9. And addition, there you proposed a new drug that would be your treatment if it performed very badly and would lie around 0.05 (image’s 2nd curve left highlighted part).

It’s statistically significant, and we can say that the treatment is not working or is negatively affecting value. Similarly, if the treatment is working pretty good, then the effect of that treatment or the new effectiveness that we are getting would lie somewhere around 0.05 (image’s 2nd curve right highlighted part).
In the case of, let’s say serious experiment where we want to measure both scenarios. It either has a positive impact or the negative impact. In those cases, we are going for a two-tailed test. So what two-tailed test means? It means we are keeping an eye on both extremes of the curve. So even if there is a positive result, we will accept it as an alternate hypothesis, and even if there is a negative result will be exactly the alternate hypothesis. It’s just that the definition of an alternate hypothesis, whether the result is positive or negative, will change.
But coming on to some different kind of experiment, for example, your company has built a feature, and you’re mandated to release it. Let’s assume that you are pretty sure you will go ahead with the feature. But what if you want to measure the impact of that feature? So what you can do is you can go ahead with a one-tailed experiment.
And make sure, for example, in this case, you are just making sure that I have a new feature, let’s say, your home page. I’m pretty sure I will launch it, and there are few features I will launch ahead with it. I want to test whether it is performing bad or if it is performing at par with the data. So, in this case, we are only looking at the left table(image’s 1st curve left tail). Basically, in this kind of experiment, where you are only concerned with one kind of result and the second kind of result doesn’t matter, in those cases, you choose a one-tailed test.
So, decide whether you want to choose a one-tailed or two-tailed test. Let’s take a scenario: what will I do if there is a positive impact, what will I do if there is a negative impact, or what will I do if there is no impact? If your answer for negative and no impact is similar, you are looking for one-tailed text. And if your answer for negative impact and positive impact and the no impact is different, then, in that case, go ahead with a two-tailed test.
A/B Testing Experiment Flow
The steps involved in the A/B experiment are:

- Experiment Setup: Imagine that you have a hypothesis. You create a feature, such as a recommendation system, and then test it to see if it performs better than the competition. Whether or not it is raising the CTR. Therefore, the premise would be that this feature will raise the metric. When setting up an experiment, you must also be aware of the statical significance you’re after. What is the value you are satisfied with, given the false positive rate that affects you? Then you must also decide on the beta value.
What fake negative value do you feel comfortable with, then? The list you are seeking to view is the next, and this time choosing the left is critical since sometimes the left is so little that it is impossible to launch the feature. And combining all of these factors, you arrive at a sample size, which is essentially the minimal number of users you want to include in each variation so that when the experiment is complete, you can collect your result and be confident that it is statistically significant.
- Experiment launch: During this stage, not much has to be done. However, you must ensure that the split you have defined—say, let’s 50% go into the test bucket and 10% go into the control bucket—is accurate. A user opscom control rocket to the test bucket is the last thing you want. This shouldn’t take place. Similar to how there shouldn’t be a network effect, it shouldn’t happen. Consider a situation where you shared some facts, and many people started visiting the same post. You’re also interacting with the data more right now. What does that imply, then? The IID presumptions we made while starting the experiment are reduced.
- Post-Experiment Analysis: At this, we are interested in the p-value. Basically, what is the final p-value that we are getting? What is the lift we are getting and the confidence interval of that?
- Decision making: At the end of the decision, if you see if your lift is significant or want to launch this feature, do you want to re-experiment it? Sometimes it makes sense to start the experiment again with a much higher significance level.
Experiment Setup: Metrics
● KPI: The second part is once you have the hypothesis, you want to measure the efficiency of your algorithm, but what is the metric you select? In this case, let’s say we go ahead with the proportional conversion rate.
● Guardrail Metrics: For instance, even though you are releasing a new feature and conversion rate is your primary criterion, you do not want to harm your organization’s long-term objectives, such as user retention, monetization rate, or overall engagement. For instance, one algorithm may propose many click-throughs, increasing CTR but decreasing retention over time as users cease visiting your platform. These guardrail measures are, therefore, like the North Star; they should not be touched. If they do, that is better, but if they don’t and let’s see if your conversion rate does, then you must also make a decision, and the conclusion is frequently made that the function cannot be offered.
Experiment Setup: Sample Size Calculation
In this setup image, the experiment that we are interested in is one where we launch a feature on YouTube. Let’s say that before the feature is launched, the base conversion rate is, let’s say, 30, meaning that users click three videos out of every time videos, and the effect that you want to measure is, let’s say, two per cent. This is the two per cent effect I’m talking about, and the experiment’s goal is to determine whether or not the CTR increases to 32 after the treatment is introduced.
Baseline performance: 30%
Minimum Detectable Effect (absolute):2%
(Smallest effect size that is statistically and practically significant to detect)
How do you pick the minimum detectable effect? Even before a feature is launched, it depends on whether it is practically significant. For instance, for a large company like YouTube, even a 0.1 per cent or 0.001 per cent increase in CTR can result in millions of dollars in revenue. Still, for a small company, if you measure a 1% increase in CTR, the cost of rolling out the feature will not be covered by the money you make. In other words, consider whether it is practically significant when deciding what the mini-feature should be.
The third thing is the significance level. What is the false positive that we can accommodate? For instance, let’s say there is no change from control to treatment, but 5% of the time, the sample you collected from the distribution may be possible that it belongs to the right extreme or the left extreme of the distribution, in which case what can happen is that you can falsely tag your experiment is working and you can roll this out. In that case, what will happen is once you go to plot your data, what will happen is that the experiment will appear to be successful.
Power(1- beta): 0.8
Fourth is the power which is one minus beta, where beta is the false negative. Let’s say your treatment is working. Still, there are chances, just like the control curve, that even though the mean of your treatment is good enough, it is above the critical level. Still, when you take that sample out of that population, it may belong to the left cell, the left stream of that curve, and in that case, you will falsely say the experiment didn’t work.
Hypothesis Type: Two-sided
The hypothesis type is a two-sided hypothesis.

This is the formula for calculating the sample size required to test the hypothesis. This is derived based on the power the conditioning that we put on the power and the significance level.

Z-Score
It measures the number of standard deviations by which a score is above or below the mean of a distribution.

A confidence interval is a range of values more likely to improve your population mean with a certain degree of confidence. So, for example, if you want a very high level of confidence, say 95 per cent, the range in which your population means (population mean is the mean that you are trying to estimate companies two distributions) can lie between that two ranges and with a given certainty or given confidence level.


Decision Making as per the Test


Rule of Thumb
Some rules of thumb are as follow:
- Changing clicks is simple; boosting engagement is challenging.
- Speed is VERY Important.
- Avoid Complex Designs: Iterate
- Large wins are uncommon. Inches at a time, you win. On any given Sunday, Al Pacino

alpha=0.05 and beta=0.2 are golden rules and should not be changed. No! The significance level and power you choose completely depend on the underlying experiment and can be/should be changed appropriately. For Example, in a medical trial, a higher Significance level can be used as the impact of a False positive is higher.


