Descriptive vs Inferential Statistics: What’s the Difference?
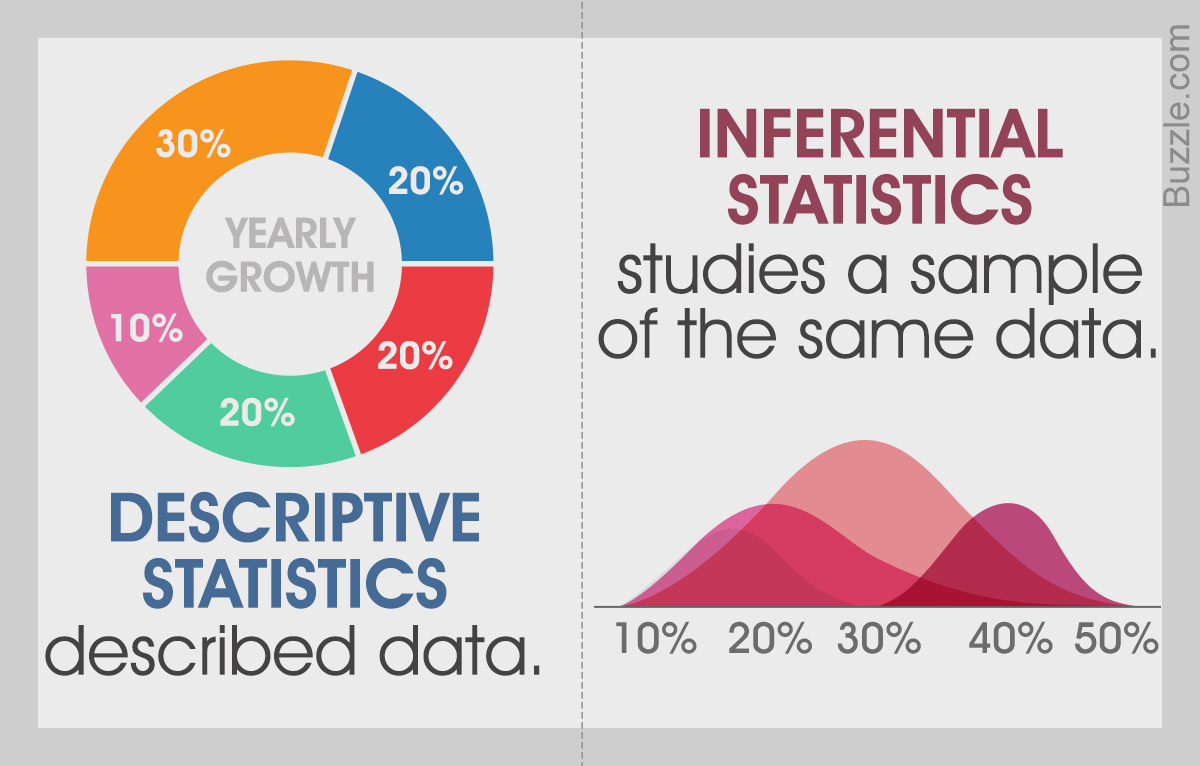
Statistics involves gathering and organizing raw data into an easily understandable format. This field of mathematics helps analyze data and apply the findings to address various data-related issues. There are two broad categories of statistical methods: descriptive and inferential statistics. This article will explain the difference between descriptive vs inferential statistics.
Table of contents
- Descriptive vs Inferential Statistics
- What is Descriptive Statistics?
- What is Inferential Statistics?
- Types of Descriptive Statistics
- Types of Inferential Statistics
- Descriptive vs Inferential Statistics – Examples
- Descriptive vs Inferential Statistics – Advantages and Limitations
- Real Life Example – Descriptive vs Inferential Statistics
- Final Verdict – Descriptive vs Inferential Statistics
- Frequently Asked Questions
Descriptive vs Inferential Statistics
| Descriptive Statistics | Inferential Statistics |
|---|---|
| The area of statistics known as descriptive statistics is focused on providing a description of the population being studied. | A kind of statistics known as inferential statistics concentrates on inferring information about the entire population from observation and sample analysis as well. |
| It provides details about the raw data, which in some way characterizes the data. | Using information obtained from the population, it draws conclusions about the population. |
| It aids in the collection, organization, analysis, and meaningful presentation of data. | It enables data comparison, hypothesis testing, and forecast-making. |
| It is restricted to a sample or population with a modest size and explains already-known facts. | It makes an effort to draw a conclusion regarding the population. |
| It may be done using graphs, tables, charts, and other visual aids. | Probability can help achieve it. |
What is Descriptive Statistics?
Descriptive statistics refers to techniques used to enumerate and characterize a dataset’s key characteristics, such as the variability, central tendency and distribution. These techniques offer a summary of the data and aid in discovering trends and linkages.
A few key takeaways about Descriptive Statistics are as follows:
- Descriptive statistics summarize or describe the characteristics of a data collection.
- It involve three primary types of measures: measures of central tendency, measures of variability (or spread), and measures of frequency distribution.
- Measures of central tendency (such as mean, median, and mode) describe the center of the data set.
- Measures of frequency distribution describe the occurrence or frequency of data within the data collection.

What is Inferential Statistics?
A statistical technique called inferential statistics uses analytical methods to make inferences about a population by analyzing samples taken at random. For example, generalizations about a population.
A few key takeaways about Inferential Statistics are as follows:
- Analyzing samples from population data and employing inferential statistics helps in developing a solid understanding of the data.
- Utilizing various analytical techniques facilitates the creation of population-level generalizations.
- Researchers employ different sampling procedures to select random samples that accurately represent the population.

Also Read: Data Science vs Data Analytics: Which One Will Give You the Edge in 2023?
Types of Descriptive Statistics
Using descriptive statistics, you may describe your data in terms of its characteristics. Descriptive statistics often fall into one of three categories:
Frequency Distribution
Frequency distribution represents the occurrence of an event or element and is utilized for analyzing qualitative and quantitative data. It documents and presents the information in a tabular format.
For instance, consider a school that arranges an annual picnic for a group of students. Some students have visited the picnic area multiple times, while others are returning after a previous visit. The students are categorized based on the number of visits they have made. In this case, the frequency distribution among the students is determined by the number of visits.
Central Tendency
There are three ways to calculate central tendency:
- Mean
- Median
- Mode
The results capture the essence of data collection, a sum of all counts or occurrences. Mean refers to the average value that occurs most frequently, the median designates the middle or center score of the data sample, and the mode signifies the most frequent number.
Variability
Variability is the degree of dispersion between data points, and it is a fundamental statistical concept that provides insights into the data’s spread, distribution, or inconsistency.
For instance, there has only ever been one visit to the picnic area, and four trips to picnic areas are the most. The variability that forms a range determines each value’s distance from the central tendency, and the degree of dispersion is the range itself.
Types of Inferential Statistics
Regression Analysis
Regression analysis predicts how one variable will change with another. These models that can be employed include ordinal, logistic, nominal, basic linear, and multiple linear models. The most common type of regression used in inferential statistics is linear regression. Linear regression investigates the response of the dependent variable to a unit change in the independent variable.
Hypothesis Testing
Hypothesis testing is statistical reasoning using information from a sample to conclude a population probability distribution. The models for hypothesis testing include the following resources:
| Test | Sample Size | Distribution | Purpose |
|---|---|---|---|
| Z-test | ≥ 30 | Normal | Investigate population mean |
| T-test | < 30 | t-distribution | Investigate population mean |
| F-test | Any | Any | Compare variances of two samples/populations |
Also Read: What is the Difference Between Data And Information?
Descriptive vs Inferential Statistics – Examples
Please note that while the general guidelines for using each test are mentioned, there may be specific conditions and assumptions that need to be met for each test to be valid.
Descriptive Statistics Examples
- Class A students scored {70, 85, 90, 65}, and class B students received scores of {60, 40, 89, 96}. The mean is used to calculate the average marks for each class: class A has an average of 77.5, while class B has an average of 71.25. This indicates that class A has a higher average than class B.
- The range is used to assess the difference between the most extreme scores. In the given example, Range A is 25, and Range B is 56, showing that Range B is greater than Range A.
Inferential Statistics Examples
- Using a sample of 100 students, inferential statistics can estimate the average grade of the entire nation’s student population.
- A coach wants to determine how many cartwheels sophomores at his institution can perform. A sample of a few individuals will execute cartwheels, and inferential statistics will be used to conclude the average number of cartwheels sophomores can do.
Descriptive vs Inferential Statistics – Advantages and Limitations
Descriptive Statistics
| Advantages | Disadvantages |
|---|---|
| We can show the data visually with descriptive statistics. Visual data presentation makes information much concise and simple to comprehend. | Based on the provided data values, we cannot use descriptive statistics to make any prediction. |
| We can highlight the key features of the data using the various statistical metrics. | The process of gathering data utilizes time and money. For instance, running a survey requires a lot of labor to gather data. |
Inferential Statistics
| Advantages | Disadvantages |
|---|---|
| As a result, we may conserve time and resources by concluding the entire population from a small sample size. | Based on a sample, we drew estimations and conclusions, although they required greater accuracy. As we are not examining the entire population, there will always be a certain degree of uncertainty. |
| Based on historical values, we may anticipate the future values that a dependent variable will take using inferential statistical techniques like linear regression. | We assume a normal distribution in the parent population to serve as the basis for the majority of hypothesis tests concerning the equality of means and variances. |
Real Life Example – Descriptive vs Inferential Statistics
| Descriptive Statistics | Inferential Statistics |
|---|---|
| Political polling is considered a descriptive statistic as it presents actual data, which are the respondents’ responses, without making any inferences. Polls include questions like, “Whom did you vote for as President in the most recent election?” to gather information. | Many people think that girls’ development is stunted by early gymnastics participation, and it is impossible to gather information on every female gymnast to respond. Even so, you may test the null hypothesis that “female gymnasts and non-gymnosophist do not differ in height as adults” using a sample of gymnasts using the central limit theorem and inferential statistics. |
Checkout: Data Scientist vs Data Analyst: Which is a Better Career Option to Pursue in 2023?
Final Verdict – Descriptive vs Inferential Statistics
Descriptive and inferential statistics are most frequently used in combination, even though we have only presented them in a binary manner. These potent statistical methods work well together and form the basis of data analytics. If you are just starting out your career journey to Data Analyst, then our free courses will help you a lot in upskilling. Check out all our courses now!
Frequently Asked Questions
A. The properties of data collection are enumerated via descriptive statistics. You can test a hypothesis using inferential statistics or determine whether your data can be applied to a larger population. That is the key difference between descriptive and inferential statistics.
A. Let’s say you have access to the grades of 100 students from a particular nation. It is necessary to assess these kids’ performance. By itself, this information will provide only some valuable results. But descriptive statistics may be used to determine the distribution of the marks, providing a clear picture of each student’s performance.
Imagine you need to check the student’s test results from a particular nation. Inferential statistics are used to conclude the population using a sample of, say, 100 students.
A. Estimating populations (for instance, the mean score of all 11th graders) is an example of inferential statistics.
Also, testing hypotheses to make population-level inferences (such as the association between scores and family income).
A. The Grade Average of a student is a perfect illustration of descriptive statistics. A GPA compiles the data generated by a wide range of grades, classes, and examinations, averages them together, and then provides a broad idea of the students’ academic achievement.


