The main purpose behind creating any dashboard is to summarize and aggregate information in a manner that can be communicated visually and clearly. Traditionally, this summarizing and aggregating used to happen outside the purview of dashboarding tool.
This is how a traditional BI architecture looks like:
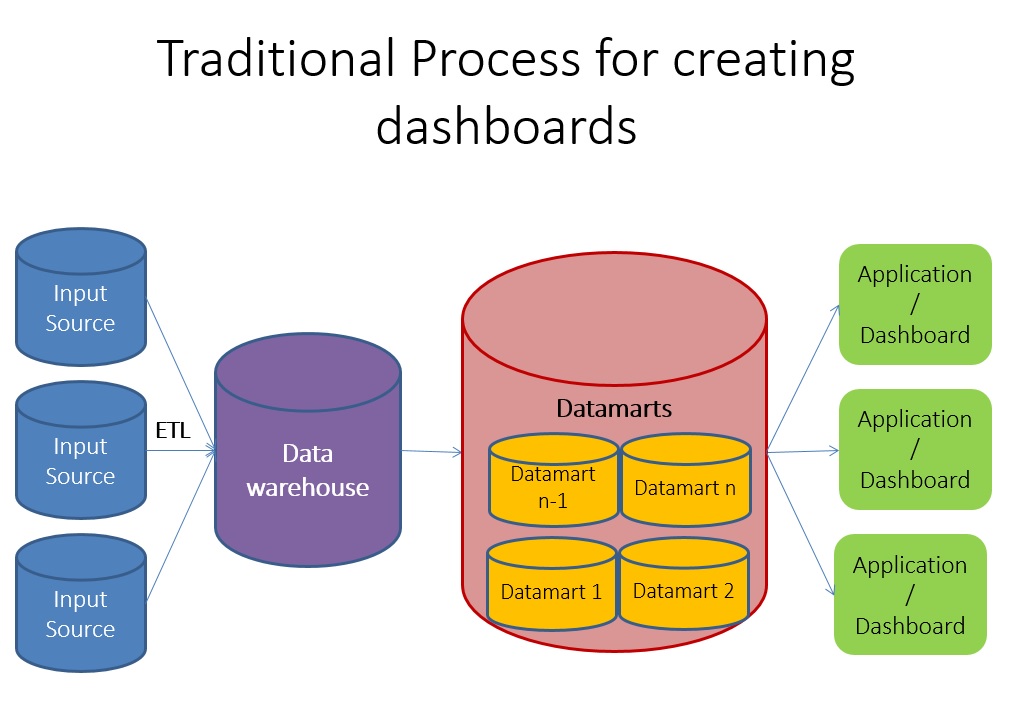
Traditional process of dashbaording
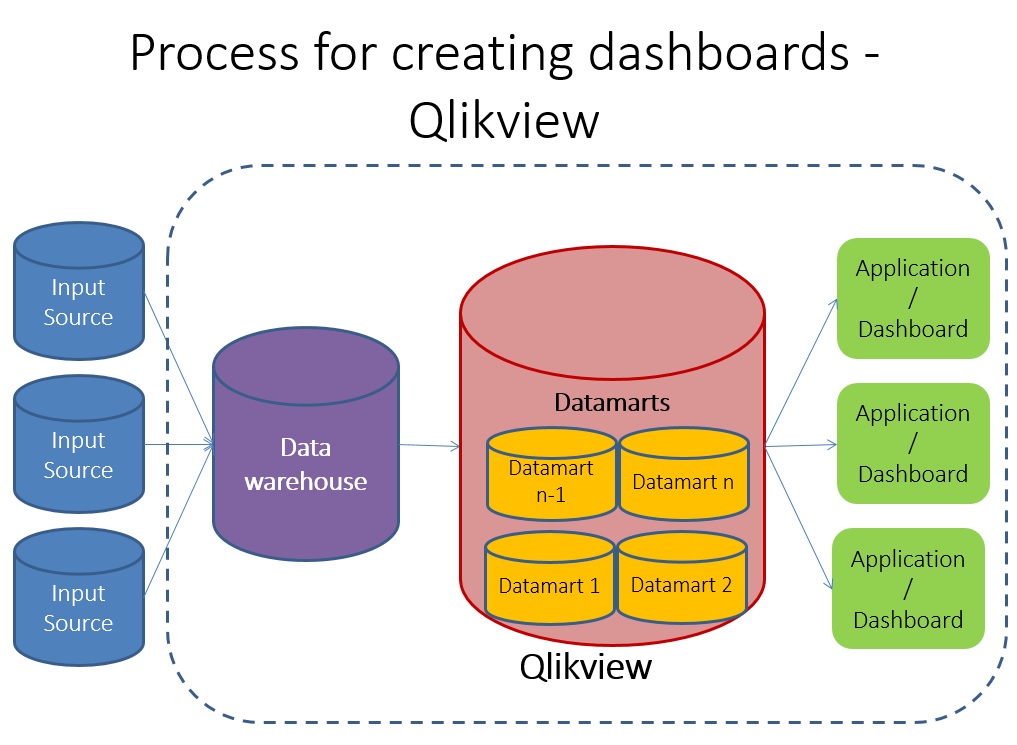
Input sources are typically transactional in nature and all the summarizing typically used to happen in Datamarts. However, Qlikview works on a different architecture, it connects directly to the input systems and can add layers internally so that you do not need datamarts or data warehouse. Here is a representation of how it might look:
Since, Qlikview provides an option to perform aggregation with in, it needs strong aggregation function. The idea of this post is to introduce you to usage of AGGR() function in Qlikview.
Aggregate function(s) is developed in a way such that we can use it for multiple applications like conditional value return, multiple value return or many more. These advance aggregate function can improve our dashboards and reports multi-fold.
[stextbox id = “section”] What is AGGR?[/stextbox]
AGGR is a very powerful aggregation function in QLikview that is sometimes overlooked due to lack of understanding or familiarity. AGGR statements creates a temporary table of results, with one expression which can be grouped by one or more dimensions. It is similar to “Group by” in SQL.
Results of virtual table can be used by outer aggregate function(s). It can be used in expression and dimension both (calculated dimension).
Syntax :
aggr ([ distinct | nodistinct ] [{set_expression}]expression {, dimension})
When should we use AGGR?
- Whenever we do aggregation in two steps like Sum of sales of top selling product by company or Highest average sale by Product and Company, in both statements we are doing two aggregation.
- We want to identify top/ bottom population in segment
- It becomes more powerful, when it is used with Set analysis, Rank(), FirstSortedValue().
Example Dataset:

Please note that I have chosen a transactional data to bring out the aspects of aggregation in better manner.
Also Read: Create a simple and effective sales board with Qlikview
[stextbox id = “section”]AGGR Examples: [/stextbox]
Now, we will explore how to use simple AGGR function in CHART, Pivot Table or Straight tables. Below are examples where we can use AGGR function:
- Sales of top selling product
- Highest average sale of Product
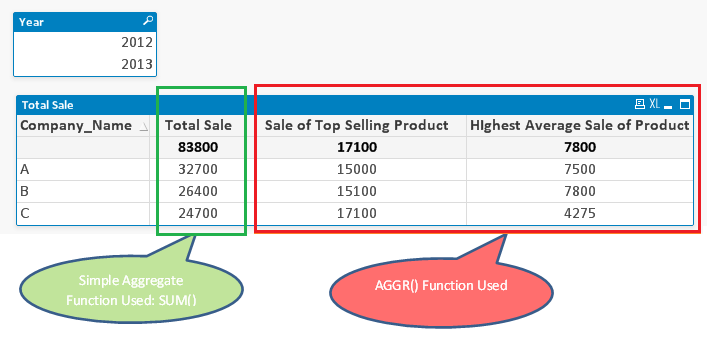
Total sales of the company can be calculated by using function SUM() simply (as SUM(Sale)). However, we need to calculate the sale of top selling product by a company.To solve this we will use AGGR function by doing two aggregations in one step.
To achieve sale for the top selling product for each company, we need to have those dimensions(Company_Name and Product) in our AGGR statement….
=Max ( aggr ( sum ( Sale ), Company_Name , Product ) )
As mentioned before, when do we use AGGR function, it creates a temporary table. In this case, QlikView has calculated the sale for each Product by Company. From this virtual table we have to identify maximum sales value and it is done by MAX() function.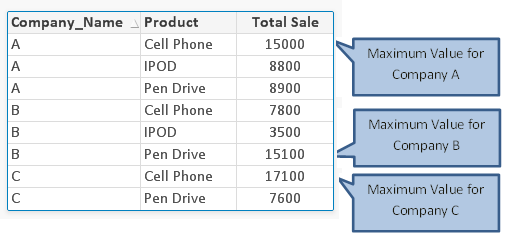
Next scenario is to calculate highest average sale of product by company. To solve this, we need to have expression for average sale as “SUM(Sale)/Count(Product)” and required dimensions within our AGGR statement:
=Max( aggr ( sum(Sale)/Count(Product) , Company_Name, Product ) )
In this case also, Qlikview will generate temporary table for average sale by Product and Company and post that MAX function will identify the largest value.
Also Read:2 simple hacks to improve information density in your Qlikview Dashboards
[stextbox id = “section”] AGGR With Set Analysis :[/stextbox]
In above examples, expression were working with current selection sets where as if we want to compare previous year sale of top selling product with current year then we have to use set analysis methodology in our expression.
In case you are new to Set Analysis, please refer to my previous post “Set Analysis in QlikView – simplified!.”
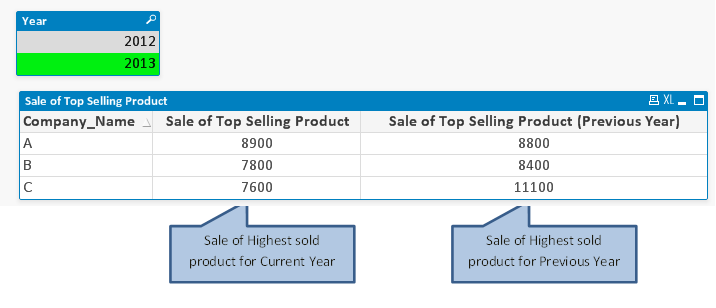
To return the sales of top selling product for previous year, we need to write a set expression:
=Max({<Year={$(=Max(Year)-1)}>} aggr (sum( {<Year={$(=Max(Year)-1)}>} Sale),Company_Name,Product))
To understand more clearly, it will look like:
=Max({<Year={2012}>} aggr (sum( {<Year={2012}>} Sale),Company_Name,Product))
In above expression, i have used set expression twice, one for MAX function and another one for AGGR.
[stextbox id = “section”] AGGR With FIRSTSORTEDVALUE :[/stextbox]
Let us take a scenario, where we have to identify Product Name that sold the most during selected period by company. To do so, we have to use AGGR function in conjunction with function FIRSTSORTEDVALUE().
FIRSTSORTEDVALUE function return the first value of expression sorted by corresponding sort-weight. Sort weight should be numeric value and it returns NULL value if more than one expression value share the same sort order so if there is tie in sorting it returns NULL value unless you do some thing else to overcome this issue.
To extract the last sorted value which is opposite to first sorted value, we need to add a minus sign (-) to sort weight expression. We can also use set analysis and Total in FIRSTSORTEDVALUE function.
Syntax:- FIRSTSORTVALUE( Field, Sort-Weight)
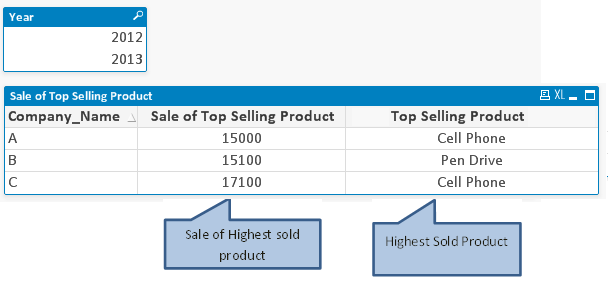
As mentioned above, to identify name of Product based on highest sales product by company, we have to write expression like :
=FIRSTSORTEDVALUE (Product, – aggr(sum(Sale),Company_Name,Product) )
In above expression, AGGR statement generates a virtual table that has total sales by company and product. Then, FIRSTSORTEDVALUE function identifies the Product Name from the virtual table for highest sale. Because aggr function is preceded by minus sign (-), it will return product name against highest sales.
[stextbox id = “section”] Identify Top/ Bottom or specific segment [/stextbox]
One of the best use case scenario where I use AGGR function is to identify the top/ Bottom segment. Here, we will identify top 2 product across year 2012 & 2013 within a text object as seen below:
To achieve this we will use Concat() and Rank() functions in conjunction with AGGR statement. Completed expression is as follows:
=concat ( IF( aggr ( Rank(sum(Sale)),Product)<=2, Product & chr(10)))
Expression “aggr(Rank(Sum(Sale)),Product)”, creates a virtual table with Product and Rank against their sale.The next step is to add in our IF statement to request that we only receive the top 2 product in the result. So, if the rank in our virtual AGGR table is <=2 then show the product else return null().
Finally, we want to show the results of this in a text object. We have used CONCAT() function to concatenate the 2 Product values together. To add a separate line between both product, we have used chr(10).
This post was an example where we have brought out methods to use AGGR in Qlikview. Do you have more tricks to make AGGR more interesting? If not, do you think this article will enable you to use AGGR function in your next dashboard?
Do let me know your thoughts on using this feature in QlikView.
If you like what you just read & want to continue your analytics learning, subscribe to our emails or like our facebook page.
Sunil Ray is Chief Content Officer at Analytics Vidhya, India's largest Analytics community. I am deeply passionate about understanding and explaining concepts from first principles. In my current role, I am responsible for creating top notch content for Analytics Vidhya including its courses, conferences, blogs and Competitions.
I thrive in fast paced environment and love building and scaling products which unleash huge value for customers using data and technology. Over the last 6 years, I have built the content team and created multiple data products at Analytics Vidhya.
Prior to Analytics Vidhya, I have 7+ years of experience working with several insurance companies like Max Life, Max Bupa, Birla Sun Life & Aviva Life Insurance in different data roles.
Industry exposure: Insurance, and EdTech
Major capabilities: Content Development, Product Management, Analytics, Growth Strategy.


Your demonstration is simple and easy to understand. How to calculate the sum and average of the top two products in a text box.
Really nice! I did not understood before aggr() ! Thanks
If I have the dimension of customer, and the two measures of Sales value and Date. How in a table grouped at Customer level can I show the minimum date WHERE the sales value is the maximum, ie the same sales value could repeat across dates and I want the earliest that the max has occured. I have tried to manipulate an AGGR function but to no avail