
With increase in computational power, we can now choose algorithms which perform very intensive calculations. One such algorithm is “Random Forest”, which we will discuss in this article. While the algorithm is very popular in various competitions (e.g. like the ones running on Kaggle), the end output of the model is like a black box and hence should be used judiciously.
Before going any further, here is an example on the importance of choosing the best algorithm.
Importance of choosing the right algorithm
Yesterday, I saw a movie called ” Edge of tomorrow“. I loved the concept and the thought process which went behind the plot of this movie. Let me summarize the plot (without commenting on the climax, of course). Unlike other sci-fi movies, this movie revolves around one single power which is given to both the sides (hero and villain). The power being the ability to reset the day.
Human race is at war with an alien species called “Mimics”. Mimic is described as a far more evolved civilization of an alien species. Entire Mimic civilization is like a single complete organism. It has a central brain called “Omega” which commands all other organisms in the civilization. It stays in contact with all other species of the civilization every single second. “Alpha” is the main warrior species (like the nervous system) of this civilization and takes command from “Omega”. “Omega” has the power to reset the day at any point of time.
Now, let’s wear the hat of a predictive analyst to analyze this plot. If a system has the ability to reset the day at any point of time, it will use this power, whenever any of its warrior species die. And, hence there will be no single war ,when any of the warrior species (alpha) will actually die, and the brain “Omega” will repeatedly test the best case scenario to maximize the death of human race and put a constraint on number of deaths of alpha (warrior species) to be zero every single day. You can imagine this as “THE BEST” predictive algorithm ever made. It is literally impossible to defeat such an algorithm.
Let’s now get back to “Random Forests” using a case study.
Case Study
Following is a distribution of Annual income Gini Coefficients across different countries :
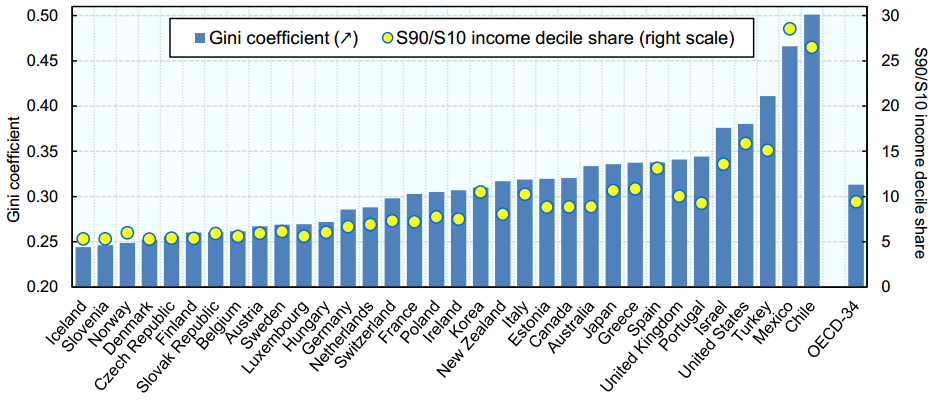
Mexico has the second highest Gini coefficient and hence has a very high segregation in annual income of rich and poor. Our task is to come up with an accurate predictive algorithm to estimate annual income bracket of each individual in Mexico. The brackets of income are as follows :
1. Below $40,000
2. $40,000 – 150,000
3. More than $150,000
Following are the information available for each individual :
1. Age , 2. Gender, 3. Highest educational qualification, 4. Working in Industry, 5. Residence in Metro/Non-metro
We need to come up with an algorithm to give an accurate prediction for an individual who has following traits:
1. Age : 35 years , 2, Gender : Male , 3. Highest Educational Qualification : Diploma holder, 4. Industry : Manufacturing, 5. Residence : Metro
We will only talk about random forest to make this prediction in this article.
The algorithm of Random Forest
Random forest is like bootstrapping algorithm with Decision tree (CART) model. Say, we have 1000 observation in the complete population with 10 variables. Random forest tries to build multiple CART models with different samples and different initial variables. For instance, it will take a random sample of 100 observation and 5 randomly chosen initial variables to build a CART model. It will repeat the process (say) 10 times and then make a final prediction on each observation. Final prediction is a function of each prediction. This final prediction can simply be the mean of each prediction.
Back to Case study
Disclaimer : The numbers in this article are illustrative
Mexico has a population of 118 MM. Say, the algorithm Random forest picks up 10k observation with only one variable (for simplicity) to build each CART model. In total, we are looking at 5 CART model being built with different variables. In a real life problem, you will have more number of population sample and different combinations of input variables.
Salary bands :
Band 1 : Below $40,000
Band 2: $40,000 – 150,000
Band 3: More than $150,000
Following are the outputs of the 5 different CART model.
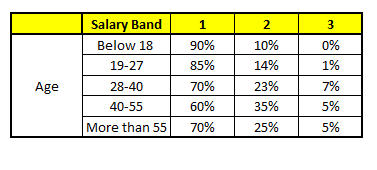
CART 1 : Variable Age
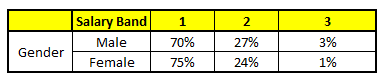
CART 2 : Variable Gender
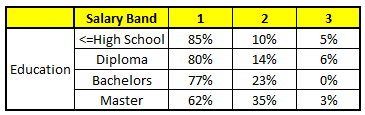
CART 3 : Variable Education
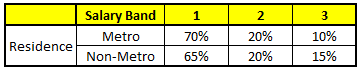
CART 4 : Variable Residence
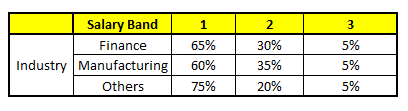
CART 5 : Variable Industry
Using these 5 CART models, we need to come up with singe set of probability to belong to each of the salary classes. For simplicity, we will just take a mean of probabilities in this case study. Other than simple mean, we also consider vote method to come up with the final prediction. To come up with the final prediction let’s locate the following profile in each CART model :
1. Age : 35 years , 2, Gender : Male , 3. Highest Educational Qualification : Diploma holder, 4. Industry : Manufacturing, 5. Residence : Metro
For each of these CART model, following is the distribution across salary bands :
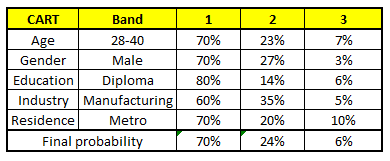
The final probability is simply the average of the probability in the same salary bands in different CART models. As you can see from this analysis, that there is 70% chance of this individual falling in class 1 (less than $40,000) and around 24% chance of the individual falling in class 2.
End Notes
Random forest gives much more accurate predictions when compared to simple CART/CHAID or regression models in many scenarios. These cases generally have high number of predictive variables and huge sample size. This is because it captures the variance of several input variables at the same time and enables high number of observations to participate in the prediction. In some of the coming articles, we will talk more about the algorithm in more detail and talk about how to build a simple random forest on R.
If you like what you just read & want to continue your analytics learning, subscribe to our emails, follow us on twitter or like our facebook page.
Tavish Srivastava, co-founder and Chief Strategy Officer of Analytics Vidhya, is an IIT Madras graduate and a passionate data-science professional with 8+ years of diverse experience in markets including the US, India and Singapore, domains including Digital Acquisitions, Customer Servicing and Customer Management, and industry including Retail Banking, Credit Cards and Insurance. He is fascinated by the idea of artificial intelligence inspired by human intelligence and enjoys every discussion, theory or even movie related to this idea.


Enlightening
Very nice write up. My two cents. A fundamental problem with most empirical research is omitted correlated variables? How can analysts be sure that most (if not all) variables that explain the process are included? Also what happens if we choose subsets of variables and build predictive models? Wonder if we can use machine learning tools to deal with this. LASSO models with variable selection may be better than Random Forests (maybe) guess but again it is still based on the assumption that analysts can provide the entire universe of predictors (which is debatable), especially in the social sciences. Nevertheless, nice post and look forward to more here.
awesome !!! Thanks Man !!!