Have you come across a dataset with hundreds of columns and wondered how to build a predictive model on it? Or have come across a situation where a lot of variables might be correlated? It is difficult to escape these situations while working on real-life problems. Thankfully, dimensionality reduction techniques come to our rescue here. Dimensionality Reduction MCQs is an important technique in artificial intelligence. It is a must-have skill set for any data scientist for data analysis. These questions include topics like Principal Component Analysis (PCA), t-SNE, and LDA.
Check out more challenging competitions coming up here
Table of contents
Helpful Resources
- Beginners Guide To Learn Dimension Reduction Techniques
- Practical Guide to Principal Component Analysis (PCA) in R & Python
- Comprehensive Guide on t-SNE algorithm with implementation in R & Python
- Support Vector Machine (SVM) and Principal Component Analysis Tutorial for Beginners
Are you just getting started with Dimensionality Reduction Techniques? Do you want to learn how to use these techniques to work on real-life projects and improve the model performance? Presenting two comprehensive courses which cover all the important concepts like feature selection and dimensionality reduction-
Dimensionality Reduction MCQs Questions & Answers
Q1. Imagine you have 1000 predictor features and 1 target feature in a machine learning problem.
You have to select the 100 most important features based on the relationship between input features and the target features. Do you think this is an example of dimensionality reduction?
A. Yes
B. No
Solution: (A)
Q2. [True or False] It is not necessary to have a dependent variable for applying dimensionality reduction algorithms.
A. TRUE
B. FALSE
Solution: (A)
Explanation: LDA is an example of an unsupervised dimensionality reduction algorithm.
Q3. I have 4 variables in the dataset such as – A, B, C & D. I have performed the following actions:
Step 1: Using the above variables, I have created two more variables, namely E = A + 3 B and F = B + 5 C + D.
Step 2: Then, using only the variables E and F, I built a Random Forest or decision tree machine learning model.
Could the steps performed above represent a dimensionality reduction method?
A. True
B. False
Solution: (A)
Explanation: Yes, Because Step 1 could be used to represent the data in 2 lower dimensions.
Q4. Which of the following techniques would perform better for reducing the dimensions of a data set?
A. Removing columns that have too many missing values
B. Removing columns that have high variance in data
C. Removing columns with dissimilar data trends
D. None of these
Solution: (A)
Explanation: If columns have too many missing values (say 99%), then we can remove such columns.
Q5. [True or False] Dimensionality reduction algorithms are one of the possible ways to reduce the computation time required to build a model.
A. TRUE
B. FALSE
Solution: (A)
Explanation: Reducing the dimension of data will take less time to train a model.
Q6. Which of the following algorithms cannot be used for reducing the dimensionality of data?
A. t-SNE
B. PCA
C. LDA
D. None of these
Solution: (D)
Explanation: All of the algorithms are examples of dimensionality reduction algorithms.
Q7. [True or False] PCA can be used for projecting and visualizing data in lower dimensions.
A. TRUE
B. FALSE
Solution: (A)
Explanation: Sometimes it is very useful to plot the data in lower dimensions. We can take the first 2 principal components and then use visualization of the data using a scatter plot.
Q8. The most popularly used dimensionality reduction algorithm is Principal Component Analysis (PCA). Which of the following is/are true about PCA?
- PCA is an unsupervised method of optimization
- It searches for the directions that data have the largest variance
- Maximum number of principal components <= number of features
- All principal components are orthogonal to each other
A. 1 and 2
B. 1 and 3
C. 2 and 3
D. 1, 2 and 3
E. 1,2 and 4
F. All of the above
Solution: (F)
Explanation: All options are self-explanatory.
Q9. Suppose we are using dimensionality reduction as pre-processing technique, i.e., instead of using all the features, we reduce the data to k dimensions with PCA.
And then use these PCA projections as our features. Which of the following statement is correct?
A. Higher ‘k’ means more regularization
B. Higher ‘k’ means less regularization
C. Can’t say
Solution: (B)
Explanation: Higher k would lead to less smoothening as we would be able to preserve more characteristics in data, hence less regularization. By increasing regularization, we can avoid overfitting.
Q10. In which of the following scenarios is t-SNE better to use than PCA for dimensionality reduction while working on a local machine with minimal computational power?
A. Dataset with 1 Million entries and 300 features
B. Dataset with 100000 entries and 310 features
C. Dataset with 10,000 entries and 8 features
D. Dataset with 10,000 entries and 200 features
Solution: (C)
Explanation: t-SNE has quadratic time and space complexity. Thus it is a very heavy algorithm in terms of system resource utilization.
Q11. Which of the following statement is true for a t-SNE cost function?
A. It is asymmetric in nature.
B. It is symmetric in nature.
C. It is the same as the cost function for SNE.
Solution: (B)
Explanation: The cost function of SNE is asymmetric in nature. Which makes it difficult to converge using gradient descent. An asymmetric cost function is one of the major differences between SNE and t-SNE.
Q12. Which of the following algorithms would you choose in the scenario given below?
Imagine you are dealing with text data. To represent the words, you are using word embedding (Word2vec). In word embedding, you will end up with 1000 dimensions. Now, you want to reduce the dimensionality of this high-dimensional data such that similar words should have a similar meaning in the nearest neighbor space. In such a case,
A. t-SNE
B. PCA
C. LDA
D. None of these
Solution: (A)
Explanation: t-SNE stands for t-Distributed Stochastic Neighbor Embedding, which considers the nearest neighbors for reducing the data.
Q13. [True or False] t-SNE learns non-parametric mapping.
A. TRUE
B. FALSE
Solution: (A)
Explanation: t-SNE learns a non-parametric mapping, which means that it does not learn an explicit function that maps data from the input space to the map. For more information, refer to this link.
Q14. Which of the following statement is correct for t-SNE and PCA?
A. t-SNE is linear, whereas PCA is non-linear
B. t-SNE and PCA are both linear
C. t-SNE and PCA are both nonlinear
D. t-SNE is nonlinear, whereas PCA is linear
Solution: (D)
Explanation: Option D is correct. Read the explanation from this link
Q15. In the t-SNE algorithm, which of the following hyperparameters can be tuned?
A. Number of dimensions
B. Smooth measure of the effective number of neighbors
C. Maximum number of iterations
D. All of the above
Solution: (D)
Explanation: All of the hyper-parameters in the option can be tuned.
Q16. Which of the following statements is true about t-SNE in comparison to PCA?
A. When the data is huge (in size), t-SNE may fail to produce better results.
B. T-NSE always produces better results regardless of the size of the data
C. PCA always performs better than t-SNE for smaller-sized data.
D. None of these
Solution: (A)
Explanation: Option A is correct
Q17. Xi and Xj are two distinct points in the higher dimension representation, whereas Yi & Yj are the representations of Xi and Xj in a lower dimension.
- The similarity of datapoint Xi to datapoint Xj is the conditional probability p (j|i).
- The similarity of datapoint Yi to datapoint Yj is the conditional probability q (j|i).
Which of the following must be true for a perfect representation of xi and xj in lower dimensional space?
A. p (j|i) = 0 and q (j|i) = 1
B. p (j|i) < q (j|i)
C. p (j|i) = q (j|i)
D. p (j|i) > q (j|i)
Solution: (C)
Explanation: The conditional probabilities related to Bayes’ theorem for the similarity of two points must be equal because the similarity between the points must remain unchanged in both higher and lower dimensions for them to be perfect representations.
Q18. Which of the following is true about LDA?
A. LDA aims to maximize the distance between classes and minimize the within-class distance.
B. LDA aims to minimize both distances between classes and the distance within the class.
C. LDA aims to minimize the distance between classes and maximize the distance within the class.
D. LDA aims to maximize both distances between classes and the distance within the class.
Solution: (A)
Explanation: Option A is correct.
Q19. In which of the following case will LDA fail?
A. If the discriminatory information is not in the mean but in the variance of the data
B. If the discriminatory information is in the mean but not in the variance of the data
C. If the discriminatory information is in the mean and variance of the data
D. None of these
Solution: (A)
Explanation: Option A is correct
Q20. Which of the following comparison(s) are true about PCA and LDA?
- Both LDA and PCA are linear transformation techniques
- LDA uses supervised learning, whereas PCA uses unsupervised learning
- PCA maximizes the variance of the data, whereas LDA maximizes the separation between different classes,
A. 1 and 2
B. 2 and 3
C. 1 and 3
D. Only 3
E. 1, 2, and 3
Solution: (E)
Explanation: All of the options are correct
Q21. What will happen when eigenvalues are roughly equal?
A. PCA will perform outstandingly
B. PCA will perform badly
C. Can’t say
D. None of above
Solution: (B)
Explanation: When all eigenvectors are the same in such case you won’t be able to select the principal components because, in that case, all principal components are equal.
Q22. PCA works better if there is ________
- A linear structure in the data
- If the data lies on a curved surface and not on a flat surface
- If variables are scaled in the same unit
A. 1 and 2
B. 2 and 3
C. 1 and 3
D. 1, 2 and 3
Solution: (C)
Explanation: Option C is correct
Q23. What happens when you get features in lower dimensions using PCA?
- The features will still have interpretability
- The features will lose interpretability
- The features must carry all information present in the data
- The features may not carry all information present in the data
A. 1 and 3
B. 1 and 4
C. 2 and 3
D. 2 and 4
Solution: (D)
Explanation: When you get the features in lower dimensions, then you will lose some information of data most of the time, and you won’t be able to interpret the lower dimension data.
Q24. Imagine you are given the following scatterplot between height and weight.
A. ~ 0 degree
B. ~ 45 degree
C. ~ 60 degree
D. ~ 90 degree
Solution: (B)
Explanation: Option B has the largest possible variance in data.
Q25. Which of the following option(s) is/are true?
- You need to initialize parameters in PCA
- You don’t need to initialize parameters in PCA
- PCA can be trapped in local minima problem
- PCA can’t be trapped in local minima problem
A. 1 and 3
B. 1 and 4
C. 2 and 3
D. 2 and 4
Solution: (D)
Explanation: PCA is a deterministic algorithm that doesn’t have parameters to initialize and doesn’t have a local minima problem like most machine learning algorithms.
Question Context: 26
The below snapshot shows the scatter plot of two features (X1 and X2) with the class information (Red, Blue). You can also see the direction of PCA and LDA.
Q26. Which of the following method would result in better class prediction?
A. Building a classification algorithm with PCA (A principal component in the direction of PCA)
B. Building a classification algorithm with LDA
C. Can’t say
D. None of these
Solution: (B)
Explanation: If our goal is to classify these points, PCA projection does only more harm than good—the majority of blue and red points would land overlapped on the first principal component. hence PCA would confuse the classifier.
Q27. Which of the following options is correct when you are applying PCA on an image dataset?
- It can be used to effectively detect deformable objects.
- It is invariant to affine transforms.
- It can be used for lossy image compression.
- It is not invariant to shadows.
A. 1 and 2
B. 2 and 3
C. 3 and 4
D. 1 and 4
Solution: (C)
Explanation: Option C is correct
Q28. Under which condition do SVD and PCA produce the same projection result?
A. When data has zero median
B. When data has zero mean
C. Both are always the same
D. None of these
Solution: (B)
Explanation: When the data has a zero mean vector, otherwise, you have to center the data first before taking SVD.
Question Context: 29 – 31
Consider 3 data points in the 2-d space: (-1, -1), (0,0), (1,1).

Q29. What will be the first principal component of this data?
- [ √ 2 /2, √ 2/ 2 ]
- (1/ √ 3, 1/ √ 3)
- ([ -√ 2/ 2, √ 2/ 2 ])
- (- 1/ √ 3, – 1/ √ 3)
A. 1 and 2
B. 3 and 4
C. 1 and 3
D. 2 and 4
Solution: (C)
Explanation: The first principal component is v = [ √ 2 /2, √ 2/ 2 ] T (you shouldn’t really need to solve any SVD or eigenproblem to see this). Note that we should apply normalization to the principal component to have unit length. (The negation v = [− √ 2/ 2, − √ 2/ 2 ] T is also correct.)
Q30. If we project the original data points into the 1-d subspace by the principal component [ √ 2 /2, √ 2 /2 ] T.
What are their coordinates in the 1-d subspace?
A. (− √ 2 ), (0), (√ 2)
B. (√ 2 ), (0), (√ 2)
C. ( √ 2 ), (0), (-√ 2)
D. (-√ 2 ), (0), (-√ 2)
Solution: (A)
Explanation: The coordinates of three points after projection should be z1 = x T 1 v = [−1, −1][ √ 2/ 2, √ 2 /2 ] T = − √ 2, z2 = x T 2 v = 0, z3 = x T 3 v = √ 2.
Q31. What is the reconstruction error in the following scenario?
For the projected data, you just obtained projections ( (− √ 2 ), (0), (√ 2) ). We then represent them in the original 2-d space and consider them as the reconstruction of the original data points.
A. 0%
B. 10%
C. 30%
D. 40%
Solution: (A)
Explanation: The reconstruction error is 0 since all three points are perfectly located in the direction of the first principal component. Or, you can actually calculate the reconstruction: z1 ·v.
xˆ1 = − √ 2·[ √ 2/ 2 , √ 2/2 ] T = [−1, −1]T
xˆ2 = 0*[0, 0]T = [0,0] xˆ3 = √ 2* [1, 1]T = [1,1]
which are exactly x1, x2, x3.
Q32. In LDA, the idea is to find the line that best separates the two classes. In the given image, which of the following is a good projection?

A. LD1
B. LD2
C. Both
D. None of these
Solution: (A)
Explanation: LD1 Is a good projection because it best separates the class.
Question Context: 33
PCA is a good technique to try because it is simple to understand and is commonly used to reduce the dimensionality of the data. Obtain the eigenvalues λ1 ≥ λ2 ≥ • • • ≥ λN and plot.
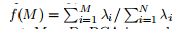
To see how f(M) increases with M and takes the maximum value 1 at M = D. We have two graphs given below:

Q33. Which of the above graph shows better performance of PCA? Where M is the first M principal component, and D is the total number of features?
A. Left
B. Right
C. Any of A and B
D. None of these
Solution: (A)
Explanation: PCA is good if f(M) asymptotes rapidly to 1. This happens if the first eigenvalues are big and the remainder is small. PCA is bad if all the eigenvalues are roughly equal. See examples of both cases in the figure.
Q34. Which of the following option is true?
A. LDA explicitly attempts to model the difference between the classes of data. On the other hand, PCA does not consider any difference in class.
B. Both attempt to model the difference between the classes of data.
C. PCA explicitly attempts to model the difference between the classes of data. LDA, on the other hand, does not consider any difference in class.
D. Both don’t attempt to model the difference between the classes of data.
Solution: (A)
Explanation: Options are self-explanatory.
Q35. Which of the following can be the first 2 principal components after applying PCA?
- (0.5, 0.5, 0.5, 0.5) and (0.71, 0.71, 0, 0)
- (0.5, 0.5, 0.5, 0.5) and (0, 0, -0.71, -0.71)
- (0.5, 0.5, 0.5, 0.5) and (0.5, 0.5, -0.5, -0.5)
- (0.5, 0.5, 0.5, 0.5) and (-0.5, -0.5, 0.5, 0.5)
A. 1 and 2
B. 1 and 3
C. 2 and 4
D. 3 and 4
Solution: (D)
Explanation: The two loading vectors are not orthogonal for the first two choices.
Q36. Which of the following gives the difference(s) between the logistic regression and LDA?
- If the classes are well separated, the parameter estimates for logistic regression can be unstable.
- If the sample size is small and the distribution of features is normal for each class. In such cases, linear discriminant analysis is more stable than logistic regression.
A. 1
B. 2
C. 1 and 2
D. None of these
Solution: (C)
Explanation: Refer to this video
Q37. Which of the following offset do we consider in PCA?
A. Vertical offset
B. Perpendicular offset
C. Both
D. None of these
Solution: (B)
Explanation: We always consider residuals as vertical offsets. Perpendicular offsets are useful in the case of PCA.
Q38. Imagine you are dealing with 10 class classification problem, and you want to know at most how many discriminant vectors can be produced by LDA. What is the correct answer?
A. 20
B. 9
C. 21
D. 11
E. 10
Solution: (B)
Explanation: LDA produces, at most c − 1 discriminant vector. You may refer to this link for more information.
Question Context: 39
The given dataset consists of images of the “Hoover Tower” and some other towers. Now, you want to use PCA (Eigenface) and the nearest neighbor method to build a classifier that predicts whether a new image depicts a “Hoover tower” or not. The figure gives a sample of your input training dataset images.
Q39. In order to get reasonable performance from the “Eigenface” algorithm, what pre-processing steps will be required on these images?
- Align the towers in the same position in the image.
- Scale or crop all images to the same size.
A. 1
B. 2
C. 1 and 2
D. None of these
Solution: (C)
Explanation: Both statements are correct.
Q40. What is the optimum number of principal components in the below figure?

A. 7
B. 30
C. 40
D. Can’t Say
Solution: (B)
Explanation: We can see in the above figure that the number of components = 30 is giving highest variance with the lowest number of components. Hence option ‘B’ is the right answer.
Bonus Content: Top 3 Dimensionality Reduction Interview Questions
Q1. Can we use deep learning for dimensionality reduction?
A. Yes, we can use a type of neural network called autoencoder with an activation function for dimensionality reduction.
Q2. What are the three main methods of reducing dimensionality?
A. Principle Component Analysis, Linear Discriminant Analysis, and T-distributed Stochastic Neighbor Embedding are three examples of dimensionality reduction.
Q3. What is the application of dimensional reduction regarding big data?
A. It can be used in data mining of big data so that we can easily use various learning techniques on the resultant data.
Conclusion
As you dive deeper into dimensionality reduction techniques, it’s important to understand their practical applications and limitations. Whether you are using PCA for linear transformations, t-SNE for visualizing high-dimensional data, or LDA for classification tasks, these methods play a crucial role in optimizing models and reducing computational complexity.
Ankit is currently working as a data scientist at UBS who has solved complex data mining problems in many domains. He is eager to learn more about data science and machine learning algorithms.


Hi, I think the answers and explanations of questions 10 and 11 are not in sync. Please revisit and correct.
Hi Pratima, Thanks for noticing! I change the explanation of question number 10 which was addressing some other issue. Answers for questions 10 and 11 are remain same Best Regards, Ankit Gupta
Hi , could it be that in question 33 solution and explanation are contradicting or did I get it wrong?
Hi Marvin, Explanation is correct but solution was incorrectly marked. Thanks for noticing Best! Ankit Gupta
[…] 查看原文>>> […]