Introduction
Brevity is the soul of wit
This powerful quote by William Shakespeare applies well to techniques used in data science & analytics as well. Intrigued ? Allow me to prove it using a short story.
In May ‘ 2015, we conducted a Data Hackathon ( a data science competition) in Delhi-NCR, India.

We gave participants the challenge to identify Human Activity Recognition Using Smartphones Data Set. The data set had 561 variables for training model used for the identification of Human activity in test data set.
The participants in hackathon had varied experience and expertise level. As expected, the experts did a commendable job at identifying the human activity. However, beginners & intermediates struggled with sheer number of variables in the dataset (561 variables). Under the pressure of time, these people tried using variables really without understanding the significance level of variable(s). They lacked the skill to filter information from seemingly high dimensional problems and reduce them to a few relevant dimensions – the skill of dimensionality reduction.
Further, this lack of skill came across in several forms in way of questions asked by various participants:
- There are too many variables – do I need to explore each and every variable?
- Are all variables important?
- All variables are numeric and what if they have multi-collinearity? How can I identify these variables?
- I want to use decision tree. It can automatically select the right variables. Is this a right technique?
- I am using random forest but it is taking a high execution time because of high number of features
- Is there any machine learning algorithm that can identify the most significant variables automatically?
- As this is a classification problem, can I use SVM with all variables?
- Which is the best tool to deal with high number of variable, R or Python?
If you’ve come across similar questions, this article is for you. Here, we’ll explore different ways to find important factors using common methods that reduce the complexity of data, known as dimensionality reduction and dimension reduction.
Table of contents
- Introduction
- What is Dimensionality Reduction?
- Why Dimension Reduction is important in machine learning & predictive modeling?
- What are Dimension Reduction techniques?
- What are the benefits of Dimension Reduction?
- What are the common methods to perform Dimension Reduction?
- Is Dimension Reduction Good or Bad?
- End Note
What is Dimensionality Reduction?
Dimensionality reduction is a technique used in machine learning and data analysis to reduce the number of features or variables under consideration. The aim is to simplify the dataset while retaining as much relevant information as possible. This is particularly useful when dealing with high-dimensional data, where the number of features is large compared to the number of samples.
There are various methods for dimensionality reduction, including:
- Feature selection: Selecting a subset of the original features based on specific criteria such as relevance, importance, or correlation.
- Feature extraction: Transforming the original features into a lower-dimensional space using techniques like principal component analysis (PCA), linear discriminant analysis (LDA), or t-distributed stochastic neighbor embedding (t-SNE). These methods aim to preserve the most important information while reducing the dimensionality.
By reducing dimensionality, dimensionality reduction techniques can help improve computational efficiency, mitigate the curse of dimensionality, and often lead to better performance in machine learning tasks such as classification, clustering, and visualization.
Why Dimension Reduction is important in machine learning & predictive modeling?
The problem of unwanted increase in dimension is closely related to fixation of measuring / recording data at a far granular level then it was done in past. This is no way suggesting that this is a recent problem. It has started gaining more importance lately due to surge in data.
Lately, there has been a tremendous increase in the way sensors are being used in the industry. These sensors continuously record data and store it for analysis at a later point. In the way data gets captured, there can be a lot of redundancy. For example, let us take case of a motorbike rider in racing competitions. Today, his position and movement gets measured by GPS sensor on bike, gyro meters, multiple video feeds and his smart watch. Because of respective errors in recording, the data would not be exactly same. However, there is very little incremental information on position gained from putting these additional sources. Now assume that an analyst sits with all this data to analyze the racing strategy of the biker – he/ she would have a lot of variables / dimensions which are similar and of little (or no) incremental value. This is the problem of high unwanted dimensions and needs a treatment of dimension reduction.
Examples for Dimensionality Reduction
Let’s look at other examples of new ways of data collection:
- Casinos are capturing data using cameras and tracking each and every move of their customers.
- Political parties are capturing data by expanding their reach on field
- Your smart phone apps collects a lot of personal details about you
- Your set top box collects data about which programs preferences and timings
- Organizations are evaluating their brand value by social media engagements (comments, likes), followers, positive and negative sentiments
With more variables, comes more trouble! And to avoid this trouble, dimension reduction techniques comes to the rescue.

What are Dimension Reduction techniques?
Dimension Reduction refers to the process of converting a set of data having vast dimensions into data with lesser dimensions ensuring that it conveys similar information concisely. These techniques are typically used while solving machine learning problems to obtain better features for a classification or regression task.
Let’s look at the image shown below. It shows 2 dimensions x1 and x2, which are let us say measurements of several object in cm (x1) and inches (x2). Now, if you were to use both these dimensions in machine learning, they will convey similar information and introduce a lot of noise in system, so you are better of just using one dimension. Here we have converted the dimension of data from 2D (from x1 and x2) to 1D (z1), which has made the data relatively easier to explain.
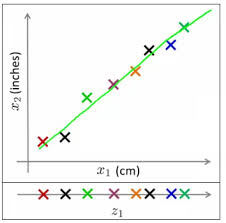
In similar ways, we can reduce n dimensions of data set to k dimensions (k < n) . These k dimensions can be directly identified (filtered) or can be a combination of dimensions (weighted averages of dimensions) or new dimension(s) that represent existing multiple dimensions well.
One of the most common application of this technique is Image processing. You might have come across this Facebook application – “Which Celebrity Do You Look Like?“. But, have you ever thought about the algorithm used behind this?
Here’s the answer: To identify the matched celebrity image, we use pixel data and each pixel is equivalent to one dimension. In every image, there are high number of pixels i.e. high number of dimensions. And every dimension is important here. You can’t omit dimensions randomly to make better sense of your overall data set. In such cases, dimension reduction techniques help you to find the significant dimension(s) using various method(s). We’ll discuss these methods shortly.
What are the benefits of Dimension Reduction?
Let’s look at the benefits of applying Dimension Reduction process:
- It helps in data compressing and reducing the storage space required
- It fastens the time required for performing same computations. Less dimensions leads to less computing, also less dimensions can allow usage of algorithms unfit for a large number of dimensions
- It takes care of multi-collinearity that improves the model performance. It removes redundant features. For example: there is no point in storing a value in two different units (meters and inches).
- Reducing the dimensions of data to 2D or 3D may allow us to plot and visualize it precisely. You can then observe patterns more clearly. Below you can see that, how a 3D data is converted into 2D. First it has identified the 2D plane then represented the points on these two new axis z1 and z2.
![Image [4]](https://www.analyticsvidhya.com/wp-content/uploads/2015/07/Image-4.png)
- It is helpful in noise removal also and as result of that we can improve the performance of models.
What are the common methods to perform Dimension Reduction?
There are many methods to perform Dimension reduction. I have listed the most common methods below:
1. Missing Values: While exploring data, if we encounter missing values, what we do? Our first step should be to identify the reason then impute missing values/ drop variables using appropriate methods. But, what if we have too many missing values? Should we impute missing values or drop the variables?
I would prefer the latter, because it would not have lot more details about data set. Also, it would not help in improving the power of model. Next question, is there any threshold of missing values for dropping a variable? It varies from case to case. If the information contained in the variable is not that much, you can drop the variable if it has more than ~40-50% missing values.
2. Low Variance: Let’s think of a scenario where we have a constant variable (all observations have same value, 5) in our data set. Do you think, it can improve the power of model? Ofcourse NOT, because it has zero variance. In case of high number of dimensions, we should drop variables having low variance compared to others because these variables will not explain the variation in target variables.
3. Decision Trees: It is one of my favorite techniques. It can be used as a ultimate solution to tackle multiple challenges like missing values, outliers and identifying significant variables. It worked well in our Data Hackathon also. Several data scientists used decision tree and it worked well for them.
4. Random Forest: Similar to decision tree is Random Forest. I would also recommend using the in-built feature importance provided by random forests to select a smaller subset of input features. Just be careful that random forests have a tendency to bias towards variables that have more no. of distinct values i.e. favor numeric variables over binary/categorical values.
5. High Correlation: Dimensions exhibiting higher correlation can lower down the performance of model. Moreover, it is not good to have multiple variables of similar information or variation also known as “Multicollinearity”. You can use Pearson (continuous variables) or Polychoric (discrete variables) correlation matrix to identify the variables with high correlation and select one of them using VIF (Variance Inflation Factor). Variables having higher value ( VIF > 5 ) can be dropped.
6. Backward Feature Elimination: In this method, we start with all n dimensions. Compute the sum of square of error (SSR) after eliminating each variable (n times). Then, identifying variables whose removal has produced the smallest increase in the SSR and removing it finally, leaving us with n-1 input features.
Repeat this process until no other variables can be dropped. Recently in Online Hackathon organised by Analytics Vidhya (11-12 Jun’15), Data scientist who held second position used Backward Feature Elimination in linear regression to train his model.
Reverse to this, we can use “Forward Feature Selection” method. In this method, we select one variable and analyse the performance of model by adding another variable. Here, selection of variable is based on higher improvement in model performance.
7. Factor Analysis: Let’s say some variables are highly correlated. These variables can be grouped by their correlations i.e. all variables in a particular group can be highly correlated among themselves but have low correlation with variables of other group(s). Here each group represents a single underlying construct or factor. These factors are small in number as compared to large number of dimensions. However, these factors are difficult to observe. There are basically two methods of performing factor analysis:
- EFA (Exploratory Factor Analysis)
- CFA (Confirmatory Factor Analysis)
8. Principal Component Analysis (PCA): In this technique, variables are transformed into a new set of variables, which are linear combination of original variables. These new set of variables are known as principle components. They are obtained in such a way that first principle component accounts for most of the possible variation of original data after which each succeeding component has the highest possible variance.
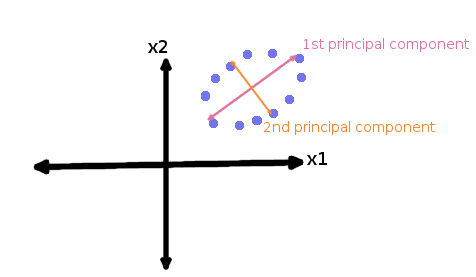
The second principal component must be orthogonal to the first principal component. In other words, it does its best to capture the variance in the data that is not captured by the first principal component. For two-dimensional dataset, there can be only two principal components. Below is a snapshot of the data and its first and second principal components. You can notice that second principle component is orthogonal to first principle component.The principal components are sensitive to the scale of measurement, now to fix this issue we should always standardize variables before applying PCA. Applying PCA to your data set loses its meaning. If interpretability of the results is important for your analysis, PCA is not the right technique for your project.
Components of Dimensionality Reduction
Here are three main points on Dimensionality Reduction techniques:
- Feature Selection: This involves choosing a subset of the original features based on criteria like relevance or importance, effectively reducing the dimensionality of the dataset. Common methods include filtering features by their statistical properties or using techniques like Recursive Feature Elimination (RFE).
- Feature Extraction: Feature extraction transforms the original features into a lower-dimensional space while retaining as much relevant information as possible. Techniques like Principal Component Analysis (PCA) and Linear Discriminant Analysis (LDA) are widely used for this purpose.
- Manifold Learning: Manifold learning techniques capture the underlying structure of the data by representing it in a lower-dimensional space. Methods like t-Distributed Stochastic Neighbor Embedding (t-SNE) and Isomap are particularly useful for visualizing high-dimensional data or capturing nonlinear relationships between variables
Is Dimension Reduction Good or Bad?
Recently, we received this question on our data science forum. Here’s the complete answer.
End Note
In this article, we looked at the simplified version of Dimensionality Reduction covering its importance, benefits, the commonly methods and the discretion as to when to choose a particular technique. In future post, I would write about the PCA and Factor analysis in more detail.
Did you find the article useful? Do let us know your thoughts about this article in the comment box below. I would also want to know which dimension reduction technique you use most and why?
If you like what you just read & want to continue your analytics learning, subscribe to our emails, follow us on twitter or like our facebook page.
Sunil Ray is Chief Content Officer at Analytics Vidhya, India's largest Analytics community. I am deeply passionate about understanding and explaining concepts from first principles. In my current role, I am responsible for creating top notch content for Analytics Vidhya including its courses, conferences, blogs and Competitions.
I thrive in fast paced environment and love building and scaling products which unleash huge value for customers using data and technology. Over the last 6 years, I have built the content team and created multiple data products at Analytics Vidhya.
Prior to Analytics Vidhya, I have 7+ years of experience working with several insurance companies like Max Life, Max Bupa, Birla Sun Life & Aviva Life Insurance in different data roles.
Industry exposure: Insurance, and EdTech
Major capabilities: Content Development, Product Management, Analytics, Growth Strategy.


Hi Sunil, Thanks a lot for this article. This definitely is very informative and a good lesson for me. I want to apply these techniques for this dataset(Human Activity recognition UCI data). Is there any pointer for examples on this techniques to reduce dimensions? However, thanks a lot for this great knowledge document. Gita
Very informative :) I work for a telecom firm and i am interested if there are any case studies or other materials which can explain me some helpful aspects using Predictive analytics in telecom industry. Your suggestions will be very much helpful, thanks in advance :)
Hemanth, Thanks for following us! You can look refer these resources for Telecom domain: - http://bigdata-madesimple.com/11-interesting-big-data-case-studies-in-telecom/ - http://birtanalytics.actuate.com/telecom-analytics - http://bigdata-madesimple.com/11-interesting-big-data-case-studies-in-telecom/ Regards, Sunil
Hi! Thanks for this interesting article. I found the introduction a very accessible way to motivate the use of Dimensionality Reduction techniques. One thing, though. You say: "Now assume that an analyst sits with all this data to analyze the racing strategy of the biker – he would have a lot of variables / dimensions which are similar and of little (or no) incremental value". Why did you assume that the analyst is male?
Hi Barbara, Thanks for highlighting the error! have updated it. Regards, Sunil