Overview
- Presenting 10 powerful and innovative Python tricks and tips for data science
- This list of Python tricks contains use cases from our daily data science tasks, such as data pre-processing, data analysis, visualization, among other things
- Any Python package or function we missed out on? Let us know!
Introduction
When was the last time you learned a new Python trick? As data scientists, we are accustomed to working with familiar libraries and calling the same functions every time. It’s time to break the old routine!
Python isn’t just limited to Pandas, NumPy and scikit-learn (though they are absolutely essential in data science)! There is a whole world of Python tricks we can use to improve our code, speed up our data science tasks, and become much more efficient in writing code.
And more importantly – learning new things we can do in Python is simply a whole lot of fun! I love playing around with different packages and functions. And every once in a while, a new trick will catch my eye and I incorporate that into my daily routine.

So I decided to collate my favorite Python tricks in one place – this article! This list ranges from speeding up basic data science tasks like pre-processing to getting R and Python code in the same Jupyter Notebook. There’s a whole lot of learning waiting for us so let’s dive right in!
New to Python and the world of Data Science? Here is a superb and utterly comprehensive course to get you started with both:
1. zip: Combine Multiple Lists in Python
Quite often we end up writing complex for loops to combine more than one list together. Sounds familiar? Then you’ll love the zip function. The purpose of this zip function is to “make an iterator that aggregates elements from each of the iterables”.
Let’s see how to use the zip function via a simple example and combine multiple lists:
# Combining multiple lists using zip function

list1 = ['Analytics', 'Data', 'Data', 'Statistics']
list2 = ['Vidhya', 'Science', 'Hack', 'and']
list3 = ['Community', 'Trend', 'Summit 2019', 'Probability']

for w1, w2, w3 in zip(list1,list2,list3) :
    print(w1,w2,w3)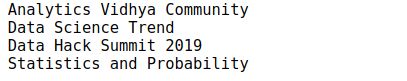
That’s it! See how easy it is to combine multiple lists?
2. gmplot: Plot the GPS Coordinates in your Dataset on Google Maps
I love working with Google Maps data. Think about it – it is one of the most data-rich applications you’ll find anywhere. That’s why I decided to start off with this Python trick.
Scatterplots are excellent when we want to see the relationship between two variables. But will you use them if the variables are the latitude and longitude coordinates of a location? Probably not. It would be best to plot these points on a real map so that we can easily visualize and solve a particular problem (such as optimizing routes).
gmplot provides an amazing interface to generate HTML and JavaScript to render all the data we’d like on top of Google Maps. Let’s see how to use gmplot with an example.
Installing gmplot
!pip3 install gmplot
Plot the location coordinates on Google Maps
You can download the dataset for this code here. Right, let’s import the libraries and read the data:

The above code will generate the HTML file and you can see that latitude and longitude coordinates are plotted on Google Maps. The heatmap shows the areas with a high density of points in red color. Pretty cool, right?
3. category_encoders: Encode your Categorical Variables using 15 Different Encoding Schemes
One of the biggest obstacles we face in early-stage data science datasets – what in the world should we do about categorical variables? Our machines crunch numbers in the blink of an eye but dealing with categories is a whole different problem.
A few Machine Learning algorithms can handle categorical variables on their own. But we are required to convert them into numerical variables and for this, category_encoders is an amazing library that provides 15 different encoding schemes.
Let’s see how can we make use of this library.
Installing category-encoders
!pip3 install category-encoders
Transform the categorical data into numerical data

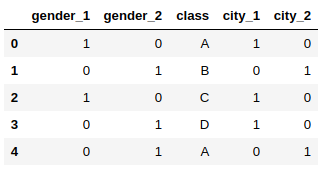
category_encoders supports around 15 different encoding methods, such as:
- Hashing Encoding
- LeaveOneOut Encoding
- Ordinal Encoding
- Binary Encoding
- Target Encoding
All the encoders are fully compatible with sklearn-transformers so they can easily be used in your existing scripts. Also, category_encoders supports NumPy arrays and Pandas dataframes. You can read more about category_encoders here.
4. progress_apply: Monitor the Time you Spend on Data Science Tasks
How much time do you typically spend on cleaning and pre-processing your data? The saying that a data scientist typically spends 60-70% of his/her time just cleaning the data is quite true. And it’s important for us to track this, right?
We don’t want to spend days and days cleaning the data and neglecting the other data science steps. This is where the progress_apply function makes our life so much easier. Let me demonstrate how it works.
Let’s calculate the distance of all the points from a particular point and see the progress of completion of this task. You can download the dataset for this here.
You can see how easy is to track the progress of our code. Simple, efficient and a lifesaver.
5. pandas_profiling: Generate a Detailed Report of your Dataset
We spend a LOT of our time in understanding the data we’ve been given. And that’s fair – we don’t want to jump straight to model building without understanding what we’re working with. This is an essential step in any data science project.
pandas_profiling is a Python package that reduces a lot of effort in doing the initial data analysis steps. This package generates a detailed report of our data in just one line of code!
We can see that with just one line of code, we got a detailed report of the dataset:
- Warnings like: Item_Identifier has a high cardinality: 1559 distinct values Warning
- Frequency Count of all categorical variables
- Quantile and Descriptive statistics of numerical variables
- Correlation Plot
6. grouper: Grouping Time Series Data
Who isn’t familiar with Pandas at this point? It is one of the most popular Python libraries around and is widely used for data manipulation and analysis. We know that Pandas has amazing capabilities to manipulate and summarize the data.
I was recently working on a time series problem and noticed that Pandas had a Grouper function that I had never used before. I became really curious about its use (the data scientist curse!).
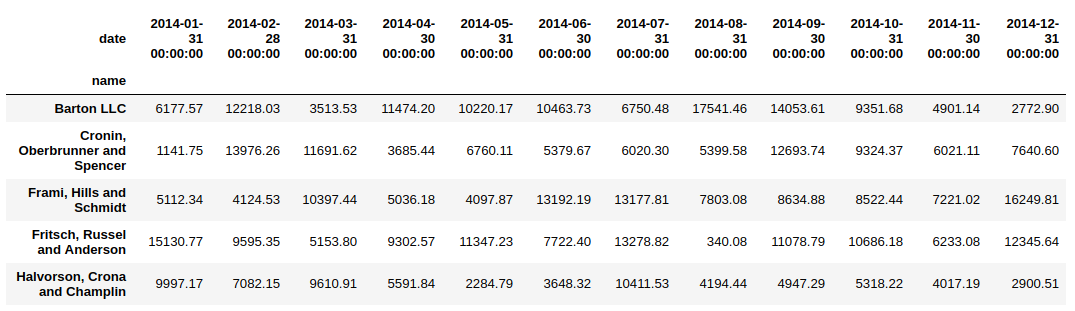
As it turns out, this Grouper function is quite an important function for time series data analysis. So, let’s try this out and see how it works. You can download the dataset for this code here.

Now, the first step to deal with any time series data is to convert the date column into a DateTime format:
Suppose our objective is to see the monthly sales for each customer. Most of us try to write something complex here. But this is where Pandas has something more useful for us (got to love Pandas!).

Instead of having to play around with reindexing, we can use a simple approach via the groupby syntax. We’ll add something extra to this function by providing a little more information on how to group the data in the date column. It looks cleaner and works in exactly the same way:
7. unstack: Transform the Index into Columns of your Dataframe
We just saw how grouper can be helpful in grouping time series data. Now, here’s a challenge – what if we want to see the name column (which is the index in the above example) as the column of our dataframe.
This is where the unstack function becomes vital. Let’s apply the unstack function on the above code sample and see the results.
Quite useful! Note: If the index is not a MultiIndex, the output will be a Series.
8. %matplotlib Notebook: Interactive Plots in your Jupyter Notebook
I’m a big fan of the matplotlib library. It is the most common visualization library that we use to generate all kinds of plots in our Jupyter Notebooks.
To view these plots, we generally use one line – %matplotlib inline – while importing the matplotlib library. This works well but it renders the static plots within the Jupyter Notebook.
Just replace the line %matplotlib inline with %matplotlib notebook and watch the magic unfold. You will get resizable and zoomable plots within your notebook!
Brilliant! With just one word change, we can get interactive plots that allow us to resize and zoom within the plots.
9. %%time: Check the Running Time of a Particular Block of Python Code
There can be multiple approaches to solve one problem. We know this pretty well as data scientists. Computational costs matter in the industry – especially if it’s a small or medium-sized organization. You might want to choose the best approach which completes the task in the minimum amount of time.
It’s actually very easy to check the running time of a particular block of code in your Jupyter notebook.
Just add the %%time command to check the running time of a particular cell:
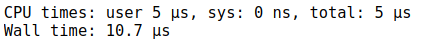
Here, we have the CPU time and the Wall time. The CPU time is the total execution time or runtime for which the CPU was dedicated to a process. Wall time is the time that a clock would have measured as having elapsed between the start of the process and ‘now’.
10: rpy2: R and Python in the Same Jupyter Notebook!
R and Python are two of the best and most popular open-source programming languages in the data science world. R is mainly used for statistical analysis while Python provides an easy interface to translate mathematical solutions into code.
Here’s the good news – we can use both of them in a single Jupyter Notebook! We can make use of both ecosystems and for that, we just need to install rpy2.
So, let’s shelve the R versus Python debate for now and enjoy plotting ggplot-level charts in our Jupyter Notebook.
!pip3 install rpy2
We can use both the languages together, and even pass variables between them.

Here, we created a dataframe df in Python and used that to create a scatterplot using R’s ggplot2 library (the function geom_point). Go ahead and try this out – you’re sure to love it.
End Notes
This is my essential Python tricks collection. I love using these packages and functions in my day-to-day tasks. Honestly, my productivity has increased and it’s made working in Python more fun than ever before.
Are there any Python tricks you want me to know apart from these? Let me know in the comments section below and we’ll trade ideas!
And if you’re a Python beginner and a newcomer in data science, you really should check out our comprehensive and best-selling course:
Ideas have always excited me. The fact that we could dream of something and bring it to reality fascinates me. Computer Science provides me a window to do exactly that. I love programming and use it to solve problems and a beginner in the field of Data Science.


Just Awesome post.
Awesome
Hi! Thank you for this post, I love it! I wanted to try out the pandas_profiling but I faced up a problem during the installation process. When I try to install it in console (pip install pandas_profiling) I get the following error and the installation process stops: ERROR: "Cannot uninstall 'llvmlite'. It is a distutils installed project and thus we cannot accurately determine which files belong to it which would lead to only a partial uninstall." I couldn't uninstall that package either. I'm still a beginner so this may be a trivial problem, but I would really appreciate help on it. Thanks!
are u using ubuntu or windows ? either u try with adding version of python ur using after the pip As like ---->pip3 install pandas_profiling