The Ultimate Guide to K-Means Clustering: Definition, Methods and Applications
K-means clustering, originating from signal processing, is a technique in vector quantization. Its objective is to divide a set of n observations into k clusters, with each observation assigned to the cluster whose mean (cluster center or centroid) is closest, thereby acting as a representative of that cluster.
I love working on recommendation engines. Whenever I encounter any recommendation engine on a website, I can’t wait to break it down and understand how it works. It’s one of the many great things about being a data scientist! Artificial Intelligence has revolutionized how we approach data analysis and has led to the development of powerful algorithms such as k-means clustering. K-means clustering, a part of the unsupervised learning family in AI, is used to group similar data points together in a process known as clustering. Clustering helps us understand our data in a unique way – by grouping things together into – you guessed it – clusters.
In this article, we will cover k-means clustering one of the most commonly used clustering methods) and its components comprehensively. We’ll look at clustering, why it matters, and its applications before diving deep into k-means clustering (including how to perform it in Python on a real-world dataset).

Learning Objectives
- Get introduced to K-Means Clustering.
- Understand the properties of clusters and the various evaluation metrics for clustering.
- Get acquainted with some of the many real-world applications of K-Means Clustering.
- Implement K-Means Clustering in Python on a real-world dataset.
And if you want to work directly on the Python code, jump straight here. We have a live coding window where you can build your own k-means clustering algorithm without leaving this article!
To learn more about clustering and other machine learning algorithms (both supervised and unsupervised) check out the following courses-
- Machine Learning Certification Course for Beginners
- Applied Machine Learning Course
- Certified AI & ML Blackbelt+ Program
Table of contents
- What Is K-Means Clustering?
- How K-Means Clustering Works?
- What is Clustering?
- How is Clustering an Unsupervised Learning Problem?
- Properties of K means Clustering
- Applications of Clustering in Real-World Scenarios
- Understanding the Different Evaluation Metrics for Clustering
- How to Apply K-Means Clustering Algorithm?
- Implementing K-Means Clustering in Python From Scratch
- Challenges With the K-Means Clustering Algorithm And
- K-Means++ to Choose Initial Cluster Centroids for K-Means Clustering
- How to Choose the Right Number of Clusters in K-Means Clustering?
- Implementing K-Means Clustering in Python
- Conclusion
- Frequently Asked Questions
What Is K-Means Clustering?
K-means clustering is a popular unsupervised machine learning algorithm used for partitioning a dataset into a pre-defined number of clusters. The goal is to group similar data points together and discover underlying patterns or structures within the data.
Recall the first property of clusters – it states that the points within a cluster should be similar to each other. So, our aim here is to minimize the distance between the points within a cluster.
There is an algorithm that tries to minimize the distance of the points in a cluster with their centroid – the k-means clustering technique.
K-means is a centroid-based algorithm or a distance-based algorithm, where we calculate the distances to assign a point to a cluster. In K-Means, each cluster is associated with a centroid.
The main objective of the K-Means algorithm is to minimize the sum of distances between the points and their respective cluster centroid.
Optimization plays a crucial role in the k-means clustering algorithm. The goal of the optimization process is to find the best set of centroids that minimizes the sum of squared distances between each data point and its closest centroid. T
How K-Means Clustering Works?
Here’s how it works:
- Initialization: Start by randomly selecting K points from the dataset. These points will act as the initial cluster centroids.
- Assignment: For each data point in the dataset, calculate the distance between that point and each of the K centroids. Assign the data point to the cluster whose centroid is closest to it. This step effectively forms K clusters.
- Update centroids: Once all data points have been assigned to clusters, recalculate the centroids of the clusters by taking the mean of all data points assigned to each cluster.
- Repeat: Repeat steps 2 and 3 until convergence. Convergence occurs when the centroids no longer change significantly or when a specified number of iterations is reached.
- Final Result: Once convergence is achieved, the algorithm outputs the final cluster centroids and the assignment of each data point to a cluster.
What is Clustering?
Cluster analysis is a technique used in data mining and machine learning to group similar objects into clusters. K-means clustering is a widely used method for cluster analysis where the aim is to partition a set of objects into K clusters in such a way that the sum of the squared distances between the objects and their assigned cluster mean is minimized.
Hierarchical clustering and k-means clustering are two popular techniques in the field of unsupervised learning used for clustering data points into distinct groups. While k-means clustering divides data into a predefined number of clusters, hierarchical clustering creates a hierarchical tree-like structure to represent the relationships between the clusters.
Example
Let’s try understanding this with a simple example. A bank wants to give credit card offers to its customers. Currently, they look at the details of each customer and, based on this information, decide which offer should be given to which customer.
Now, the bank can potentially have millions of customers. Does it make sense to look at the details of each customer separately and then make a decision? Certainly not! It is a manual process and will take a huge amount of time.
So what can the bank do? One option is to segment its customers into different groups. For instance, the bank can group the customers based on their income:
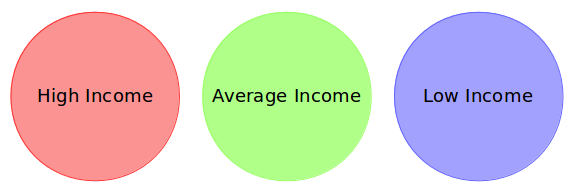
Can you see where I’m going with this? The bank can now make three different strategies or offers, one for each group. Here, instead of creating different strategies for individual customers, they only have to make 3 strategies. This will reduce the effort as well as the time.
The groups I have shown above are known as clusters, and the process of creating these groups is known as clustering. Formally, we can say that:
Clustering is the process of dividing the entire data into groups (also known as clusters) based on the patterns in the data.
Can you guess which type of learning problem clustering is? Is it a supervised or unsupervised learning problem?
Think about it for a moment and use the example we just saw. Got it? Clustering is an unsupervised learning problem!
How is Clustering an Unsupervised Learning Problem?
Let’s say you are working on a project where you need to predict the sales of a big mart:
![regression clustering [k-means clustering]](https://cdn.analyticsvidhya.com/wp-content/uploads/2019/08/Screenshot-from-2019-08-07-16-25-31.png)
Or, a project where your task is to predict whether a loan will be approved or not:
![classification clustering [k-means clustering]](https://cdn.analyticsvidhya.com/wp-content/uploads/2019/08/Screenshot-from-2019-08-07-16-29-45.png)
We have a fixed target to predict in both of these situations. In the sales prediction problem, we have to predict the Item_Outlet_Sales based on outlet_size, outlet_location_type, etc., and in the loan approval problem, we have to predict the Loan_Status depending on the Gender, marital status, the income of the customers, etc.
So, when we have a target variable to predict based on a given set of predictors or independent variables, such problems are called supervised learning problems.
Now, there might be situations where we do not have any target variable to predict.
Such problems, without any fixed target variable, are known as unsupervised learning problems. In these problems, we only have the independent variables and no target/dependent variable.
In clustering, we do not have a target to predict. We look at the data, try to club similar observations, and form different groups. Hence it is an unsupervised learning problem.
We now know what clusters are and the concept of clustering. Next, let’s look at the properties of these clusters, which we must consider while forming the clusters.
Properties of K means Clustering
How about another example of k-means clustering algorithm? We’ll take the same bank as before, which wants to segment its customers. For simplicity purposes, let’s say the bank only wants to use the income and debt to make the segmentation. They collected the customer data and used a scatter plot to visualize it:
![customer segmentation clustering [k-means clustering]](https://cdn.analyticsvidhya.com/wp-content/uploads/2019/08/Screenshot-from-2019-08-08-14-46-17.png)
On the X-axis, we have the income of the customer, and the y-axis represents the amount of debt. Here, we can clearly visualize that these customers can be segmented into 4 different clusters, as shown below:
![clusters of customer segmentation [k-means clustering]](https://cdn.analyticsvidhya.com/wp-content/uploads/2019/08/Screenshot-from-2019-08-08-14-47-20.png)
This is how clustering helps to create segments (clusters) from the data. The bank can further use these clusters to make strategies and offer discounts to its customers. So let’s look at the properties of these clusters.
First Property of K-Means Clustering Algorithm
All the data points in a cluster should be similar to each other. Let me illustrate it using the above example:![single cluster [k-means clustering]](https://cdn.analyticsvidhya.com/wp-content/uploads/2019/08/Screenshot-from-2019-08-08-14-49-11.png)
If the customers in a particular cluster are not similar to each other, then their requirements might vary, right? If the bank gives them the same offer, they might not like it, and their interest in the bank might reduce. Not ideal.
Having similar data points within the same cluster helps the bank to use targeted marketing. You can think of similar examples from your everyday life and consider how clustering will (or already does) impact the business strategy.
Second Property of K-Means Clustering Algorithm
The data points from different clusters should be as different as possible. This will intuitively make sense if you’ve grasped the above property. Let’s again take the same example to understand this property:
![multiple clusters [k-means clustering]](https://cdn.analyticsvidhya.com/wp-content/uploads/2019/08/Screenshot-from-2019-08-08-14-51-31.png)
Which of these cases do you think will give us the better clusters? If you look at case I:
![clusters: case 1 [k-means clustering]](https://cdn.analyticsvidhya.com/wp-content/uploads/2019/08/Screenshot-from-2019-08-08-14-52-26.png)
Customers in the red and blue clusters are quite similar to each other. The top four points in the red cluster share similar properties to those of the blue cluster’s top two customers. They have high incomes and high debt values. Here, we have clustered them differently. Whereas, if you look at case II:
![clusters [k-means clustering]](https://cdn.analyticsvidhya.com/wp-content/uploads/2019/08/Screenshot-from-2019-08-08-14-52-58.png)
Points in the red cluster completely differ from the customers in the blue cluster. All the customers in the red cluster have high income and high debt, while the customers in the blue cluster have high income and low debt value. Clearly, we have a better clustering of customers in this case.
Hence, data points from different clusters should be as different from each other as possible to have more meaningful clusters. The k-means algorithm uses an iterative approach to find the optimal cluster assignments by minimizing the sum of squared distances between data points and their assigned cluster centroid.
So far, we have understood what clustering is and the different properties of clusters. But why do we even need clustering? Let’s clear this doubt in the next section and look at some applications of clustering.
Applications of Clustering in Real-World Scenarios
Clustering is a widely used technique in the industry. It is being used in almost every domain, from banking and recommendation engines to document clustering and image segmentation.
Customer Segmentation
We covered this earlier – one of the most common applications of clustering is customer segmentation. And it isn’t just limited to banking. This strategy is across functions, including telecom, e-commerce, sports, advertising, sales, etc.
Document Clustering
This is another common application of clustering. Let’s say you have multiple documents and you need to cluster similar documents together. Clustering helps us group these documents such that similar documents are in the same clusters.
Image Segmentation
We can also use clustering to perform image segmentation. Here, we try to club similar pixels in the image together. We can apply clustering to create clusters having similar pixels in the same group.
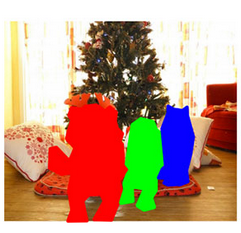
You can refer to this article to see how we can use clustering for image segmentation tasks.
Recommendation Engines
Clustering can also be used in recommendation engines. Let’s say you want to recommend songs to your friends. You can look at the songs liked by that person and then use clustering to find similar songs and finally recommend the most similar songs.
![recommendation clustering [k-means clustering]](https://cdn.analyticsvidhya.com/wp-content/uploads/2019/08/Screenshot-from-2019-08-08-15-05-03.png)
There are many more applications that I’m sure you have already thought of. You can share these applications in the comments section below. Next, let’s look at how we can evaluate our clusters.
Understanding the Different Evaluation Metrics for Clustering
The primary aim of clustering is not just to make clusters but to make good and meaningful ones. We saw this in the below example:
Here, we used only two features, and hence it was easy for us to visualize and decide which of these clusters was better.
Unfortunately, that’s not how real-world scenarios work. We will have a ton of features to work with. Let’s take the customer segmentation example again – we will have features like customers’ income, occupation, gender, age, and many more. We would not be able to visualize all these features together and decide on better and more meaningful clusters.
This is where we can make use of evaluation metrics. Let’s discuss a few of them and understand how we can use them to evaluate the quality of our clusters.
Inertia
Recall the first property of clusters we covered above. This is what inertia evaluates. It tells us how far the points within a cluster are. So, inertia actually calculates the sum of distances of all the points within a cluster from the centroid of that cluster. Normally, we use Euclidean distance as the distance metric, as long as most of the features are numeric; otherwise, Manhattan distance in case most of the features are categorical.
We calculate this for all the clusters; the final inertial value is the sum of all these distances. This distance within the clusters is known as intracluster distance. So, inertia gives us the sum of intracluster distances:
![intra cluster distance [k-means clustering]](https://cdn.analyticsvidhya.com/wp-content/uploads/2019/08/Screenshot-from-2019-08-08-15-32-17.png)
Now, what do you think should be the value of inertia for a good cluster? Is a small inertial value good, or do we need a larger value? We want the points within the same cluster to be similar to each other, right? Hence, the distance between them should be as low as possible.
Keeping this in mind, we can say that the lesser the inertia value, the better our clusters are.
Dunn Index
We now know that inertia tries to minimize the intracluster distance. It is trying to make more compact clusters.
Let me put it this way – if the distance between the centroid of a cluster and the points in that cluster is small, it means that the points are closer to each other. So, inertia makes sure that the first property of clusters is satisfied. But it does not care about the second property – that different clusters should be as different from each other as possible.
This is where the Dunn index comes into action.
![intra and inter cluster distance [k-means clustering]](https://cdn.analyticsvidhya.com/wp-content/uploads/2019/08/Screenshot-from-2019-08-08-15-37-02.png)
Along with the distance between the centroid and points, the Dunn index also takes into account the distance between two clusters. This distance between the centroids of two different clusters is known asinter-cluster distance. Let’s look at the formula of the Dunn index:
![Dunn index formula [k-means clustering]](https://cdn.analyticsvidhya.com/wp-content/uploads/2019/08/Screenshot-from-2019-08-08-15-37-22.png)
Dunn index is the ratio of the minimum of inter-cluster distances and maximum of intracluster distances.
We want to maximize the Dunn index. The more the value of the Dunn index, the better the clusters will be. Let’s understand the intuition behind the Dunn index:
![minimum of inter cluster distance [k-means clustering]](https://cdn.analyticsvidhya.com/wp-content/uploads/2019/08/Screenshot-from-2019-08-08-15-39-19.png)
In order to maximize the value of the Dunn index, the numerator should be maximum. Here, we are taking the minimum of the inter-cluster distances. So, the distance between even the closest clusters should be more which will eventually make sure that the clusters are far away from each other.
![maximum of intra cluster distance [k-means clustering]](https://cdn.analyticsvidhya.com/wp-content/uploads/2019/08/Screenshot-from-2019-08-08-15-39-34.png)
Also, the denominator should be minimum to maximize the Dunn index. Here, we are taking the maximum of all intracluster distances. Again, the intuition is the same here. The maximum distance between the cluster centroids and the points should be minimum, eventually ensuring that the clusters are compact.
Silhouette Score
The silhouette score and plot are used to evaluate the quality of a clustering solution produced by the k-means algorithm. The silhouette score measures the similarity of each point to its own cluster compared to other clusters, and the silhouette plot visualizes these scores for each sample. A high silhouette score indicates that the clusters are well separated, and each sample is more similar to the samples in its own cluster than to samples in other clusters. A silhouette score close to 0 suggests overlapping clusters, and a negative score suggests poor clustering solutions.
How to Apply K-Means Clustering Algorithm?
Let’s now take an example to understand how K-Means actually works:
Time needed: 10 minutes
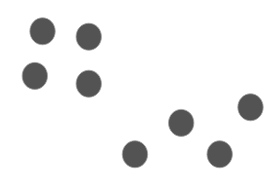
We have these 8 points, and we want to apply k-means to create clusters for these points. Here’s how we can do it.
- Choose the number of clusters k
The first step in k-means is to pick the number of clusters, k.
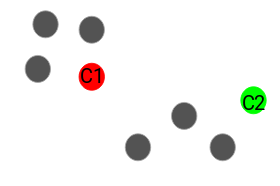
- Select k random points from the data as centroids
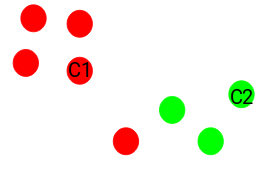
Next, we randomly select the centroid for each cluster. Let’s say we want to have 2 clusters, so k is equal to 2 here. We then randomly select the centroid:

Here, the red and green circles represent the centroid for these clusters. - Assign all the points to the closest cluster centroid
Once we have initialized the centroids, we assign each point to the closest cluster centroid:
Here you can see that the points closer to the red point are assigned to the red cluster, whereas the points closer to the green point are assigned to the green cluster. - Recompute the centroids of newly formed clusters
Now, once we have assigned all of the points to either cluster, the next step is to compute the centroids of newly formed clusters:
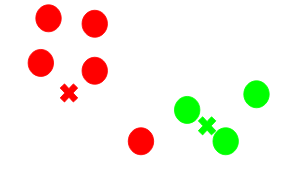
Here, the red and green crosses are the new centroids. - Repeat steps 3 and 4
We then repeat steps 3 and 4:
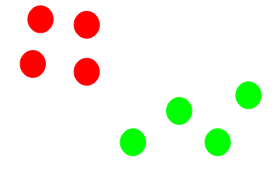
The step of computing the centroid and assigning all the points to the cluster based on their distance from the centroid is a single iteration. But wait – when should we stop this process? It can’t run till eternity, right?
Stopping Criteria for K-Means Clustering
There are essentially three stopping criteria that can be adopted to stop the K-means algorithm:
- Centroids of newly formed clusters do not change
- Points remain in the same cluster
- Maximum number of iterations is reached
We can stop the algorithm if the centroids of newly formed clusters are not changing. Even after multiple iterations, if we are getting the same centroids for all the clusters, we can say that the algorithm is not learning any new pattern, and it is a sign to stop the training.
Another clear sign that we should stop the training process is if the points remain in the same cluster even after training the algorithm for multiple iterations.
Finally, we can stop the training if the maximum number of iterations is reached. Suppose we have set the number of iterations as 100. The process will repeat for 100 iterations before stopping.
Implementing K-Means Clustering in Python From Scratch
Time to fire up our Jupyter notebooks (or whichever IDE you use) and get our hands dirty in Python!
We will be working on the loan prediction dataset that you can download here. I encourage you to read more about the dataset and the problem statement here. This will help you visualize what we are working on (and why we are doing this). Two pretty important questions in any data science project.
First, import all the required libraries:
Now, we will read the CSV file and look at the first five rows of the data:
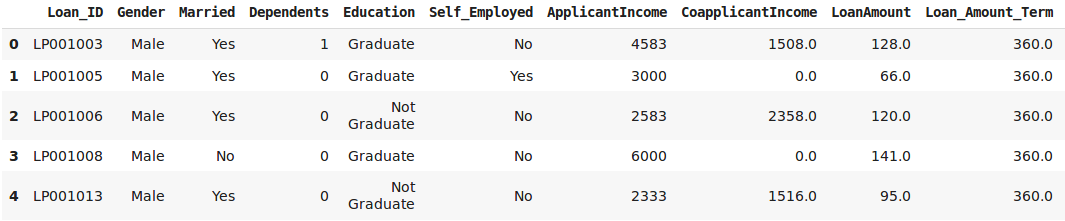
For this article, we will be taking only two variables from the data – “LoanAmount” and “ApplicantIncome.” This will make it easy to visualize the steps as well. Let’s pick these two variables and visualize the data points:
Python Code:
![scatter plot [k-means clustering]](https://cdn.analyticsvidhya.com/wp-content/uploads/2019/08/Screenshot-from-2019-08-09-12-56-38.png)
Steps 1 and 2 of K-Means were about choosing the number of clusters (k) and selecting random centroids for each cluster. We will pick 3 clusters and then select random observations from the data as the centroids:
![random initialization [k-means clustering]](https://cdn.analyticsvidhya.com/wp-content/uploads/2019/08/Screenshot-from-2019-08-09-12-58-58.png)
Here, the red dots represent the 3 centroids for each cluster. Note that we have chosen these points randomly, and hence every time you run this code, you might get different centroids.
Next, we will define some conditions to implement the K-Means Clustering algorithm. Let’s first look at the code:
These values might vary every time we run this. Here, we are stopping the training when the centroids are not changing after two iterations. This is the most common convergence criteria used for the K-Means clustering. We have initially defined the diff as 1, and inside the whole loop, we are calculating this diff as the difference between the centroids in the previous iteration and the current iteration.
When this difference is 0, we stop the training. Let’s now visualize the clusters we have got:
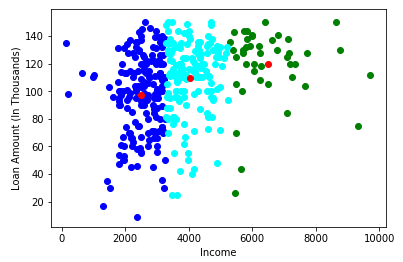
Awesome! Here, we can clearly visualize three clusters. The red dots represent the centroid of each cluster. I hope you now have a clear understanding of how K-Means work.
However, there are certain situations where this algorithm might not perform as well. Let’s look at some challenges you can face while working with k-means.
Challenges With the K-Means Clustering Algorithm And
The k value in k-means clustering is a crucial parameter that determines the number of clusters to be formed in the dataset. Finding the optimal k value in the k-means clustering can be very challenging, especially for noisy data. The appropriate value of k depends on the data structure and the problem being solved. It is important to choose the right value of k, as a small value can result in under-clustered data, and a large value can cause over-clustering.
Challenges
Also, one of the common challenges we face while working with K-Means is that the size of clusters is different. Let’s say we have the following points:
![clustering [k-means clustering]](https://cdn.analyticsvidhya.com/wp-content/uploads/2019/08/Screenshot-from-2019-08-09-13-14-37.png)
The leftmost and the rightmost clusters are of smaller size compared to the central cluster. Now, if we apply k-means clustering on these points, the results will be something like this:
![k means on data with different shapes [k-means clustering]](https://cdn.analyticsvidhya.com/wp-content/uploads/2019/08/Screenshot-from-2019-08-09-13-15-26.png)
Another challenge with k-means is when the densities of the original points are different. Let’s say these are the original points:
![different densities k-means [k-means clustering]](https://cdn.analyticsvidhya.com/wp-content/uploads/2019/08/Screenshot-from-2019-08-09-13-16-01.png)
Here, the points in the red cluster are spread out, whereas the points in the remaining clusters are closely packed together. Now, if we apply k-means on these points, we will get clusters like this:
![k means on data with different densities [k-means clustering]](https://cdn.analyticsvidhya.com/wp-content/uploads/2019/08/Screenshot-from-2019-08-09-13-19-05.png)
We can see that the compact points have been assigned to a single cluster. Whereas the points that are spread loosely but were in the same cluster have been assigned to different clusters. Not ideal, so what can we do about this?
Solutions
One of the solutions is to use a higher number of clusters.
So, in all the above scenarios, instead of using 3 clusters, we can have a bigger number. Perhaps setting k=10 might lead to more meaningful clusters.
Remember how we randomly initialize the centroids in k-means clustering? Well, this is also potentially problematic because we might get different clusters every time. So, to solve this problem of random initialization, there is an algorithm called K-Means++ that can be used to choose the initial values, or the initial cluster centroids, for K-Means.
Determining the optimal number of clusters for k-means clustering can be another challenge.
Optimal number heavily relies on subjective interpretations and the underlying structure of the data. One commonly used method to find the optimal number of clusters is the elbow method, which plots the sum of squared Euclidean distances between data points and their cluster center and chooses the number of clusters where the change in the sum of squared distances begins to level off.
Outliers can have a significant impact on the results of k-means clustering, as the algorithm is sensitive to extreme values.
This makes it important to identify and handle outliers before applying k-means clustering to ensure that the results are meaningful and not skewed by the presence of outliers. There are various methods to identify and handle outliers, such as removing them, transforming them, or using a robust variant of k-means clustering that is less sensitive to the presence of outliers.
The algorithm can handle millions of data points and produce results in a matter of seconds or minutes, making it a popular choice for analyzing big data. However, as the size of the data set increases, the computational cost of k-means clustering can also increase. Hence, it is important to consider alternative algorithms when working with extremely large data sets.
K-Means++ to Choose Initial Cluster Centroids for K-Means Clustering
In some cases, if the initialization of clusters is not appropriate, K-Means can result in arbitrarily bad clusters. This is where K-Means++ helps. It specifies a procedure to initialize the cluster centers before moving forward with the standard k-means clustering algorithm.
Using the K-Means++ algorithm, we optimize the step where we randomly pick the cluster centroid. We are more likely to find a solution that is competitive with the optimal K-Means solution while using the K-Means++ initialization.
Steps to Initialize the Centroids Using K-Means++
- The first cluster is chosen uniformly at random from the data points we want to cluster. This is similar to what we do in K-Means, but instead of randomly picking all the centroids, we just pick one centroid here
- Next, we compute the distance (D(x)) of each data point (x) from the cluster center that has already been chosen
- Then, choose the new cluster center from the data points with the probability of x being proportional to (D(x))2
- We then repeat steps 2 and 3 until k clusters have been chosen
Let’s take an example to understand this more clearly. Let’s say we have the following points, and we want to make 3 clusters here:
![clustering data [k-means clustering]](https://cdn.analyticsvidhya.com/wp-content/uploads/2019/08/Screenshot-from-2019-08-09-12-21-431.png)
Now, the first step is to randomly pick a data point as a cluster centroid:
![random initialization [k-means clustering]](https://cdn.analyticsvidhya.com/wp-content/uploads/2019/08/Screenshot-from-2019-08-09-15-21-32.png)
Let’s say we pick the green point as the initial centroid. Now, we will calculate the distance (D(x)) of each data point with this centroid:
![distance between centroid and points [k-means clustering]](https://cdn.analyticsvidhya.com/wp-content/uploads/2019/08/Screenshot-from-2019-08-09-15-23-39.png)
The next centroid will be the one whose squared distance (D(x)2) is the farthest from the current centroid:
![second cluster centroid [k-means clustering]](https://cdn.analyticsvidhya.com/wp-content/uploads/2019/08/Screenshot-from-2019-08-09-15-26-07.png)
In this case, the red point will be selected as the next centroid. Now, to select the last centroid, we will take the distance of each point from its closest centroid, and the point having the largest squared distance will be selected as the next centroid:
![distance between points and closest centroid [k-means clustering]](https://cdn.analyticsvidhya.com/wp-content/uploads/2019/08/Screenshot-from-2019-08-09-15-32-20.png)
We will select the last centroid as:
![third cluster centroid [k-means clustering]](https://cdn.analyticsvidhya.com/wp-content/uploads/2019/08/Screenshot-from-2019-08-09-15-33-17.png)
We can continue with the K-Means algorithm after initializing the centroids. Using K-Means++ to initialize the centroids tends to improve the clusters. Although it is computationally costly relative to random initialization, subsequent K-Means often converge more rapidly.
I’m sure there’s one question that you’ve been wondering since the start of this article – how many clusters should we make? In other words, what should be the optimum number of clusters to have while performing K-Means?
How to Choose the Right Number of Clusters in K-Means Clustering?
One of the most common doubts everyone has while working with K-Means is selecting the right number of clusters.
So, let’s look at a technique that will help us choose the right value of clusters for the K-Means algorithm. Let’s take the customer segmentation example that we saw earlier. To recap, the bank wants to segment its customers based on their income and amount of debt:
![customer segmentation clustering [k-means clustering]](https://cdn.analyticsvidhya.com/wp-content/uploads/2019/08/Screenshot-from-2019-08-09-15-51-38.png)
Here, we can have two clusters which will separate the customers as shown below:
![2 clusters [k-means clustering]](https://cdn.analyticsvidhya.com/wp-content/uploads/2019/08/Screenshot-from-2019-08-09-15-53-27.png)
All the customers with low income are in one cluster, whereas the customers with high income are in the second cluster. We can also have 4 clusters:
![4 clusters [k-means clustering]](https://cdn.analyticsvidhya.com/wp-content/uploads/2019/08/Screenshot-from-2019-08-09-15-54-09.png)
Here, one cluster might represent customers who have low income and low debt; another cluster is where customers have high income and high debt, and so on. There can be 8 clusters as well:
![8 clusters [k-means clustering]](https://cdn.analyticsvidhya.com/wp-content/uploads/2019/08/Screenshot-from-2019-08-09-15-54-58.png)
Honestly, we can have any number of clusters. Can you guess what would be the maximum number of possible clusters? One thing we can do is assign each point to a separate cluster. Hence, in this case, the number of clusters will equal the number of points or observations.
The maximum possible number of clusters will be equal to the number of observations in the dataset.
But then, how can we decide the optimum number of clusters? One thing we can do is plot a graph, also known as an elbow curve, where the x-axis will represent the number of clusters and the y-axis will be an evaluation metric. Let’s say inertia for now.
You can choose any other evaluation metric like the Dunn index as well:
![elbow curve [k-means clustering]](https://cdn.analyticsvidhya.com/wp-content/uploads/2019/08/Screenshot-from-2019-08-09-15-56-31.png)
Next, we will start with a small cluster value, say 2. Train the model using 2 clusters, calculate the inertia for that model, and finally plot it in the above graph. Let’s say we got an inertia value of around 1000:
![elbow curve [k-means clustering]](https://cdn.analyticsvidhya.com/wp-content/uploads/2019/08/Screenshot-from-2019-08-09-15-57-51.png)
Now, we will increase the number of clusters, train the model again, and plot the inertia value. This is the plot we get:
![elbow curve [k-means clustering]](https://cdn.analyticsvidhya.com/wp-content/uploads/2019/08/Screenshot-from-2019-08-09-15-59-05.png)
When we changed the cluster value from 2 to 4, the inertia value reduced sharply. This decrease in the inertia value reduces and eventually becomes constant as we increase the number of clusters further.
So,
the cluster value where this decrease in inertia value becomes constant can be chosen as the right cluster value for our data.
![right value of k in k means [k-means clustering]](https://cdn.analyticsvidhya.com/wp-content/uploads/2019/08/Screenshot-from-2019-08-09-16-01-34.png)
Here, we can choose any number of clusters between 6 and 10. We can have 7, 8, or even 9 clusters. You must also look at the computation cost while deciding the number of clusters. If we increase the number of clusters, the computation cost will also increase. So, if you do not have high computational resources, my advice is to choose a lesser number of clusters.
Let’s now implement the K-Means Clustering algorithm in Python. We will also see how to use K-Means++ to initialize the centroids and will also plot this elbow curve to decide what should be the right number of clusters for our dataset.
Implementing K-Means Clustering in Python
We will be working on a wholesale customer segmentation problem. You can download the dataset using this link. The data is hosted on the UCI Machine Learning repository.
The aim of this problem is to segment the clients of a wholesale distributor based on their annual spending on diverse product categories, like milk, grocery, region, etc. So, let’s start coding!
We will first import the required libraries:
Next, let’s read the data and look at the first five rows:
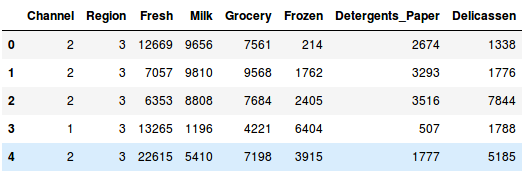
We have the spending details of customers on different products like Milk, Grocery, Frozen, Detergents, etc. Now, we have to segment the customers based on the provided details.
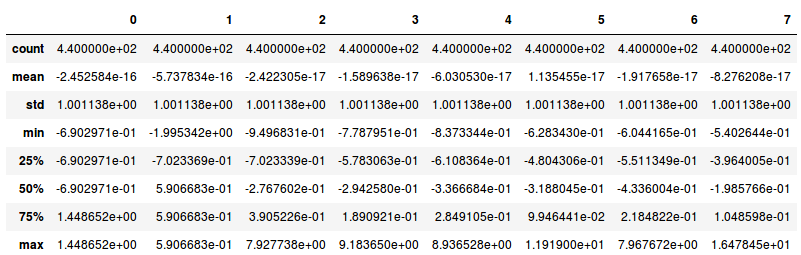
Let’s pull out some statistics related to the data:
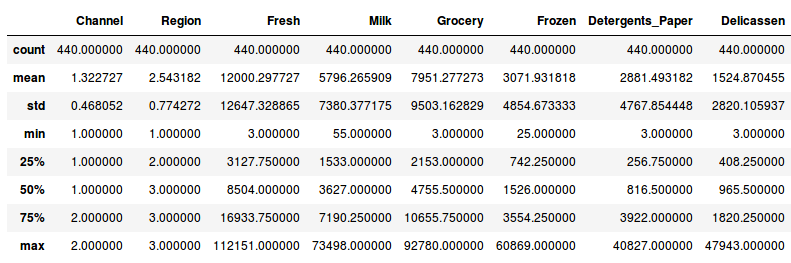
Here, we see that there is a lot of variation in the magnitude of the data. Variables like Channel and Region have low magnitude, whereas variables like Fresh, Milk, Grocery, etc., have a higher magnitude.
Since K-Means is a distance-based algorithm, this difference in magnitude can create a problem.
Bring all the variables to the same magnitude
The magnitude looks similar now.
Create a kmeans function and fit it on the data
We have initialized two clusters and pay attention – the initialization is not random here. We have used the k-means++ initialization which generally produces better results as we have discussed in the previous section as well.
Let’s evaluate how well the formed clusters are. To do that, we will calculate the inertia of the clusters:
Output: 2599.38555935614
We got an inertia value of almost 2600. Now, let’s see how we can use the elbow method to determine the optimum number of clusters in Python.
We will first fit multiple k-means models, and in each successive model, we will increase the number of clusters.
We will store the inertia value of each model and then plot it to visualize the result
![elbow curve [k-means clustering]](https://cdn.analyticsvidhya.com/wp-content/uploads/2019/08/Screenshot-from-2019-08-09-16-46-52.png)
Can you tell the optimum cluster value from this plot? Looking at the above elbow curve, we can choose any number of clusters between 5 to 8.
Set the number of clusters as 6 and fit the model
Value count of points in each of the above-formed clusters
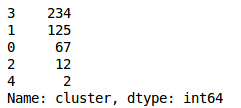
So, there are 234 data points belonging to cluster 4 (index 3), 125 points in cluster 2 (index 1), and so on. This is how we can implement K-Means Clustering in Python.
Conclusion
In this article, we discussed one of the most famous clustering algorithms – K-Means Clustering. We implemented it from scratch and looked at its step-by-step implementation. We looked at the challenges we might face while working with K-Means and also saw how K-Means++ can be helpful when initializing the cluster centroids.
Finally, we implemented k-means and looked at the elbow method, which helps to find the optimum number of clusters in the K-Means algorithm.
If you have any doubts or feedback, feel free to share them in the comments section below. And make sure you check out the comprehensive ‘Applied Machine Learning‘ course that takes you from the basics of machine learning to advanced algorithms (including an entire module on deploying your machine learning models!).
Key Takeaways
- K-Means Clustering is a simple yet powerful algorithm in data science.
- The algorithm works to group together or form clusters of data points from an unlabeled dataset.
- It is used in a plethora of real-world situations across various domains, such as banking and image segmentation, to document clustering and business decision-making.
Frequently Asked Questions
A. K-means classification is a method in machine learning that groups data points into K clusters based on their similarities. It works by iteratively assigning data points to the nearest cluster centroid and updating centroids until they stabilize. It’s widely used for tasks like customer segmentation and image analysis due to its simplicity and efficiency.
K-means is a type of algorithm used for clustering data into groups based on similarity. It aims to find cluster centers (centroids) that minimize the distance between data points and their respective centroids
A. The biggest benefit of K-means clustering is that it is faster than hierarchical clustering. It is easy to implement, can work with a large number of variables, and can quickly change clusters when the centroids are recomputed.
KNN is a supervised learning algorithm used for classification and regression by finding the majority class or average value among the k nearest neighbors of a data point. K-means, on the other hand, is an unsupervised learning algorithm used for clustering data into groups based on similarity by iteratively assigning data points to the nearest cluster centroid and updating centroids.
The main function used for K-means clustering is typically named “KMeans” in programming libraries like scikit-learn in Python or kmeans in MATLAB.
My research interests lies in the field of Machine Learning and Deep Learning. Possess an enthusiasm for learning new skills and technologies.


Hi Pulkit, Thank you for this excellent article on the subject - one of the most comprehensive ones I have read. My question is that lets say I have 7 distinct clusters arrived at using the techniques you have mentioned. How can I come up with relevant criteria/ rules using some ML algorithm such that any new observation can be assigned to one of the clusters by passing through the decision rule instead of running K-Means again.
Hi Arjun, Glad that you liked the article! For new observations, you will first calculate the distance of this new observation will all the cluster centroids (7 as you have mentioned) and then assign this new observation to the cluster whose centroid is closest to this observations. In this way you can assign new observations to the cluster.
Hi Pulkit, Thanks for the post. Kindly clarify me: 1. In the "WholeSale Customer Data" data set, the variables: region and channel are categorical. In mathematical terms, we can not describe distance between different categories of a categorical variable. But we converted them to a numeric form here and the distances are calculated. How can we justify the usage of these variables while clustering? 2. Usually in most of the real-world problems, we have datasets of mixed form( containing of both numerical and categorical features). Is it ok to apply same k-means algorithm, on such datasets? -Rajiv
- It is not advisable to use the ordinal form of categorical variables in clustering, you have to convert them in numeric values which make more sense with rest of the data points, you can use one of the following methods to convert them into numeric form 1. Use 1-hot encoding (So that one category is not influenced by other numerically) 2. If you have classification problem, use target encoding to encode the categorical variables 3. If the categories are ordinal in nature then you may use the label encoding 4. Find the correlation between the categorical variable and all the numeric variables, now replace the mean of the numeric variable value which has the highest correlation with the categorical variable. Correlation can be found using the one-way ANOVA test. I would recommend to use the method 4 above.
You may be interested in investigating K-Modes clustering algorithm, which will handle numerical and categorical data, whereas K-Means clustering is strictly numerical data.
Cluster explained very well. Thanks for the article in Python. Can you clarify below points 1) In the wholesale example, all the columns are considered for clustering, Column Channel & Region also need to be included? as there is no variation in that. 2) After identifying the cluster group, how to update back the cluster group in the raw data
Hi, Thank you for your feedback on the article. 1) This is based on your exploration. I have created the model using all the available features. You can explore the data more and then try to include the variables which you think are useful. 2) Using K-Means, each point is assigned to a specific cluster. You can use model.predict() to find the cluster number for each observation.
Hi Pulkit, Thanks for your article, it's very helpful for me. I wonder about the lines of your code: 1. C=[] 2. for index,row in X.iterrows(): 3. min_dist=row[1] 4. pos=1 5. for i in range(K): 6. if row[i+1] < min_dist: 7. min_dist = row[i+1] 8. pos=i+1 9. C.append(pos) In the line 3, i think it should be: min_dist=row[2] and in line 6 should be: if row[i+2] < min_dist: Thanks for read my comment!
Hi Pon, Have you tried using the code that you have mentioned here? I tried it and it produced error. Also, what is the logic behind using the code that you have mentioned?
Thanks for the article Pulkit. Can you please clarify my queries: 1. K- Means , by default assigns the initial centroid thru init : {‘k-means++’}. Hope, it will be taken care by sklearn. 2. For an imbalanced data which has the class ratio of 100 : 1, can i generate labels thru kmeans and use it as a feature in my classification algorithm? Will it improve accuracy like knn?
Glad that you liked the article Saleem! 1. Yes! By default, sklearn implementation of k-means initialize the centroids using k-means++ algorithm and hence even if you have not defined the initialization as k-means++, it will automatically pick this initialization. 2. You can cluster the points using K-means and use the cluster as a feature for supervised learning. It is not always necessary that the accuracy will increase. It may increase or might decrease as well. You can try and check that out. Also, when you have an imbalanced dataset, accuracy is not the right evaluation metric to evaluate your model. You can try F1 score or AUC-ROC. Hope this will clarify your queries.
Hi Pulkit, You did a great job ob this article to be patient and detailed as possible. However, I got lost here because I am still a newbie, can you explain each line of code with comments and send it to me email address [email protected]. I know I am asking for a lot. "Next, we will define some conditions to implement the K-Means Clustering algorithm. Let’s first look at the code: # Step 3 - Assign all the points to the closest cluster centroid # Step 4 - Recompute centroids of newly formed clusters # Step 5 - Repeat step 3 and 4 diff = 1 j=0 while(diff!=0): XD=X i=1 for index1,row_c in Centroids.iterrows(): ED=[] for index2,row_d in XD.iterrows(): d1=(row_c["ApplicantIncome"]-row_d["ApplicantIncome"])**2 d2=(row_c["LoanAmount"]-row_d["LoanAmount"])**2 d=np.sqrt(d1+d2) ED.append(d) X[i]=ED i=i+1 C=[] for index,row in X.iterrows(): min_dist=row[1] pos=1 for i in range(K): if row[i+1] < min_dist: min_dist = row[i+1] pos=i+1 C.append(pos) X["Cluster"]=C Centroids_new = X.groupby(["Cluster"]).mean()[["LoanAmount","ApplicantIncome"]] if j == 0: diff=1 j=j+1 else: diff = (Centroids_new['LoanAmount'] - Centroids['LoanAmount']).sum() + (Centroids_new['ApplicantIncome'] - Centroids['ApplicantIncome']).sum() print(diff.sum()) Centroids = X.groupby(["Cluster"]).mean()[["LoanAmount","ApplicantIncome"]]"
Hey Pulkit, this is a really great article and it really helps a lot to get a clear understanding about k means. I am trying to replicate the process in R and I had a question about multiple variables. So given a similar dataset, if I have multiple observations and I have multiple variables, is there a way I can run a k means on multiple variables? If yer then is there a limit?
Hi Rishab, Yes you can apply k-means if you have multiple variables. In python I use the sklearn library to implement k-means, you can search for some similar thing in R as well. There is no limit of variables as such. Its just that if you have more number of variables, the computation time will increase.
Awesome! You have given me a real push. Many thanks for the article.
Thank you for your feedback Vincent!!
Hi , can you provide more information on code , "model.predict()" to find the cluster number for each observation. Thanks in advnace.
Hi Sujay, It will takes each observation, find the distance of that observation from all the cluster centroids and then depending on the distance, assign it to the closest cluster. This is how the predictions are made in k-means clustering.
Hi, Great article and well explained for someone who has little to no experience or formal institutionalized education in the field. Very intuitive. My question is regarding how I can isolate a specific cluster to do further analysis on it or to prove some sort of hypothesis about a cluster. I have a decent understanding of algorithms due to an engineering background but lack the intuition for programming languages and thus am relatively inexperienced at python
Hi Wasiq, Thank you for your valuable feedback. If you look at the last code block from the article: frame = pd.DataFrame(data_scaled) frame['cluster'] = pred This frame dataframe will have a new variable named 'cluster' which will tell the cluster number for each observations. You can then separate the datasets based on their cluster value.
Hi Pulkit , Can you share any code, where we are applying supervised learning after clustering, because that's how the flow is right?
Hi Nikhil, Right now I don't have any resource for this. Will surely look for it and share with you once I find some relevant resource.
Hi Pulkit, Thank a lot for this amazing and well explained article on K-means. I am just confused about the way distances are calculated in K-means for choosing the centroids. What is the default method for calculating distances and can we mention any other method in place of default if we want to?
Hi Maneesha, By default, we use euclidean distance to calculate the distances. You can use other distances as well, but then you'll have to write your custom code and then implement these algorithms.
Hi Pulkit, Thanks for the superb article. This is by far the most comprehensive piece on clustering i cam across. Would be great if you could also share how to evaluate the clusters created alongwith how to use this output. Thanks, Kiran
Hi Kiran, Glad you liked it. To evaluate the clusters, you can use any of these evaluation metrics: Inertia and Dunn Index. This will tell you how accurate your clusters are.
Hi Pulkit , I need to plot cluster number against each row/value. Please mention the code to plot the cluster value against each row of input data. Thanks.
Awesome article. Thanks a lot. It is very very explanative, exciting and useful.
Thank you Suat!!
Great article. However, this phrase is missing important information: ". . . inertia actually calculates the sum of all the points within a cluster from the centroid of that cluster." I believe the correct statement is as follows: ". . . inertia actually calculates the sum of the distances of all the points within a cluster from the centroid of that cluster."
Thank you for pointing that out kurt. This was what I meant from the statement. I have updated the same in the article.
Pulkit ..one of very simplified approach to expose K means to new entrants to data science..Thanks very much .. If you have written any article on anomaly detection techniques using K means I will be interested .If you can share it will be much appreciated.
Hi Sunny, That you for your feedback. As of now, I have not covered this project of anomaly detection in my articles. Will share with you once I come across something relevant to this.
I really enjoyed your blog Thanks for sharing such an informative post.
Glad to hear that!!
This article is really amazing, congratulations by the job done. It do help me to understand how to K-Means works and to write my graduation article. Thanks a lot!
Good to hear that Fernando!!
Hi pulkit, I want to classify my training tweet set into 3 classes such as positive, negative, and neytral using k-mean clustering. If i take k value as 3, we would get 3 clusters but how to decide which tweet is positive or negative. My aim is to label the tweets into one of three classes (pos, neg or neutral) using kmean clustering. Is it possible to do that on tweets?
Thank you for the great article, well explained and very helpful especially for a beginner like me. I've also read the reviews and comments which are great. Please I would like to know:- -How can one convert the output to an interpretable format? -How can one determine who (Loan_ID) or group of people that the bank can give loan to, based on the Kmeans clustering output? I would be very grateful if you can help me out with this part. I believe your methods and ways of analyzing the output will be best based on your understanding of the topic.
Thank you for this very comprehensive article. You just demystified K-means to me and I am very grateful.
hello,first of all thanks for your explanation, i have question could you please kindly help me? i want to perform k-means just to cluster users based on one parameter , how can i do that?
Hi Pulkit, thx for this excellent introduction! I have the clusters now, but the door opens and a new customer walks in... How do I calculate the cluster the new customer belongs to? -Bodo
Thank you for the well-explained article. Very easy to understand,
Hi Pulkit Excellent coverage of the topic, very nicely complied. Please need to know how to attach labels predicted from the data , how can we get our data including attached cluster number etc to further study and analysis
Hey Pulkit! This is such a wonderful and detailed article, helped me understand the process properly. Great work!
I work for an ambulance service we know the grid reference for all the emergencies. My question is if we wanted to know the location of where best to site our stations what would be the best method and how would I find out the grid references of the stations. I am not a programmer or very technical, any help would be appreciated