Build Better and Accurate Clusters with Gaussian Mixture Models
Overview
- Gaussian Mixture Models are a powerful clustering algorithm
- Understand how Gaussian Mixture Models work and how to implement them in Python
- We’ll also cover the k-means clustering algorithm and see how Gaussian Mixture Models improve on it
Introduction
I really like working on unsupervised learning problems. They offer a completely different challenge to a supervised learning problem – there’s much more room for experimenting with the data that I have. It’s no wonder that the majority of developments and breakthroughs in the machine learning space are happening in the unsupervised learning domain.
And one of the most popular techniques in unsupervised learning is clustering. It’s a concept we typically learn early on in our machine learning journey and it’s simple enough to grasp. I’m sure you’ve come across or even worked on projects like customer segmentation, market basket analysis, etc.
But here’s the thing – clustering has many layers. It isn’t limited to the basic algorithms we learned earlier. It is a powerful unsupervised learning technique that we can use in the real-world with unerring accuracy.
Gaussian Mixture Models are one such clustering algorithm that I want to talk about in this article.
Want to forecast the sales of your favorite product? Or perhaps you want to understand customer churn through the lens of different groups of customers. Whatever the use case, you’ll find Gaussian Mixture Models really helpful.
We’ll take a bottom-top approach in this article. So, we’ll first look at the basics of clustering including a quick recap of the k-means algorithm. Then, we’ll dive into the concept of Gaussian Mixture Models and implement them in Python.
If you’re new to the world of clustering and data science, I recommend checking out the below comprehensive course:
Table of contents
- Overview
- Introduction
- Introduction to Clustering
- Introduction to k-means Clustering
- Drawbacks of k-means Clustering
- Introduction to Gaussian Mixture Models (GMMs)
- The Gaussian Distribution
- Characteristics of the Normal or Gaussian Distribution
- What is Expectation-Maximization?
- Expectation-Maximization in Gaussian Mixture Models
- Implementing Gaussian Mixture Models in Python
- End Notes
- Frequently Asked Questions
Introduction to Clustering
Before we kick things off and get into the nitty-gritty of Gaussian Mixture Models, let’s quickly refresh some basic concepts.
Note: If you are already familiar with the idea behind clustering and how the k-means clustering algorithm works, you can directly skip to the fourth section, ‘Introduction to Gaussian Mixture Models’.
So, let’s start by formally defining the core idea:
Clustering refers to grouping similar data points together, based on their attributes or features.
For example, if we have the income and expenditure for a set of people, we can divide them into the following groups:
- First – Earn high, spend high
- Second – Earn high, spend low
- Third – Earn low, spend low
- Fourth – Earn low, spend high

Each of these groups would hold a population with similar features and can be useful in pitching the relevant scheme/product to the group. Think of credit cards, car/property loans, and so on. In simple words:
The idea behind clustering is grouping data points together, such that each individual cluster holds the most similar points.
There are various clustering algorithms out there. One of the most popular clustering algorithms is k-means. Let us understand how the k-means algorithm works and what are the possible scenarios where this algorithm might come up short of expectations.
Introduction to k-means Clustering
k-means clustering is a distance-based algorithm. This means that it tries to group the closest points to form a cluster.
Let’s take a closer look at how this algorithm works. This will lay the foundational blocks to help you understand where Gaussian Mixture Models will come into play later in this article.
So, we first define the number of groups that we want to divide the population into – that’s the value of k. Based on the number of clusters or groups we want, we then randomly initialize k centroids.
The data points are then assigned to the closest centroid and a cluster is formed. The centroids are then updated and the data points are reassigned. This process goes on iteratively until the location of centroids no longer changes.
Check out the below gif which represents the whole process of initializing and updating clusters. The number of clusters is assigned to be 10:
Note: This was a brief overview of k-means clustering and is good enough for this article. If you want to go deeper into the working of the k-means algorithm, here is an in-depth guide: The Most Comprehensive Guide to k-means you’ll Ever Need!
Drawbacks of k-means Clustering
The k-means clustering concept sounds pretty great, right? It’s simple to understand, relatively easy to implement, and can be applied in quite a number of use cases. But there are certain drawbacks and limitations that we need to be aware of.
Let’s take the same income-expenditure example we saw above. The k-means algorithm seems to be working pretty well, right? Hold on – if you look closely, you will notice that all the clusters created have a circular shape. This is because the centroids of the clusters are updated iteratively using the mean value.
Now, consider the following example where the distribution of points is not in a circular form. What do you think will happen if we use k-means clustering on this data? It would still attempt to group the data points in a circular fashion. That’s not great! k-means fails to identify the right clusters:
Hence, we need a different way to assign clusters to the data points. So instead of using a distance-based model, we will now use a distribution-based model. And that is where Gaussian Mixture Models come into this article!
Introduction to Gaussian Mixture Models (GMMs)
The Gaussian Mixture Model (GMM) is a probabilistic model used for clustering and density estimation. It assumes that the data is generated from a mixture of several Gaussian distributions, each representing a distinct cluster. GMM assigns probabilities to data points, allowing them to belong to multiple clusters simultaneously. The model is widely used in machine learning and pattern recognition applications.
Gaussian Mixture Models (GMMs) assume that there are a certain number of Gaussian distributions, and each of these distributions represent a cluster. Hence, a Gaussian Mixture Model tends to group the data points belonging to a single distribution together.
Let’s say we have three Gaussian distributions (more on that in the next section) – GD1, GD2, and GD3. These have a certain mean (μ1, μ2, μ3) and variance (σ1, σ2, σ3) value respectively. For a given set of data points, our GMM would identify the probability of each data point belonging to each of these distributions.
Wait, probability?
You read that right! Gaussian Mixture Models are probabilistic models and use the soft clustering approach for distributing the points in different clusters. I’ll take another example that will make it easier to understand.
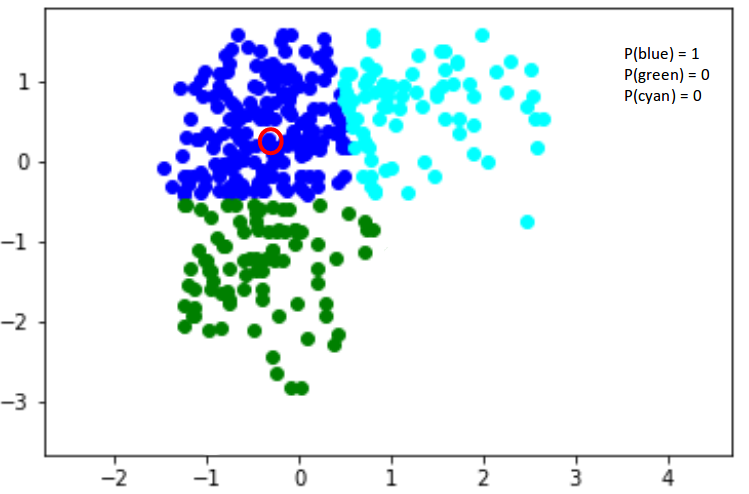
Here, we have three clusters that are denoted by three colors – Blue, Green, and Cyan. Let’s take the data point highlighted in red. The probability of this point being a part of the blue cluster is 1, while the probability of it being a part of the green or cyan clusters is 0.
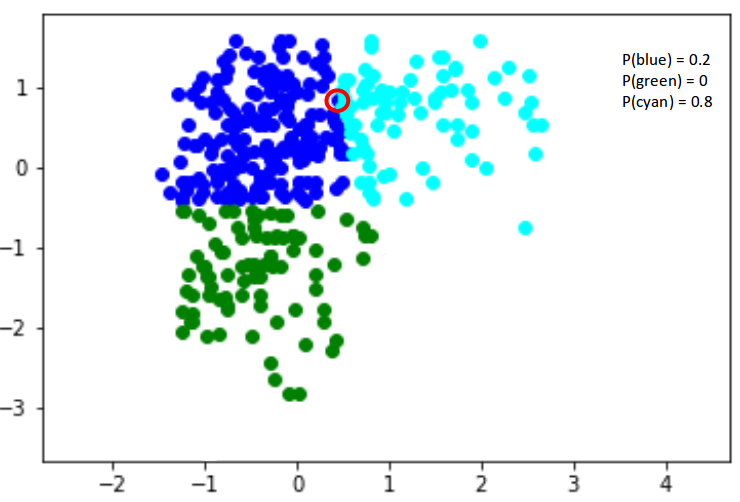
Now, consider another point – somewhere in between the blue and cyan (highlighted in the below figure). The probability that this point is a part of cluster green is 0, right? And the probability that this belongs to blue and cyan is 0.2 and 0.8 respectively.
Gaussian Mixture Models use the soft clustering technique for assigning data points to Gaussian distributions. I’m sure you’re wondering what these distributions are so let me explain that in the next section.
The Gaussian Distribution
I’m sure you’re familiar with Gaussian Distributions (or the Normal Distribution). It has a bell-shaped curve, with the data points symmetrically distributed around the mean value.
The below image has a few Gaussian distributions with a difference in mean (μ) and variance (σ2). Remember that the higher the σ value more would be the spread:
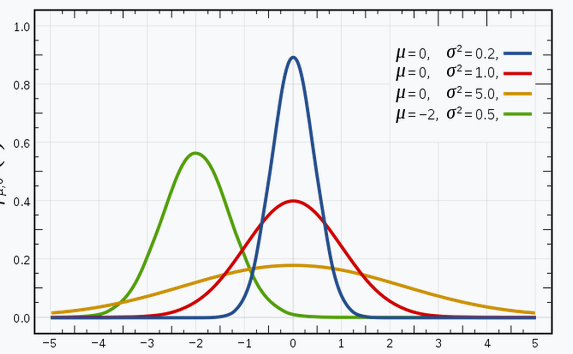
Source: Wikipedia
In a one dimensional space, the probability density function of a Gaussian distribution is given by:
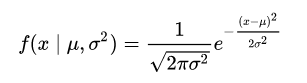
where μ is the mean and σ2 is the variance.
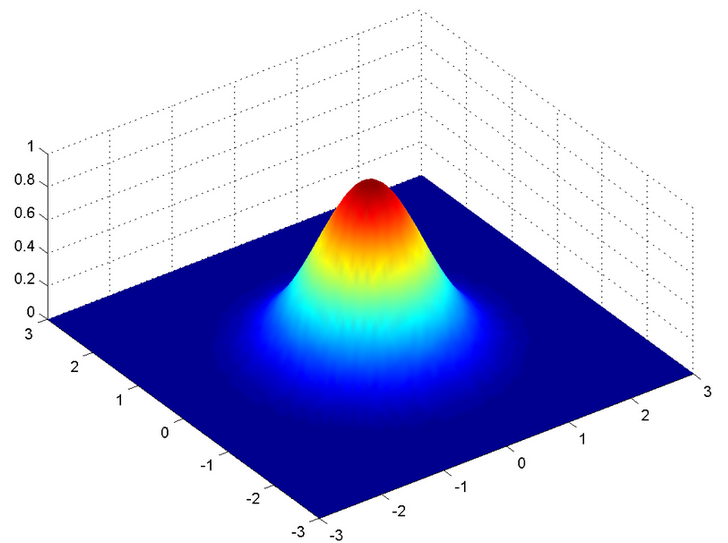
But this would only be true for a single variable. In the case of two variables, instead of a 2D bell-shaped curve, we will have a 3D bell curve as shown below:
The probability density function would be given by:
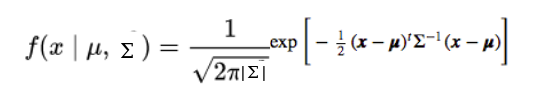
where x is the input vector, μ is the 2D mean vector, and Σ is the 2×2 covariance matrix. The covariance would now define the shape of this curve. We can generalize the same for d-dimensions.
Thus, this multivariate Gaussian model would have x and μ as vectors of length d, and Σ would be a d x d covariance matrix.
Hence, for a dataset with d features, we would have a mixture of k Gaussian distributions (where k is equivalent to the number of clusters), each having a certain mean vector and variance matrix. But wait – how is the mean and variance value for each Gaussian assigned?
These values are determined using a technique called Expectation-Maximization (EM). We need to understand this technique before we dive deeper into the working of Gaussian Mixture Models.
Characteristics of the Normal or Gaussian Distribution
Characteristics of the normal or Gaussian distribution:
- It’s bell-shaped with most values around the average.
- It has only one peak or mode.
- It stretches out forever in both directions.
- Its mean, median, and mode are the same.
- Its spread is measured by its standard deviation.
- The total area under its curve equals 1.
What is Expectation-Maximization?
Excellent question!
Expectation-Maximization (EM) is a statistical algorithm for finding the right model parameters. We typically use EM when the data has missing values, or in other words, when the data is incomplete.
These missing variables are called latent variables. We consider the target (or cluster number) to be unknown when we’re working on an unsupervised learning problem.
It’s difficult to determine the right model parameters due to these missing variables. Think of it this way – if you knew which data point belongs to which cluster, you would easily be able to determine the mean vector and covariance matrix.
Since we do not have the values for the latent variables, Expectation-Maximization tries to use the existing data to determine the optimum values for these variables and then finds the model parameters. Based on these model parameters, we go back and update the values for the latent variable, and so on.
Broadly, the Expectation-Maximization algorithm has two steps:
- E-step: In this step, the available data is used to estimate (guess) the values of the missing variables
- M-step: Based on the estimated values generated in the E-step, the complete data is used to update the parameters
Expectation-Maximization is the base of many algorithms, including Gaussian Mixture Models. So how does GMM use the concept of EM and how can we apply it for a given set of points? Let’s find out!
Expectation-Maximization in Gaussian Mixture Models
Let’s understand this using another example. I want you to visualize the idea in your mind as you read along. This will help you better understand what we’re talking about.
Let’s say we need to assign k number of clusters. This means that there are k Gaussian distributions, with the mean and covariance values to be μ1, μ2, .. μk and Σ1, Σ2, .. Σk . Additionally, there is another parameter for the distribution that defines the number of points for the distribution. Or in other words, the density of the distribution is represented with Πi.
Now, we need to find the values for these parameters to define the Gaussian distributions. We already decided the number of clusters, and randomly assigned the values for the mean, covariance, and density. Next, we’ll perform the E-step and the M-step!
E-step:
For each point xi, calculate the probability that it belongs to cluster/distribution c1, c2, … ck. This is done using the below formula:
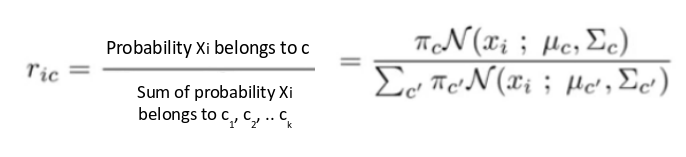
This value will be high when the point is assigned to the right cluster and lower otherwise.
M-step:
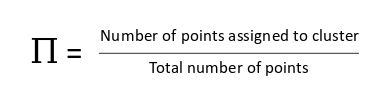
Post the E-step, we go back and update the Π, μ and Σ values. These are updated in the following manner:
- The new density is defined by the ratio of the number of points in the cluster and the total number of points:
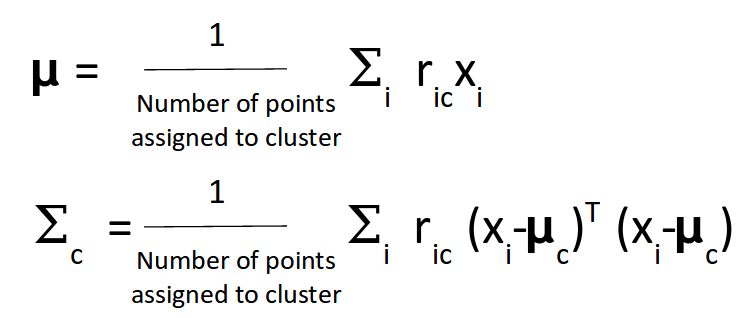
- The mean and the covariance matrix are updated based on the values assigned to the distribution, in proportion with the probability values for the data point. Hence, a data point that has a higher probability of being a part of that distribution will contribute a larger portion:
Based on the updated values generated from this step, we calculate the new probabilities for each data point and update the values iteratively. This process is repeated in order to maximize the log-likelihood function. Effectively we can say that the
k-means only considers the mean to update the centroid while GMM takes into account the mean as well as the variance of the data!
Implementing Gaussian Mixture Models in Python
It’s time to dive into the code! This is one of my favorite parts of any article so let’s get going straightaway.
We’ll start by loading the data. This is a temporary file that I have created – you can download the data from this link.
Python Code:
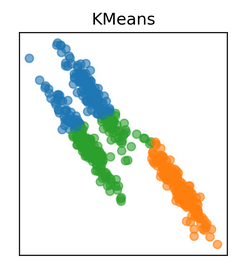
That’s what our data looks like. Let’s build a k-means model on this data first:
That’s not quite right. The k-means model failed to identify the right clusters. Look closely at the clusters in the center – k-means has tried to build a circular cluster even though the data distribution is elliptical (remember the drawbacks we discussed earlier?).
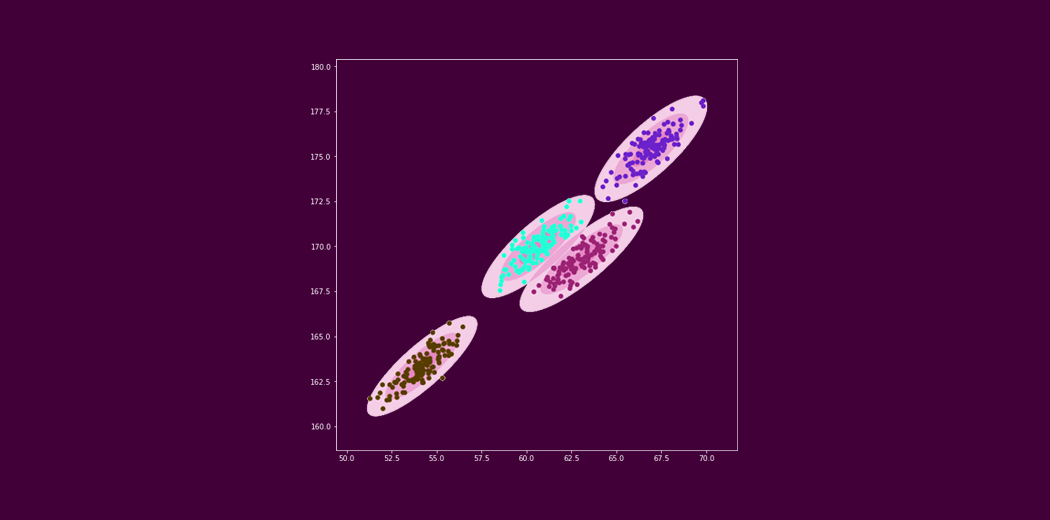
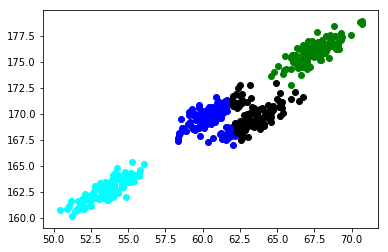
Let’s now build a Gaussian Mixture Model on the same data and see if we can improve on k-means:
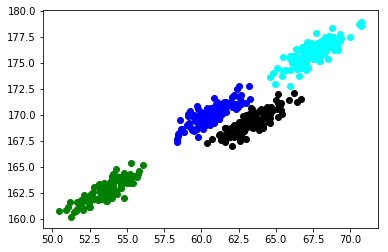
Excellent! Those are exactly the clusters we were hoping for. Gaussian Mixture Models have blown k-means out of the water here.
End Notes
This was a beginner’s guide to Gaussian Mixture Models. My aim here was to introduce you to this powerful clustering technique and showcase how effective and efficient it can be as compared to your traditional algorithms.
I encourage you to take up a clustering project and try out GMMs there. That’s the best way to learn and ingrain a concept – and trust me, you’ll realise the full extent of how useful this algorithm is.
Frequently Asked Questions
A. The Gaussian Mixture Model (GMM) is a probabilistic model used for clustering and density estimation. It assumes that the data points are generated from a mixture of several Gaussian distributions, each representing a cluster. GMM estimates the parameters of these Gaussians to identify the underlying clusters and their corresponding probabilities, allowing it to handle complex data distributions and overlapping clusters.
A. Gaussian Mixture Models (GMMs) are used for various tasks:
1. Clustering: GMM identifies underlying clusters in data, accommodating non-spherical clusters and overlapping patterns.
2. Density Estimation: GMM estimates the underlying probability density function of data.
3. Anomaly Detection: It can detect anomalies as data points with low probability under the fitted GMM.
4. Feature Extraction: GMM can represent data points in reduced-dimensional latent space for feature extraction and dimensionality reduction.
Gaussian mixture models (GMMs) are useful for clustering multimodal data with an unknown number of clusters. They are best suited for continuous data but can also be used with discrete data. Consider using a GMM if your data has multiple peaks in its value distribution or if you’re unsure of the number of clusters present.
Have any questions or thoughts on Gaussian Mixture Models? Let’s discuss in the comments section below.
An avid reader and blogger who loves exploring the endless world of data science and artificial intelligence. Fascinated by the limitless applications of ML and AI; eager to learn and discover the depths of data science.


Excellent article! Thank you, Aishwarya.
Great Explanation!
Thanks Sahar!
I am really blow with a lot of information right now! I will keep on reading as you post new blogs. This is really interesting.
Thanks Rani!
Why do the clusters formed by kMeans and GMM similar to me? Don't see how kMeans is making circular clusters. Can you please explain.
Look closely at the two clusters in the center (blue and black). The GMM model is able to separate the points correctly. The k-means on the other hand has some divided the points in such a manner that half of the blue points are from one cluster while the rest are from another cluster.
Very interesting algorithm. Appreciate your time into the article Aishwarya. Can we apply GMM for time-series data (having both continuous and categorical variables)? Or are there other algorithm that works well for time series data?
Interesting article! These articles are giving me a good idea on how to apply data science techniques on my internship! One question, do you still take questions for previous articles that you've written? There's one article that has caught my attention but I'm still quite lost!
Fantastic explanation ..thanks a lot
Glad you liked it Emerson!
Awesome
Thanks Santosh!
Hi Excellent article Aishwarya. A big fan of your Articles and interested in discussing a ML - AI project here in the UK. Do you have an e-mail address where I can contact you? Thanks again
Thanks for a well written and clearly presented post. I see the improvements of GMM coming from having a distribution on each of the two variables. Whereas in KMM, the two dimensions are reduced to just one when you use the distance formula. It was illuminating to think of changes in the component distributions as the diagram was rotated. Consider the problem if the stripes in the KMeans picture at the top, were vertical instead of tilted at 45 degrees. The distribution on the X axis would capture the clusters very sharply, and the one on the Y axis wouldn’t be very clear at all. The three clusters would overlap a lot. As you tilt the clusters to 45 degrees, what variance the distributions on X lose, the distributions on Y gain. Somehow that makes it more clear to me that GMM makes better use of the two dimensions than KMeans. Thanks
Hey, I need to know more about the working or GMM with EM. could you recommend me some relevant literature? My main idea is to perform multivariate GMM and use it for latent class analysis. Thanks. Smit.
Coudn't download the data from the link. 404 error. Very simple way of explaining the concept of going from Kmeans to GMM. keep up the good work!
Can you please answer this question. I will be thankful to you I used GMM to cluster my data. It has 4 dimensions with 3 clusters. The GMM ran very well, and I got the mean and covariance matrix for each cluster. The problem is I don't know which label belongs to which cluster. In addition, the cluster labels changed whenever I ran the iteration. For example, in the first iteration, the cluster labels were 1, 2 and 3. In the second iteration, the cluster labels were 2,1 and 3, etc. Can I fix the cluster labels? If yes, how do I do it?
Can you please answer this question. I will be thankful to you. I used GMM to cluster my data. It has 4 dimensions with 3 clusters. The GMM ran very well, and I got the mean and covariance matrix for each cluster. The problem is I don't know which label belongs to which cluster. In addition, the cluster labels changed whenever I ran the iteration. For example, in the first iteration, the cluster labels were 1, 2 and 3. In the second iteration, the cluster labels were 2,1 and 3, etc. Can I fix the cluster labels? If yes, how do I do it?
Great!it's very helpful