This article is written by Sonam Srivastava. She is one of the eminent speakers at DataHack Summit 2019, where she will be talking about Portfolio Management using Reinforcement Learning.
Overview
- Regime shift models are a powerful use case of time series modeling in the financial markets
- We’ll discuss what these regime shift models are, their use in the financial market, and their different types
- We’ll also implement a regime shift model in Python in this article
Introduction
Time series is a topic I’ve seen a lot of data scientists run away from. There’s a widespread belief that time series is a complex topic with a variety of equations, hence rendering it a not-so-popular subject.
That’s a fallacy I want to break in this article. Knowing how time series modeling works and being able to utilize it opens up an incredible number of use cases! From being able to predict the price of a product to being able to read financial markets, time series modeling will enhance your data science skillset and portfolio.
We will talk about one such offshoot of time series modeling called Regime Shift Models in this article. We will first understand what regime shift models are and how they fit into the financial market space. We’ll then understand the different types of regime shift models before implementing one in Python.
This article assumes a basic understanding of how times series works. You can check out the below resources to get a quick refresher:
- A Complete Guide to Time Series Forecasting in Python and R
- FREE Course – Create Time Series Forecasts using Python
Table of Contents
- Introduction to Regime Shift Models in Time Series
- Regime Shift Modeling in Financial Markets
- Types of Regime Shift Models
- Markov Switching Autoregressive Model
- Implementing a Markov Switching Autoregressive Model in Python
Introduction to Regime Shift Models in Time Series
Time series modeling is widely used for sequential, serially correlated data like modeling stock prices, analyzing business performance for the next quarter, weather forecasting, signal processing, etc.
A time series is a series of data points indexed (or listed or graphed) in time order. Most commonly, a time series is a sequence taken at successive equally spaced points in time. A quick Google search shows us the sheer number of resources available for time series analysis (finding a meaningful statistic on time series data) and time series forecasting (predicting future values based on past values).
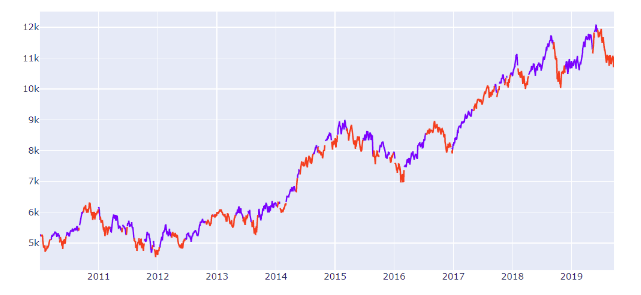
Time Series of Nifty prices with marked Regimes
The simplest approach for time series modeling is the linear autoregressive model.
The autoregressive model specifies that the output variable depends linearly on its own previous values and on a stochastic term (an imperfectly predictable term).
To put this in an equation:
Rt=μ+ β×Rt-1+ σϵ
The stock price has a constant intercept (mean value), slope against previous value, and error term related to variance.
This approach assumes that the characteristics of the time series (mean and variance) stay the same during the whole time period under consideration but that is usually not the case. A time series can change behavior completely from one period to the next due to some structural changes. For example, a stock price series can change its behavior drastically from trending to volatile after a policy or macroeconomic shock.
Regime shift models address this gap in basic time series modelling by segregating the time series into different “states”. These models are also widely known as state-space models in time series literature.
In this article, we will look at the use case of such models for modeling stock prices.
Regime Shift Modeling in Financial Markets
Financial markets can change their behavior abruptly. The behavior of stock prices from one period to the next can be drastically different. So many people try to play the market and fail spectacularly – I’m sure you’ve read about a few examples in the news.
When trying to model these prices, we can see that the mean, variance and correlation patterns of stocks can vary dramatically. This, in financial markets, is usually triggered by fundamental changes in macroeconomic variables, policies or regulations.

For financial models, these models are of immense importance as someone participating systematically in the financial market needs to adapt their trading style and choice of instruments based on the market regimes to get a consistent performance. Choosing the right set of assets or sectors in a particular regime can provide significant alpha to a systematic investor. Similarly, for active traders, the optimal stop-loss limits and the choice of technical indicators can vary from one regime to another.
In this article, we will focus more on the modeling aspects of these time series models.
Types of Regime Shift Models
Regime shift models are also called state-space models or dynamic linear models in time series modeling nomenclature.
The idea here is that time series exists in two or more states, each characterized by their own probability distributions, and the transition of one state to another is governed by another process or variable.
There are three types of models that are popularly used:
- Threshold models
- Predictive models
- Markov switching autoregressive models
Threshold Models
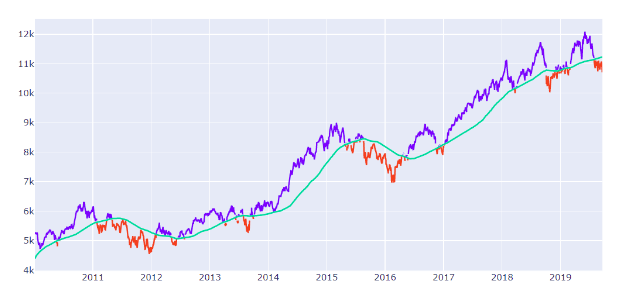
An observed variable crossing a threshold triggers a regime shift. For example, the prices moving below the 200-day moving average trigger a ‘bearish regime’ or a downtrend. This can be visualized by looking at the chart of Nifty and the 200-day moving average below:
Predictive Models
Data scientists can use prediction methods like machine learning algorithms to take macroeconomic variables like GDP, unemployment, long term trends, bond yields, trade balance, etc. as input and predict the next period risk.
When the model predicts a high-risk number, the market is in a risky regime. When the model predicts a low-risk number, the market is in a trending regime.
Markov Switching Autoregressive Models
These models assume the regime to be a ‘hidden state’ whose probability and characteristics are estimated using maximum likelihood estimation. We will look into the details of these models below.
Markov Switching Autoregressive Model
The steady-state equation of an asset price is defined as an autoregressive process. This is characterized by the intercept 𝜇, autocorrelation β, and volatility 𝜎, of the process specific to the market regime
Rt=μ+ β×Rt-1+ σϵ
The governing dynamics of the underlying regime, 𝑆𝑡, are assumed to follow a homogenous first-order Markov chain. Here, the probability of the next state depends only on the present state.
We can estimate the transition probabilities from one such state to the next through a Maximum Likelihood Estimator. This attempts to find the parameter values that maximize the likelihood function.
Implementing a Markov Switching Autoregressive Model in Python
Let’s get our hands on some Python code! We will implement a three-state variance Markov switching model for modeling risk regime on the NIFTY Index here. You can download the dataset we’ll be using from here.
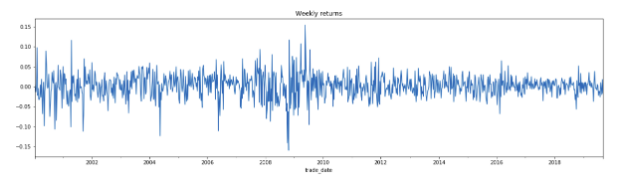
Let’s begin! First, we will import the required libraries and get the returns:
import pandas as pd
import statsmodels.api as sm
from statsmodels.tsa.stattools import adfuller
import matplotlib.pyplot as plt

nifty = pd.read_csv('nifty.csv', index_col=0, parse_dates=True #Get nifty prices
nifty_ret = nifty.resample('W').last().pct_change().dropna() #Get weekly returns
nifty_ret.plot(title='Excess returns', figsize=(12, 3)) #Plot the dataset
Next, we will check for stationarity:
adfuller(nifty_ret.dropna())
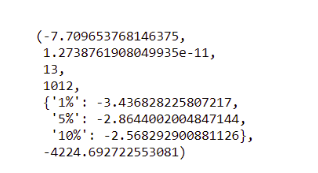
We can see that the series is stationary (as the p-value of the ADFuller test is close to 0) and the model can be fit on it.
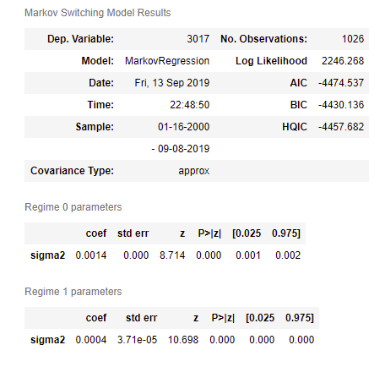
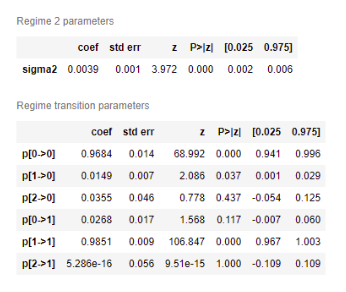
We will now use statsmodels to model 3 variance regimes in Nifty:
#Fit the model
mod_kns = sm.tsa.MarkovRegression(nifty_ret.dropna(), k_regimes=3, trend='nc', switching_variance=True)
res_kns = mod_kns.fit()
res_kns.summary()
Let’s plot the smoothed probabilities of the regimes:
fig, axes = plt.subplots(3, figsize=(10,7))ax = axes[0]
ax.plot(res_kns.smoothed_marginal_probabilities[0])
ax.set(title='Smoothed probability of a low-variance regime for stock returns')ax = axes[1]
ax.plot(res_kns.smoothed_marginal_probabilities[1])
ax.set(title='Smoothed probability of a medium-variance regime for stock returns')ax = axes[2]
ax.plot(res_kns.smoothed_marginal_probabilities[2])
ax.set(title='Smoothed probability of a high-variance regime for stock returns')fig.tight_layout()
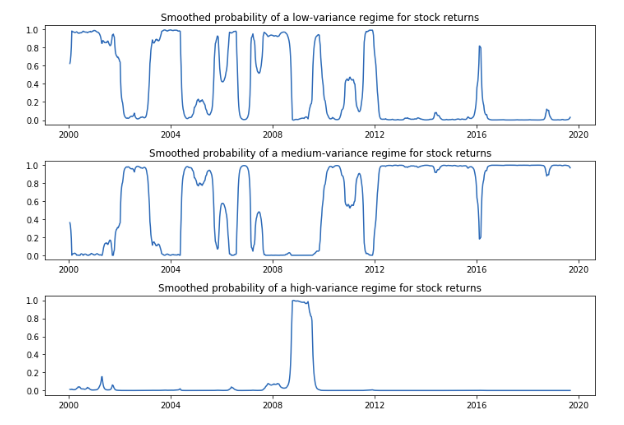
Perfect! We can now use the trained model to forecast the next period state or “regime” to make use of the specific time series model.
End Notes
We saw a simple regime shift model at play in this article. With such a model in place that can forecast the next period risk based on present market conditions, we can take a much more informed bet in the financial markets and adapt our risk appetite accordingly. Such models are a very important building block of an adaptive trading strategy.
I encourage you to go ahead and play around with the code above. You can use a bigger Nifty sample as well. Let me know how it works out for you in the comments section below!
And if you’re new to time series, you should check out the below free course:


Can you please share the code for ploting the graph with the color changing according to regimes (like the first graph)? Thanks!
Hi Sonam, Thank you sharing this application of time series analysis it has given me a lot of value. I believe the plots for the medium-variance and low-variance regimes has been interchanged. Hope to read more of you in the future! - Erik
I found the article amazing. Especially since not many people write about time series. Thank you for doing that. Really helpful.