 There are 11 products on discount.
Introduction
“Statistics is the grammar of Science.” – Karl Pearson
Let’s make that a bit more relevant for us – Statistics is the grammar of “Data” Science. You’ll notice that almost every successful data science professional or analytics professional has a solid understanding of statistics – but does that mean you need a master’s degree in the subject Absolutely not! So what is the fundamental knowledge you must have to be a data science professional? Is it a programming language like Python or R? Is it complex machine learning algorithms? Or is it something a lot more simple?
Just think of the most commonly used tool in most organizations for data analysis. It’s Microsoft Excel! Honestly, Excel is the Swiss Army Knife for data analytics professionals that helps you focus on what’s important (statistics in our case) and handles the rest of the calculations and customizations itself. Excel can help us answer questions like, ‘what is the largest value or minimum value in a set of data,’ as well as plot graphs and even perform regression. This article is for everyone who’s starting their journey into statistics using Excel. We will use 10 key statistical excel functions to answer questions for a dummy sports company, ‘Khelo’, while perusing their data.
Learning Objectives
- Discover how Microsoft Excel can help you manage a business.
- Get familiar with some basic statistical functions that are very handy in data analysis.
- Learn a few intermediate excel formulas and upgrade your analytic skills.
Table of contents
How to Use Microsoft Excel to Manage a Business?
We will be solving a few key questions about our dummy sports equipment and apparel company – Khelo. These are the columns we have in our worksheet:
- Equipment
- Number of items sold
- Cost of each item
- Discount %
- Revenue

In the course of this article, we will be answering the following questions using various Excel functions:
- How many items are at a discount?
- How many items/pieces of equipment are sold by the store?
- What is the number of products sold without a discount?
- Are there any products sold having cost more than 2000 along with a discount rate greater than 50%?
- What is the average number of products sold?
- What is the median of the number of products sold?
- What is the most frequent discount percentage?
- What is the standard deviation of the number of products sold?
- Is there any relationship between the number of products sold and the discount percentage?
Basic Statistical Functions in Excel
MS Excel provides an array of useful statistical functions. Let us begin with some of the basic yet extremely powerful functions. Honestly, you’ll find that you’re using the basic statistical functions 90% of the time, and the rest 10% of your time is taken by intermediate and advanced functions.
We will be talking majorly about the different kinds of count functions here. These are very similar to other functions, such as sum, max, min, and average. Here is list of basic statistical functions in excel given below:
- Count Function
- Counta Function
- Countblank Function
- Countifs Function
Count Function
We use the count function when we need to count the number of cells containing a number. Remember, ONLY NUMBERS! Let’s see the function:
- COUNT(value1, [value2], …)
So, let’s try to find the answer to our first question – How many items were on discount?
There are 11 products on discount.Counta Function
While the count function only counts the numeric values, the COUNTA function counts all the cells in a range that are not blank cells. The function is useful for counting cells containing any type of information, including error values and empty text.
- COUNTA(value1, [value2], …)
We’ll answer the second question using the counta function since it is able to count all the non-empty values – How many items/pieces of equipment are sold by the store?
Countblank Function
The COUNTBLANK function counts the number of empty cells in a range of cells. Cells with formulas that return empty text are also counted here, but cells with zero values are not counted. This is a great function for summarizing empty cells while analyzing any data.
- COUNTBLANK(range)
There are only 2 items not on discount.
Countifs Function
Countifs are one of the most used statistical functions in Excel. The COUNTIFS function applies one or more conditions to the cells in the given range and returns only those cells that fulfill all of the conditions.
- COUNTIFS(criteria_range1, criteria1, [criteria_range2, criteria2]…)
Note: Every new range must have the same number of rows and columns as the criteria_range1 argument. The ranges do not have to be adjacent to each other.
This function seems perfect to answer the fourth question – Are there any products sold having cost more than 2000 along with a discount rate greater than 50%?
Intermediate Statistical Functions in Excel
We will discuss some of the intermediate statistical functions in MS Excel here related to central tendency and dispersion. These functions are very useful in our day-to-day life as an analyst.
We will discuss some of the intermediate statistical functions in MS Excel here related to central tendency and dispersion. These functions are very useful in our day-to-day life as data analysts.Here is list of intermediate statistical functions in excel given below:
- Average Function
- Median Function
- Mode Function
- Standard Deviation Function
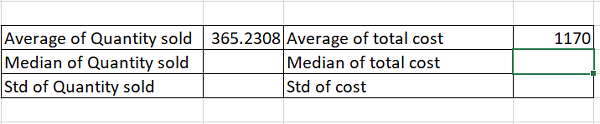
Average Function
The most common function we usually use in our daily lives is the average (or mean). The AVERAGE function simply returns the arithmetic mean of all the cells in a given range:
- AVERAGE(number1, [number2], …)
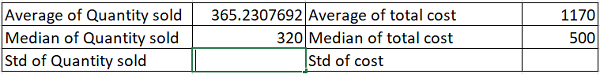
But there’s one simple drawback to using averages – they are prone to outliers. Therefore, they can paint a very unrealistic picture in our analysis. Let’s find out the average number of goods sold:dispersed
We will be doing similar calculations for cost as well.
Median Function
The problem of outliers can be solved by using another function for the central tendency – the median. The median function returns the middle value of the given range of cells. The syntax is quite simple:
- MEDIAN(number1, [number2], …)
We see that the median comes out to be ~ 320, which is pretty close to the average value. It means there is not much fluctuation in our data.
Let’s see if this is the case for the cost of goods:
Mode Function
For numerical values, mean and median usually, suffice, but what about categorical values? Here, mode comes into the picture. Mode returns the most frequent and repeated value in the given range of values:
- MODE.SNGL(number1,[number2],…)
Note: MODE.SNGL returns only a single value, whereas MODE.MULT returns an array of the most commonly occurring values.
Well, this is a simple one. Let’s find the most frequent discount value given by the sports store:
This discount value is 10%.
Standard Deviation Function
Standard Deviation is one of the ways to quantify dispersion. It is a measure of how widely values are dispersed from the average value.
Here, we will be using the STDEV.P function, which is used to calculate standard deviation based on the entire population given as arguments:
- STDEV.P(number1,[number2],…)
Note: The STDEV.P function assumes that its arguments are the entire population. If that’s not the case, you may use the function STDEV.S() function.
For a large sample size, the standard deviation of the population and samples will return approximately similar values. Previously, we calculated the mean and median to get a picture of the central tendency. Let’s find out the standard deviation to see the level of dispersion:
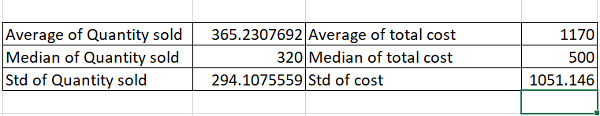
As expected, the standard deviation of the quantity sold is less, meaning that the dispersion is less, whereas the standard deviation for the cost of products is high.
9. Quartiles Functions
This is yet another function with abundant applications in the industry. It helps us divide the population into groups. The QUARTILES.INC returns the quartile of a dataset based on percentile values from 0 to 1, inclusive.
For example, you can use this function to find out the top 25% of your customer base.
- QUARTILE.INC(array, quart)
10. Correlation Function
The CORREL() function is my personal favorite. It provides really powerful insights that are not obvious to the naked eye. The CORREL function returns the correlation coefficient of two cell ranges. But what is that? It basically tells us how strong the relationship is between the two variables.
Note: It does not portray any cause-and-effect relationship.
- CORREL(array1, array2)
The range of correlation values is between -1 and 1.
Let’s head to our final and most interesting question – is there any relationship between the number of goods sold and the percentage of discount?
Well, the correlation comes out to be ~0.8, which is pretty high. It seems these are positively related – meaning the more the discount, the more the quantity sold.
Conclusion
We discussed over 10 beginner and intermediate statistical functions in MS Excel in this article ranging from simple count() to advanced correl(). Statistics is one of the most important tools in the kit of an analyst, and you can achieve a lot of your statistical goals simply using Excel. Practicing these formulas on sample datasets will help you learn to analyze data quickly and efficiently.
I recommend you go through the following additional resources to better your Excel skills:
- 3 Ambitious Excel Charts to Boost your Analytics and Visualization Portfolio
- 5 Useful Excel Tricks to Become an Efficient Analyst
If you are a beginner in the world of analytics and Excel, I’d highly recommend going through these free courses:
Key Takeaways
- Statistical functions are a set of tools in Excel that allow you to perform various statistical calculations on data sets.
- Common statistical functions in Excel: Some of the most commonly used statistical functions in Excel include the AVERAGE function, MAX, MIN, SUM, COUNT, and STDEV.
- Statistical functions in Excel typically require specific syntax in order to be properly executed. This syntax includes the function name, followed by a range of data, and often additional arguments to specify how the calculation should be performed. Some examples are – averageif, sumif, vlookup function, iferror, min function, max function, etc.
Frequently Asked Questions
Q1. What is conditional formatting in excel?
A. Conditional formatting in Excel is a feature that allows you to apply specific formatting, such as font color, fill color, etc., to cells in a worksheet based on given conditions. With conditional formatting, you can quickly highlight specific cells based on their values, making identifying patterns and trends in your dataset easier.
Q2. How to deal with duplicate values in excel?
A. There are several ways in which we can deal with missing values in excel, for example:
1. Remove duplicates: You can use the “Remove Duplicates” feature in Excel to remove duplicates.
2. Highlight duplicates: You can use conditional formatting to highlight duplicates. Select the range of cells that you want to check for duplicates, then go to the “Home” tab, click on “Conditional Formatting,” and select “Highlight Cells Rules” and “Duplicate Values”.
Q3. Can we perform a regression analysis in Excel?
A. Yes, we can perform a regression analysis in Excel using the “Data Analysis” tool under the “Data” tab. This tool allows us to perform simple linear regression, multiple linear regression, and logistic regression.
Product Growth Analyst at Analytics Vidhya. I'm always curious to deep dive into data, process it, polish it so as to create value. My interest lies in the field of marketing analytics.


Nice and interesting statistics, thanks for sharing.
Sir request you to put some light with regards to using excel functions with regards to normal distribution chart and how to do interpolation and extrapolation analysis through excel functions
Thanks u Sir,youve explained well with lots of fun!