Introduction
There have been many articles online showing how to integrate R with Tableau. However, what I observed is that most of them mainly demonstrate how to draw visualizations and plot charts with R-code.
In this article, I will show how we can run a regression analysis and optimize rent price in R, then paste the value to Excel, which will subsequently be connected to Tableau again for further calculations with other fields in the original dataset.
Such kind of seamless integration among 3 different analysis tools can help data analysts to run statistical research in R, then migrate results in Tableau and visualize in digestible ways for business readers.
Table of contents
This article was published as a part of the Data Science Blogathon.
What is Tableau?
Tableau is a powerful and user-friendly data visualization and business intelligence tool. It enables users to transform raw data into insightful, interactive, and easily understandable visual representations, such as charts, graphs, and dashboards.
Features of Tableau
- Drag-and-Drop Magic: You don’t need to be a tech guru with Tableau. Its drag-and-drop interface lets you create stunning data visualizations without wrestling with complex code.
- Chart Galore: Whether it’s bar charts, line charts, pie charts, heat maps, or scatter plots, Tableau has them all. You can choose the chart that best tells your data’s story.
- Interactive Insights: Tableau’s visualizations aren’t just static images. They’re interactive! You can dive deep into the data to uncover hidden trends and patterns.
- Collaboration Made Easy: Sharing and working together on data visualizations is a breeze with Tableau. It’s like teamwork on steroids.
Now, let’s talk about R.
What is R?
R is a powerful open-source programming language and software environment designed for statistical computing and data analysis. Its user-friendly features make it accessible to a wide range of users, from beginners to experts.
Features of R
- Number-Crunching Ninja: R is packed with powerful statistical and mathematical functions. It’s your go-to for complex data analysis tasks.
- Freedom of Open Source: It’s open-source software for everyone to use and share. No budget constraints!
- Community Power: R has an army of users and developers who are passionate about it. They’re continuously improving it and helping each other out.
Setting up R and Tableau Integration and Its Benefits
Integrating R and Tableau is like combining Batman’s gadgets with Superman’s powers. It’s a match made in data heaven, and here’s why it’s a game-changer:
- Enhanced Data Analysis: R brings its supercharged statistical abilities to the Tableau party, making data analysis more precise.
- Flexibility Boost: With R onboard, you have more flexibility to analyze and visualize your data in unique ways.
- More comprehensive data sources: R opens the door to a broader range of data sources, expanding your data universe.
- Speed and Efficiency: R and Tableau working together means smoother performance even with massive datasets.
Example of R and Tableau Integration
Let’s dive into a real-world scenario. Imagine you’re a marketing manager in a retail company and have heaps of customer data. You want to understand your customers better, create tailored marketing campaigns, and prevent them from leaving.
You can use Tableau to create charts showing what your customers buy and when. But to dig deeper, you need R. You can use R to predict which customers might leave or group them into segments for targeted marketing. R’s mathematical magic helps you do that.
Then, you can bring these R results into Tableau, creating captivating dashboards that tell you who’s buying what and who might be slipping away.
Introduction About Dataset Used and Business Requirements
The dataset in this example is extracted from the Capstone project within “Excel to MySQL: Analytic Techniques for Business”. This is a table containing information about properties for rent of a company, with information about short-term rent occupancy rate and the average nightly rent price. We also have data about the price at the 10th percentile and 90th percentile of similar properties in the same region.
Raw data can be found in this link.
Our business requirement is to find an optimized price for each property so that revenue can be maximized. Since revenue is a function of occupancy rate*nightly rent price*365 (assuming that the property can be rented throughout the year), we need to express occupancy rate as a function of nightly rent price, which can be done by simple linear regression
The next task is to run the R optim function, just like we use Solver in Excel, for each Property, or each row in the dataset.
With optimized price and predicted occupancy rate, we can then calculate the total gross profit for the company and do many other analyses.
Connect R with Tableau
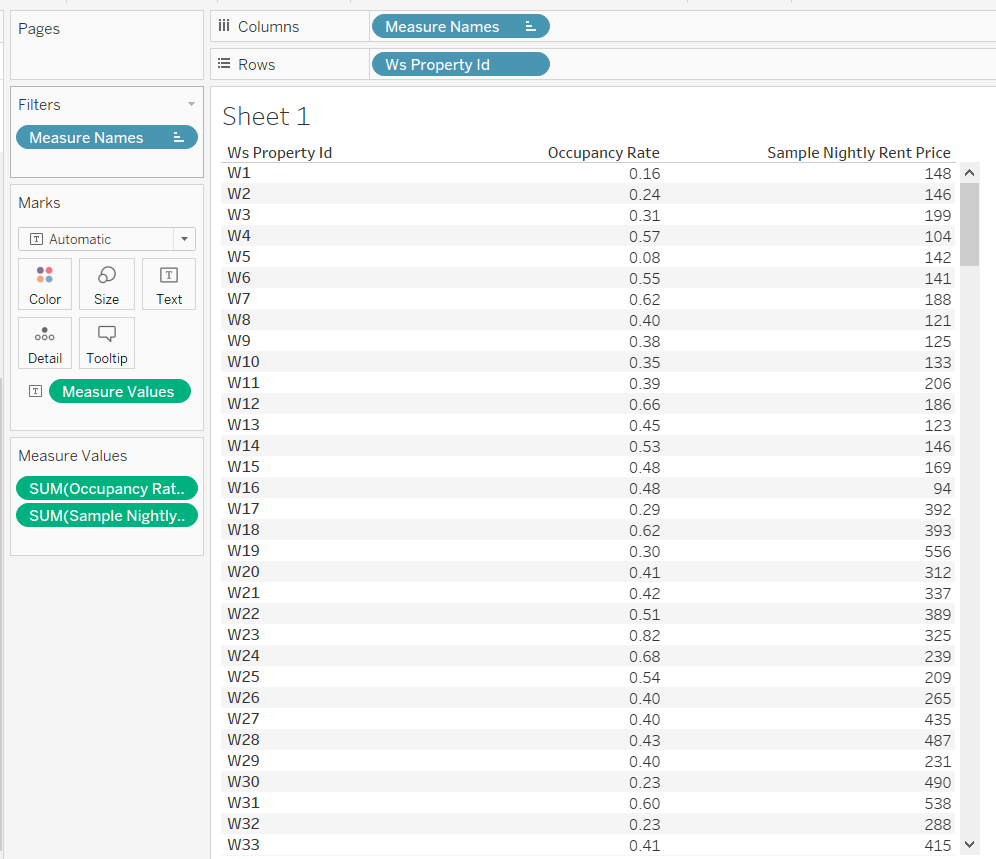
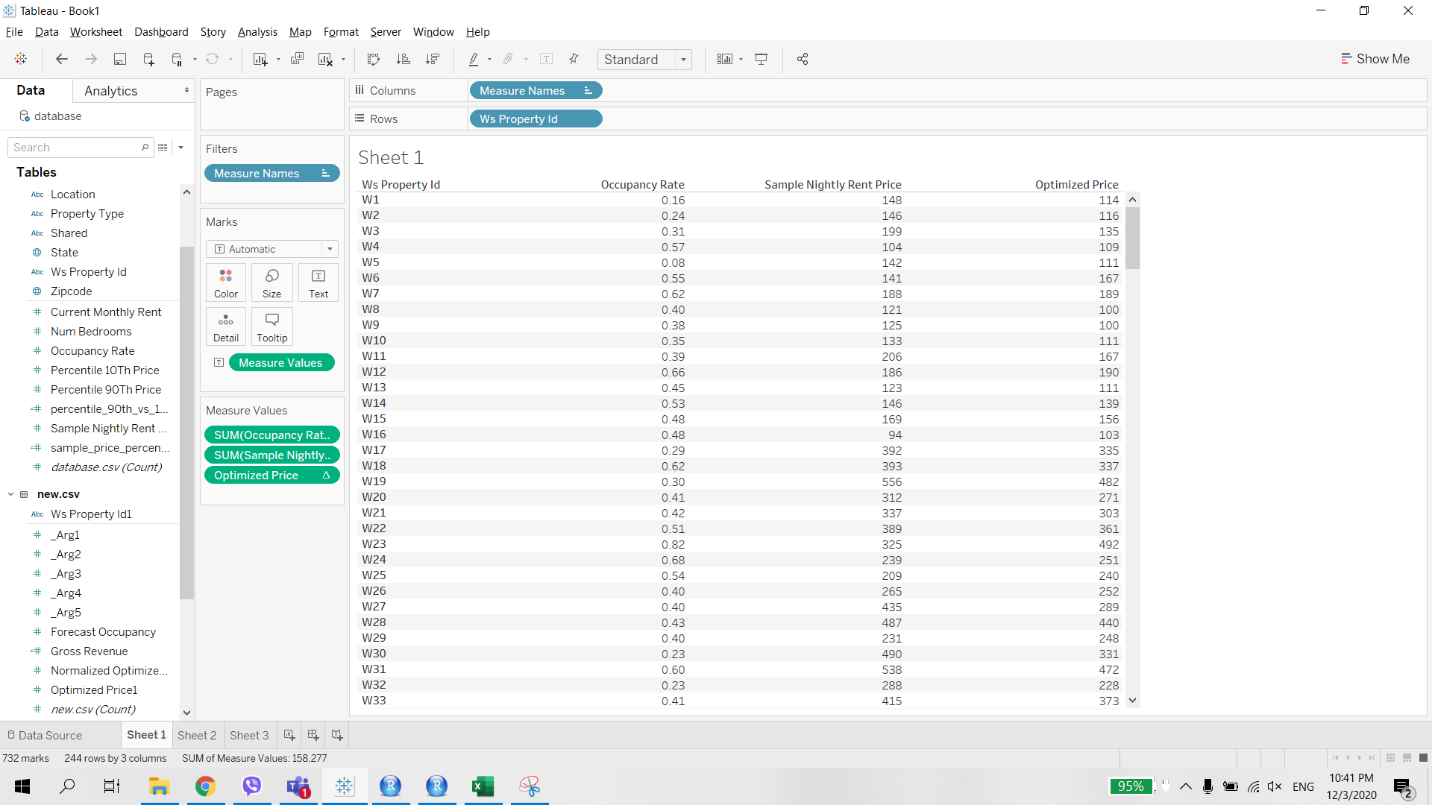
Here is the first look at the dataset after loading it into Tableau. Now I want to add another column showing the optimized price for each property.
We must first connect Tableau with R.
Before we connect R with Tableau, make sure your R console has installed Rserve already.
library("Rserve")

Rserve()
Now, R should print ‘Starting Rserve…’. If you observe this output, then R is reaching out to Tableau for a connection.
2) Open Tableau & click on Help > Settings & Performance > Manage External Service Connections.
3) In the dialog box that opens, choose ‘localhost’ for Server and type ‘6311’ for Port.
4) Then, click on Test Connection
Now, you should get a dialog box stating, ‘Successfully connected to the R serve service’. It means that you are ready to use R with Tableau
Create a calculated field running R code in Tableau
Create a Calculated Field and paste the below code:
SCRIPT_REAL(
"df <- data.frame(.arg1,.arg2,.arg3,.arg4,.arg5)

model <-lm(data=df,.arg1 ~ .arg2)

Create revenue function.
revenue <- function(data,par) {
par_vs_10th <- par-data$.arg3
normalized_price <-0.1+0.8*par_vs_10th/data$.arg5
fcst_occupancy <-coef(model)['(Intercept)']+coef(model)['.arg2']*normalized_price
fcst_st_revenue <-fcst_occupancy*365*par
fcst_st_revenue
}

Run optim for each row in df. Find the value of "par"-rent price-that can optimize revenue function
for (i in 1:nrow(df))
{df[i,'optimized_price'] <-optim(122,revenue,data=df[i,],method='L-BFGS-B', control=list(fnscale=-1),lower=df[i,'.arg3']) }

#return optimized price as output for calculated field
df$optimized_price",

sum([OccupancyRate]),
avg([sample_price_percentile]),
avg([Percentile10Th Price]),
avg([Percentile 90Th Price]),
avg([percentile_90th_vs_10th]),
attr([Ws Property Id]))
R-code must be written under function like SCRIPT_REAL, which returns numeric values. There are other similar R-functions in Tableau such as SCRIPT_BOOL and SCRIPT_INT, depending on the values you want to retrieve.
Before running, we must create a table: df<-data.frame(.arg1,.arg2,…)
.arg1, .arg2… are the fields from data sources in Tableau. They are the bolded words in the code. .arg1 is the Occupancy Rate, .arg2 is the sample_price_percentile.
The R_code will be written within brackets (” “). The final line of code: df$optimized_price will determine the return value for this calculation.
For detailed explanation about running optim and linear regression in R, please refer to this link.
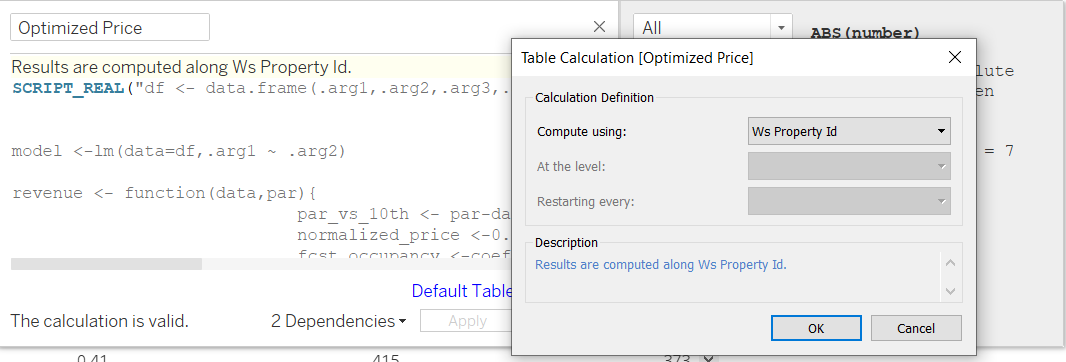
This calculation is a table calculation. Make sure that it is computed along the Property ID.
Let’s create a view to see this measure.
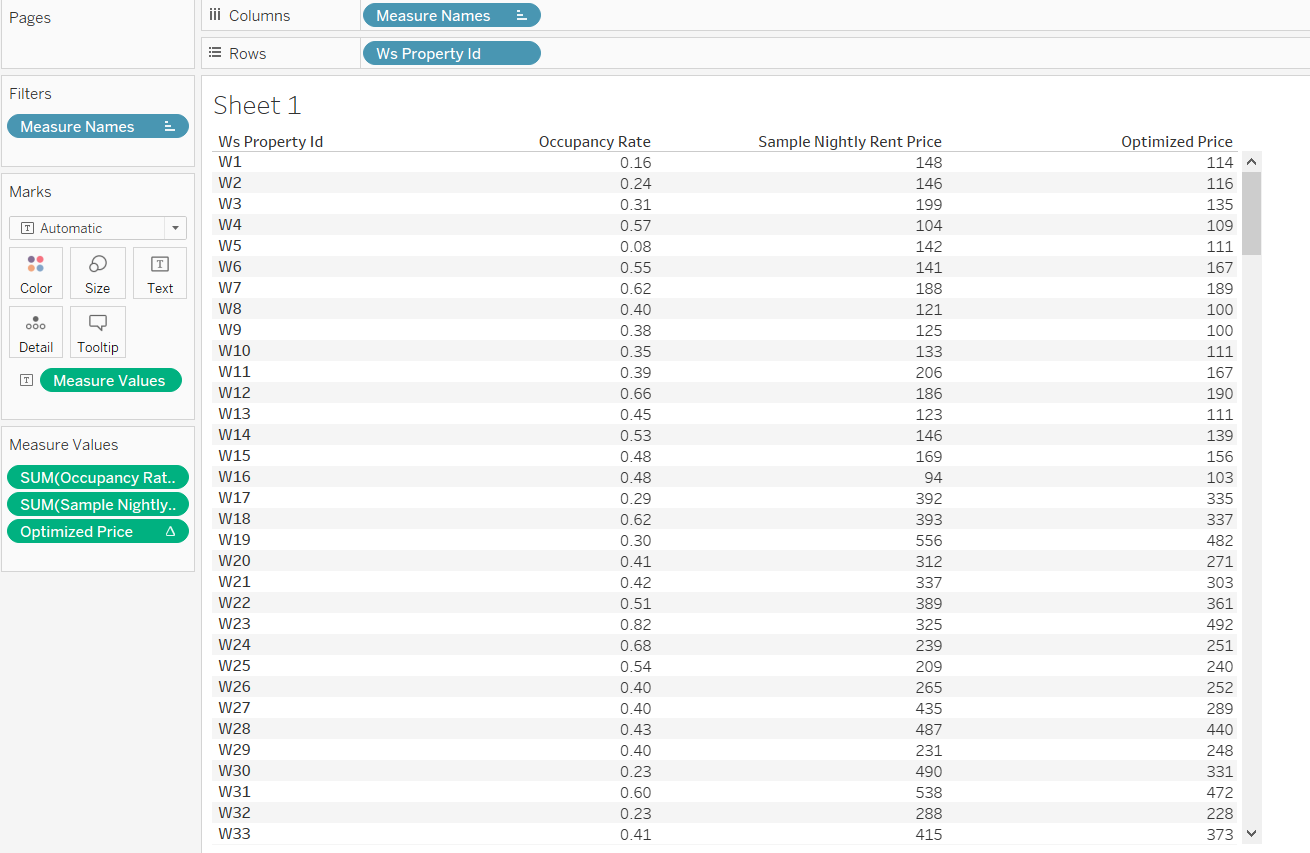
Now we have optimized price for each property.
However, a problem now occurs. This measure is a table calculation and we can only have one single value per property when observing it in a table. We cannot embed it inside another calculation.
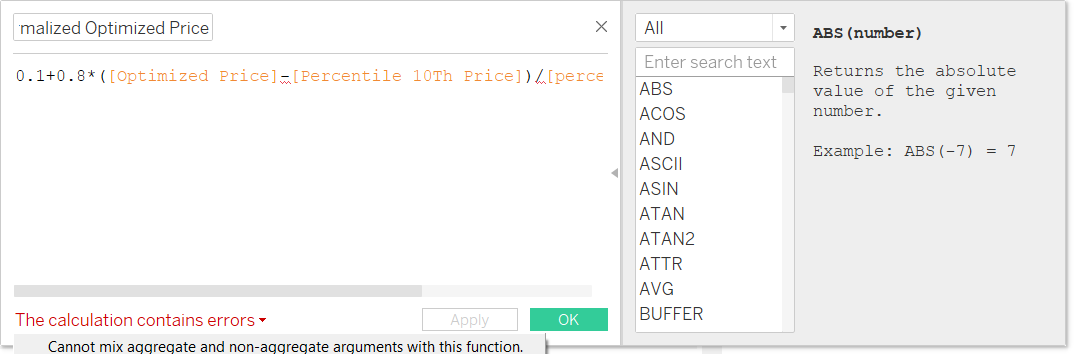
For example, I want to normalize the optimized price into percentile value using below formula:
0.1+0.8*(Optimized Price-Percentile 10th Price)/(percentile 90th_vs_10th)
Tableau will trigger an error, saying that we cannot mix an aggregate measure with non-aggregate value. This is really inconvenient and inflexible, since we may want to leverage an R-coded calculation for many more measures.
In order to mitigate this issue, I have come up with a workaround solution: write the R-optimized values into a csv or excel file, then join this new dataset with the original data source in Tableau for other visualizations or measures creation.
Final Integration
Let’s create another calculation field in Tableau, called as Script. This time we will not return a numeric value, but will write outputs to an external CSV file. In my example, I write to CSV for simplicity, but you can also write to an xlsx file if prefer.
SCRIPT_REAL(
"df <- data.frame(.arg1,.arg2,.arg3,.arg4,.arg5)
model <-lm(data=df,.arg1 ~ .arg2)
revenue <- function(data,par){
par_vs_10th <- par-data$.arg3
normalized_price <-0.1+0.8*par_vs_10th/data$.arg5
fcst_occupancy <-coef(model)['(Intercept)']+coef(model)['.arg2']*normalized_price
fcst_st_revenue <-fcst_occupancy*365*par
fcst_st_revenue
}
for (i in 1:nrow(df)) {df[i,'optimized_price'] <-optim(122,revenue,data=df[i,],method='L-BFGS-B', control=list(fnscale=-1),lower=df[i,'.arg3']) }
df$normalized_optimized_price<-0.1+0.8*(df$optimized_price-df$.arg3)/(df$.arg5)
#Create a new dataframe, replacing .arg2(sample_percentile_price) with the normalized optimized price
new <-data.frame(.arg2=df$normalized_optimized_price)
#Predict the occupancy rate based on optimized price and add as a new column to df
df['Forecast Occupancy']=predict.lm(model, newdata=new)
#Add Property ID to df
df['Ws Property Id']=.arg6
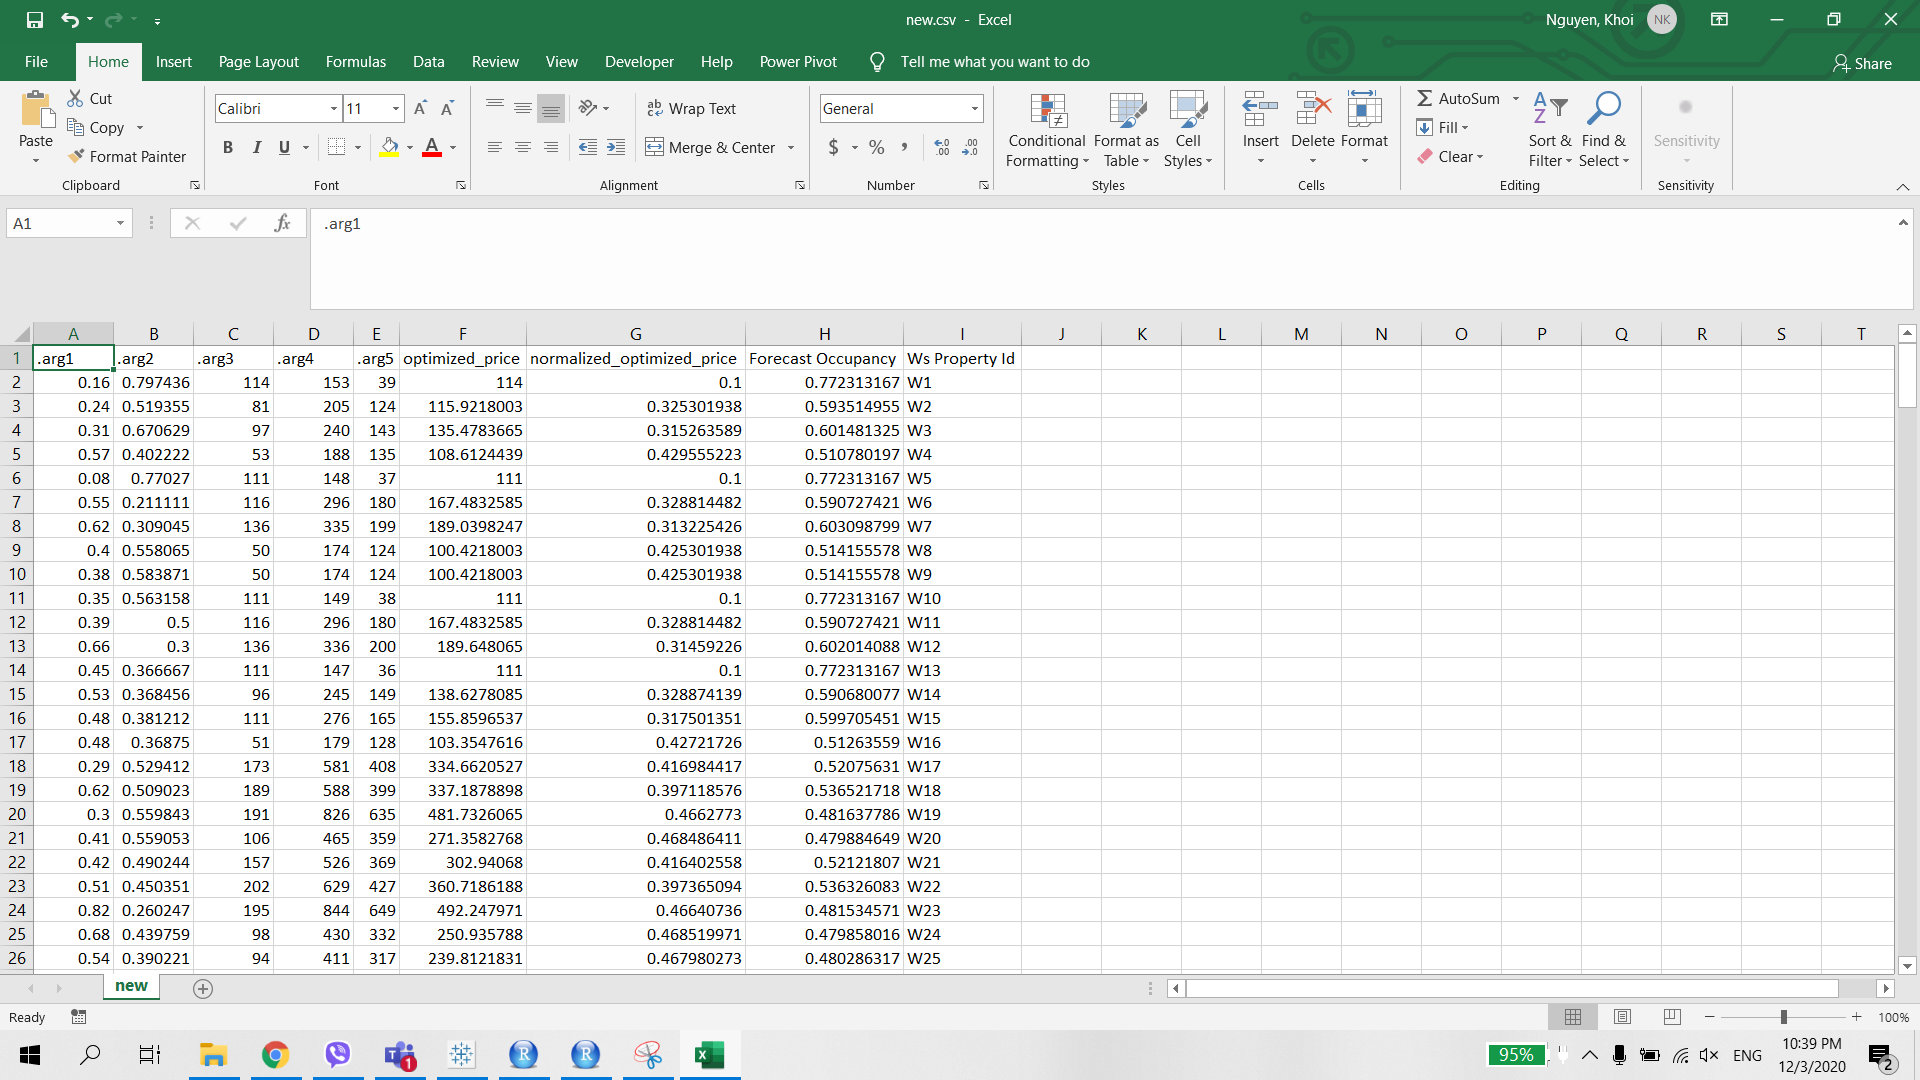
#Write df to a csv file
write.table(df,'D:/Documents/Business Analytics/4. Visualization/Business Capstone/Blogathon/new.csv',sep=',',row.names=FALSE,quote=FALSE,col.names = TRUE)
",
sum([Occupancy Rate]),
avg([sample_price_percentile]),
avg([Percentile 10Th Price]),
avg([Percentile 90Th Price]),
avg([percentile_90th_vs_10th]),
attr([Ws Property Id]))The next step is to create a new Sheet, called Sheet 2 for instance. Then drag Property ID and Script measure to Detail in Mark card.
You should see a message like the following:
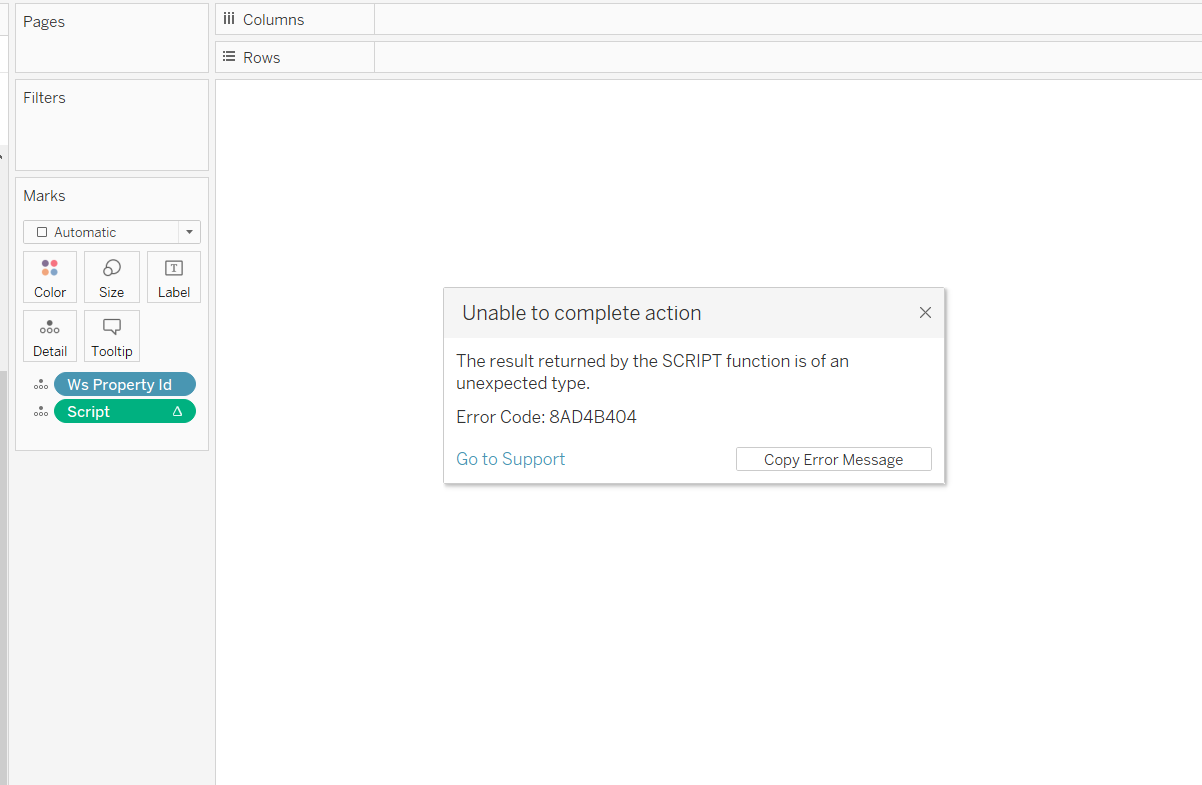
Just ignore that error message. Open the folder you specified in the Script calculation and you will see a new CSV file has just been created.
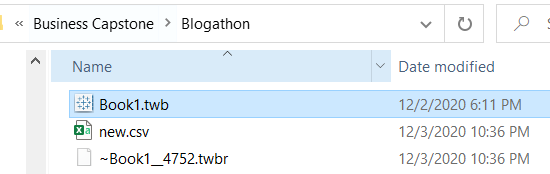
Our next task is simpler, just connect Tableau workbook with this csv file and blend it with the original data source, based on the foreign key: WS Property ID.
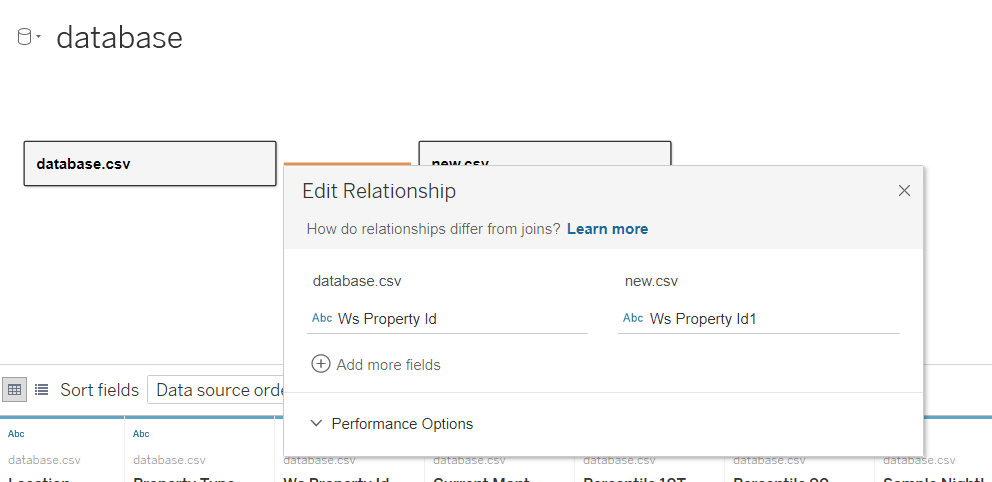
Now in the Data Pane, there is a new dataset readily available for use.
Since we have Optimized Price and Forecast Occupancy Rate as normal fields, we can use them for further calculations without any issues related to aggregate level as previously.
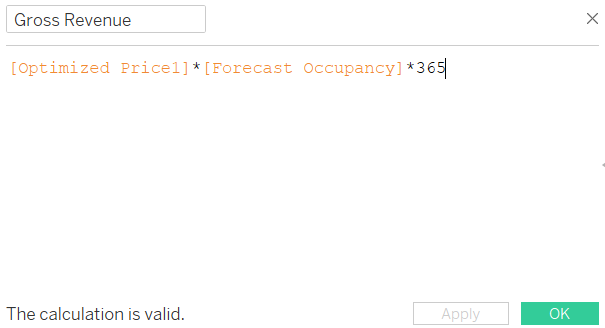
Suppose that I want to create a measure called Gross Revenue= Optimized Price * Occupancy Rate *365. The calculation is now valid.
In the future, in case there are changes to the training data (sample nightly price), or you add more features to the linear model. Simply open Sheet 2 again to reactivate the process and retrieve new outputs.
Conclusion
The ability to write code in R in a calculation makes Tableau become more flexible than its rival-Power BI in terms of connecting with external data analysis platforms. By combining Tableau, Excel and R, we can utilize the power of many tools simultaneously for our analytical practices.
Do you have any other ideas and use cases regarding using Python and R in Tableau? Feel free to comment in this article.
Frequently Asked Questions
Q1. What are R and Tableau used for?
A. R is a powerful statistical analysis and data modeling tool, while Tableau is a data visualization tool. Together, they’re used for in-depth data analysis, creating stunning visualizations, and making data-driven decisions.
Q2. What’s the difference between Tableau and R?
A. Tableau specializes in data visualization with an easy drag-and-drop interface, while R is a programming language for statistical computing. Tableau helps you see data, and R enables you to analyze it.
Q3. How can I run R scripts in Tableau?
A. To run R scripts in Tableau, create a calculated field in Tableau using the R SCRIPT function, which allows you to embed R code. This way, you can combine the power of R with Tableau’s visualization capabilities.
Q4. How do I connect R to Tableau Desktop?
A. To connect R to Tableau Desktop, install the “Reserve” package in R and configure Tableau to use it. Then, you can set up a connection in Tableau to interact with R scripts.
Q5. How do I import data from R to Tableau?
A. You can import data from R to Tableau by using the “R SCRIPT” function in Tableau calculated fields. This function lets you execute R code and bring the results into your Tableau visualization.


