This article was published as a part of the Data Science Blogathon.
Introduction
Performance optimization is an important concern in any data science project. Since most of the project runs on cloud platforms, there is always a cost factor associated with computational resources. We aim to write production codes in an optimized way and build machine learning models that are effective and performance-friendly.
But how do we measure the performance of a block of code or a machine learning model? Most of the time, developers only measure the time a code takes to run and chooses the one that runs quickly. However, many a time, it becomes imperative to check how much memory is being utilized so that we can maneuver the code to meet the system requirement.
Performance Measurement metrics
We should measure the performance of blocks of python code in a project by recording the execution time and by finding the amount of memory being used by the block. This will help us to know the size of the system required to run the application and also get an idea of the duration of the run. In this article, we will discuss the implementation of various logics using 2 different ways and measuring the performance using time and tracemalloc libraries.
Implementation
1. Import Packages
Below are the packages that are used in this demo. The tracemalloc module used here gives the statistics on allocated memory blocks and also computes the differences between two snapshots to detect memory leaks. I have used get_traced_memory() to get the current size and peak size of memory blocks.
import tracemalloc
import pandas as pd
import dask.dataframe as dd
import time
2. Defining function to use tracemalloc
The first function is to stop the tracing, if any, and to start the fresh tracing. This ensures that the tracing of 2 code blocks doesn’t interfere with each other. The second function is to find the peak size in MB of a block of code that was traced.
def tracing_start():
    tracemalloc.stop()
    print("nTracing Status : ", tracemalloc.is_tracing())
    tracemalloc.start()
    print("Tracing Status : ", tracemalloc.is_tracing())
def tracing_mem():
    first_size, first_peak = tracemalloc.get_traced_memory()
    peak = first_peak/(1024*1024)
    print("Peak Size in MB - ", peak)
3. Comparing the peak size and time required for the run
The tracing functions created above is called to measure the peak memory size and the time required to run the commands.
A. Operations on elements of a list
The following blocks show the operation on each element of the list and store the result into a new list.
Method – 1
Python Code:
import tracemalloc
import pandas as pd
import dask.dataframe as dd
import time

def tracing_start():
    tracemalloc.stop()
    print("nTracing Status : ", tracemalloc.is_tracing())
    tracemalloc.start()
    print("Tracing Status : ", tracemalloc.is_tracing())
def tracing_mem():
    first_size, first_peak = tracemalloc.get_traced_memory()
    peak = first_peak/(1024*1024)
    print("Peak Size in MB - ", peak)

tracing_start()
start = time.time()
sq_list = []
for elem in range(1,1000):
  sq_list.append(elem + elem**2)
#print(sq_list)
end = time.time()
print("time elapsed {} milli seconds".format((end-start)*1000))
tracing_mem()
Method – 2
tracing_start()
start = time.time()
sq_list1 = [elem + elem**2 for elem in range(1,1000)]
#print(sq_list1)
end = time.time()
print("time elapsed {} milli seconds".format((end-start)*1000))
tracing_mem()
#Result
Tracing Status :  False
Tracing Status :  True
time elapsed 7.999420166015625 milli seconds
Peak Size in MB -  0.04634556579589844
B. Concatenation of string
The following blocks show the 2 different methods to concatenate strings
Method – 1
tracing_start()
start = time.time()
list_word = ["Quantify","performance","improvements","in","Python"]
s = ""
for substring in list_word:
    s += substring + " "
print(s)
end = time.time()
print("time elapsed {} milli seconds".format((end-start)*1000))
tracing_mem()
#Result
Tracing Status :  False
Tracing Status :  True
time elapsed 0.0 milli seconds
Peak Size in MB -  0.015248298645019531
Method – 2
tracing_start()
start = time.time()
list_word = ["Quantify","performance","improvements","in","Python"]
s = ""
" ".join(list_word)
print(s)
end = time.time()
print("time elapsed {} milli seconds".format((end-start)*1000))
tracing_mem()
#Result
Tracing Status :  False
Tracing Status :  True
time elapsed 0.0 milli seconds
Peak Size in MB -  0.01273345947265625
C. Removing duplicate elements from a list
The following blocks show the 2 different methods to remove duplicate elements from a list
Method – 1
tracing_start()
start = time.time()
a = [2,3,3,2,5,4,4,6,5,7,7,3,3,4,7,2,5,2,5]
b = []
for i in a:
    if i not in b:
        b.append(i)
print(b)
end = time.time()
print("time elapsed {} milli seconds".format((end-start)*1000))
tracing_mem()
#Result
Tracing Status :  False
Tracing Status :  True
[2, 3, 5, 4, 6, 7]
time elapsed 0.0 milli seconds
Peak Size in MB -  0.0144805908203125
Method – 2
tracing_start()
tracing_start()
start = time.time()
a = [2,3,3,2,5,4,4,6,5,7,7,3,3,4,7,2,5,2,5]
set_list = list(set(a))
print(set_list)
end = time.time()
print("time elapsed {} milli seconds".format((end-start)*1000))
tracing_mem()
#Result
Tracing Status :  False
Tracing Status :  True
[2, 3, 5, 4, 6, 7]
time elapsed 0.0 milli seconds
Peak Size in MB -  0.012772964477539062
4. Reading a CSV file into dataframe and group by operation
The following blocks show the 2 different methods to read the CSV file into a dataframe. The first one is using pandas and the second is using dask. Dask is a flexible library for parallel computing in Python. The documentation can be found at https://dask.org/.
Method – 1
tracing_start()
start = time.time()
df = pd.read_csv("F:/Av_Hackathon/DataScienceJobs/ds_jobs.csv")
df_by_discipline = df.groupby('major_discipline').count()[['enrollee_id']]
end = time.time()
print("time elapsed {} milli seconds".format((end-start)*1000))
tracing_mem()
#Result
Tracing Status :  False
Tracing Status :  True
time elapsed 136.00635528564453 milli seconds
Peak Size in MB -  4.769265174865723
Method – 2
tracing_start()
start = time.time()
df = dd.read_csv("F:/Av_Hackathon/DataScienceJobs/ds_jobs.csv")
df_by_discipline = df.groupby('major_discipline').count()[['enrollee_id']]
end = time.time()
print("time elapsed {} milli seconds".format((end-start)*1000))
tracing_mem()
#Result
Tracing Status :  False
Tracing Status :  True
time elapsed 88.00387382507324 milli seconds
Peak Size in MB -  1.2262592315673828
Conclusion
In this article, we discussed how to find the memory utilized while running a block of code in Python. We discussed the snippets of 4 use cases and listed down the time taken for execution and peak memory being consumed. The result is summarized below –
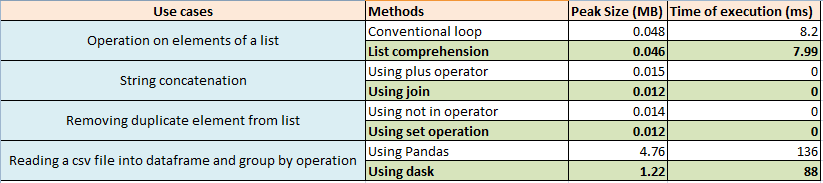
- List comprehension is better than conventional loops. They consume less memory and also lesser execution time
- Using join for string concatenation is better than using the plus operator in terms of memory being consumed. For smaller sets, the time taken for execution in both the methods is almost the same.
- The set operation is a memory-optimized method for removing the duplicates from a list.
- Dask framework helps in performing faster dataframe operations like reading the CSV file into a dataframe and grouping the data. It consumes 3 times lesser memory and 1.5 times lesser execution time.
Quantitative metrics like these help to focus on the right areas of improvement. If there is a limitation of the computational capabilities of resources being used in the project, we should choose the block that consumes fewer resources while executing. However, if there is an SLA (service level agreement) involved in a project and there is a hard stop on the completion time, we should choose a block that has the least execution time.
The media shown in this article are not owned by Analytics Vidhya and is used at the Author’s discretion.


