Introduction
This article explores R programming for data analysis and visualization, focusing on clustering techniques. R, developed in 1993, is a language designed for statistical computing and graphics. The article discusses supervised and unsupervised learning methods, with a particular emphasis on K-means clustering. It demonstrates the application of K-means clustering in R using the Iris dataset in R, highlighting the importance of data visualization in modern analysis and the real-world applications of clustering in various industries.
Learning Objectives:
- Understand the basics of R programming for data analysis
- Differentiate between supervised and unsupervised learning
- Learn the K-means clustering algorithm and its implementation in R
- Explore data visualization techniques using R
This article was published as a part of the Data Science Blogathon.
Table of contents
What is R?
R is a language primarily used for data analysis, made for statistics and graphics in 1993. It is a very analysis-friendly language. Its software is RStudio which is freely available and can be downloaded through:
Data Visualizations using R
In the current times, images speak louder than numbers or word analysis. Yes, graphs and plots are more catchy and relatable to the human eye. Here is where the importance of R data analysis comes in. Clients understand graphical representation of their growth/product assessment/distribution better. Thus, data science is booming nowadays and R is one such language that provides flexibility in plotting and graphs as it has specific functions and packages for such tasks. RStudio is software where data and visualization occur side by side making it very favorable for a data analyst. You can use various functions in R to create different types of visualizations, such as scatterplots, boxplots, bar graphs, line graphs, line charts, and heat maps. For example, you can plot a histogram using the hist() function, and you can customize the visualization by providing parameters like xlab() (x-label), color, and border.
Taking advantage of this convenience let us further proceed into an Unsupervised learning method – Clustering in R.
Supervised and Unsupervised learning
There are two types of learnings in data analysis: Supervised and Unsupervised learning.
Supervised learning – Labeled data is an input to the machine which it learns. Regression, classification, decision trees, etc. are supervised learning methods.
Example of supervised learning:
Linear regression is where there is only one dependent variable. Equation: y=mx+c, y is dependent on x.
Eg: The age and circumference of a tree are the 2 labels as input dataset, the machine needs to predict the age of a tree with a circumference as input after learning the dataset it was fed. The age is dependent on the circumference.
The learning thus is supervised on the basis of the labels.
Unsupervised learning – Unlabeled data is fed to the machine to find a pattern on its own. Clustering is an unsupervised learning method having models – KMeans, hierarchical clustering data in r, DBSCAN, etc.
Visual representation of clusters shows the data in an easily understandable format as it groups elements of a large dataset according to their similarities. This makes analysis easy. Unsupervised learning is not always accurate, and it is a complex process for the machine because the data is unlabeled.
Let us now continue to a clustering in R example using the Iris flower dataset.
Clustering in R
Clusters are a group of the same items or elements like a cluster of stars or a cluster of grapes or a cluster of networks and so on…
Real-world use of clustering:
E-commerce sites use unsupervised learning to form groups of customers based on their profile, such as age, gender, spending, and regularity. It is useful in marketing and sales as it helps cluster the target audience for the product. Spam filtering in mails and many more are real-world applications of clustering in R.
Clustering in R refers to the assimilation of the same kind of data in groups or clusters to distinguish one group from the others(gathering of the same type of data). This can be represented in graphical format through R. We use the KMeans model in this process.
What is the K Means algorithm?
K Means is a clustering algorithm that repeatedly assigns a group amongst k groups present to a data point according to the features of the point. It is a centroid-based clustering method.
We decide the number of clusters, select cluster centers randomly farthest from one another, calculate the distance between each data point and center using Euclidean distance, and assign the data point to the cluster whose center is nearest to that point. We repeat this process until the center of clusters does not change and data points remain in the same clustering data in r.
All this is theory but in practice, R has a clustering package that calculates the above steps.
Step 1
I will work on the Iris dataset which is an inbuilt dataset in R using the Cluster package. It has 5 columns namely – Sepal length, Sepal width, Petal Length, Petal Width, and Species. Iris is a flower and here in this dataset 3 of its species Setosa, Versicolor, Verginica are mentioned. We will clustering data in r the flowers according to their species. The code to load the dataset:
data("iris")
head(iris) #will show top 6 rows only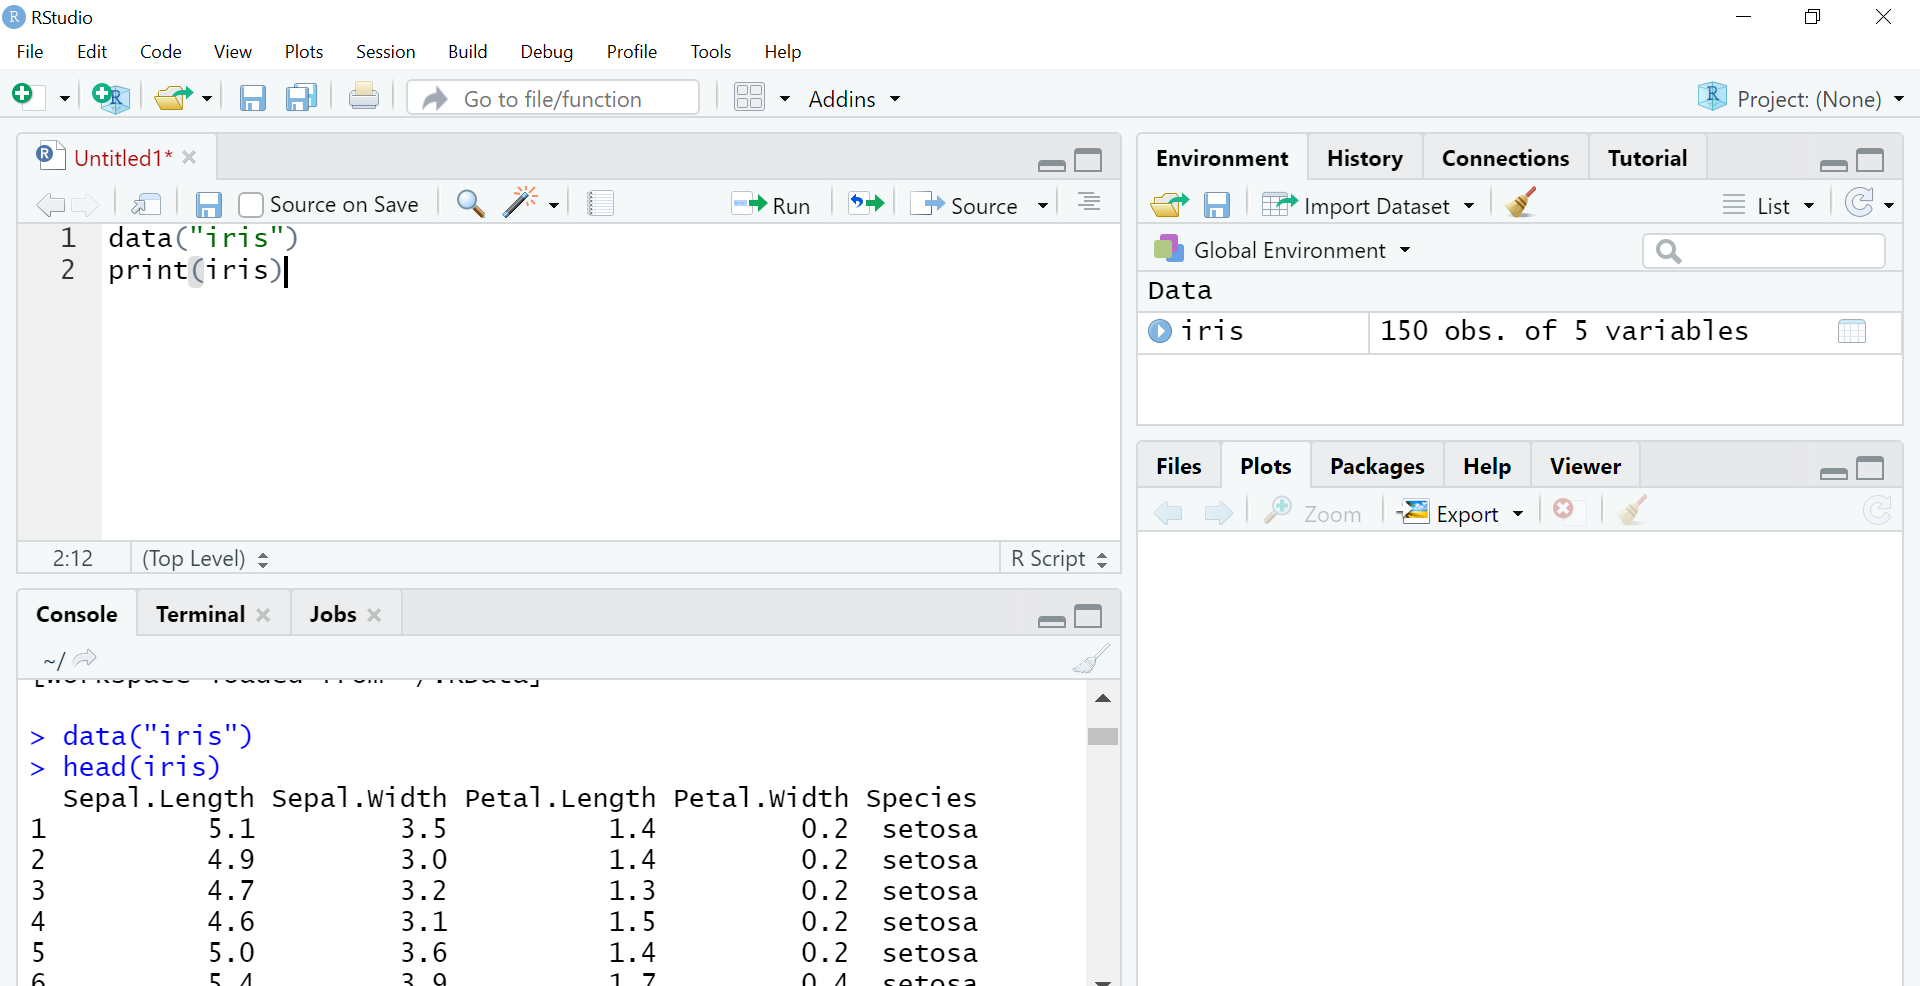
Step 2
The next step is to separate the 3rd and 4th columns into separate object x as we are using the unsupervised learning method. We are removing labels so that the machine will use the huge input of petal length and petal width columns to perform clustering unsupervised.
x=iris[,3:4] #using only petal length and width columns
head(x)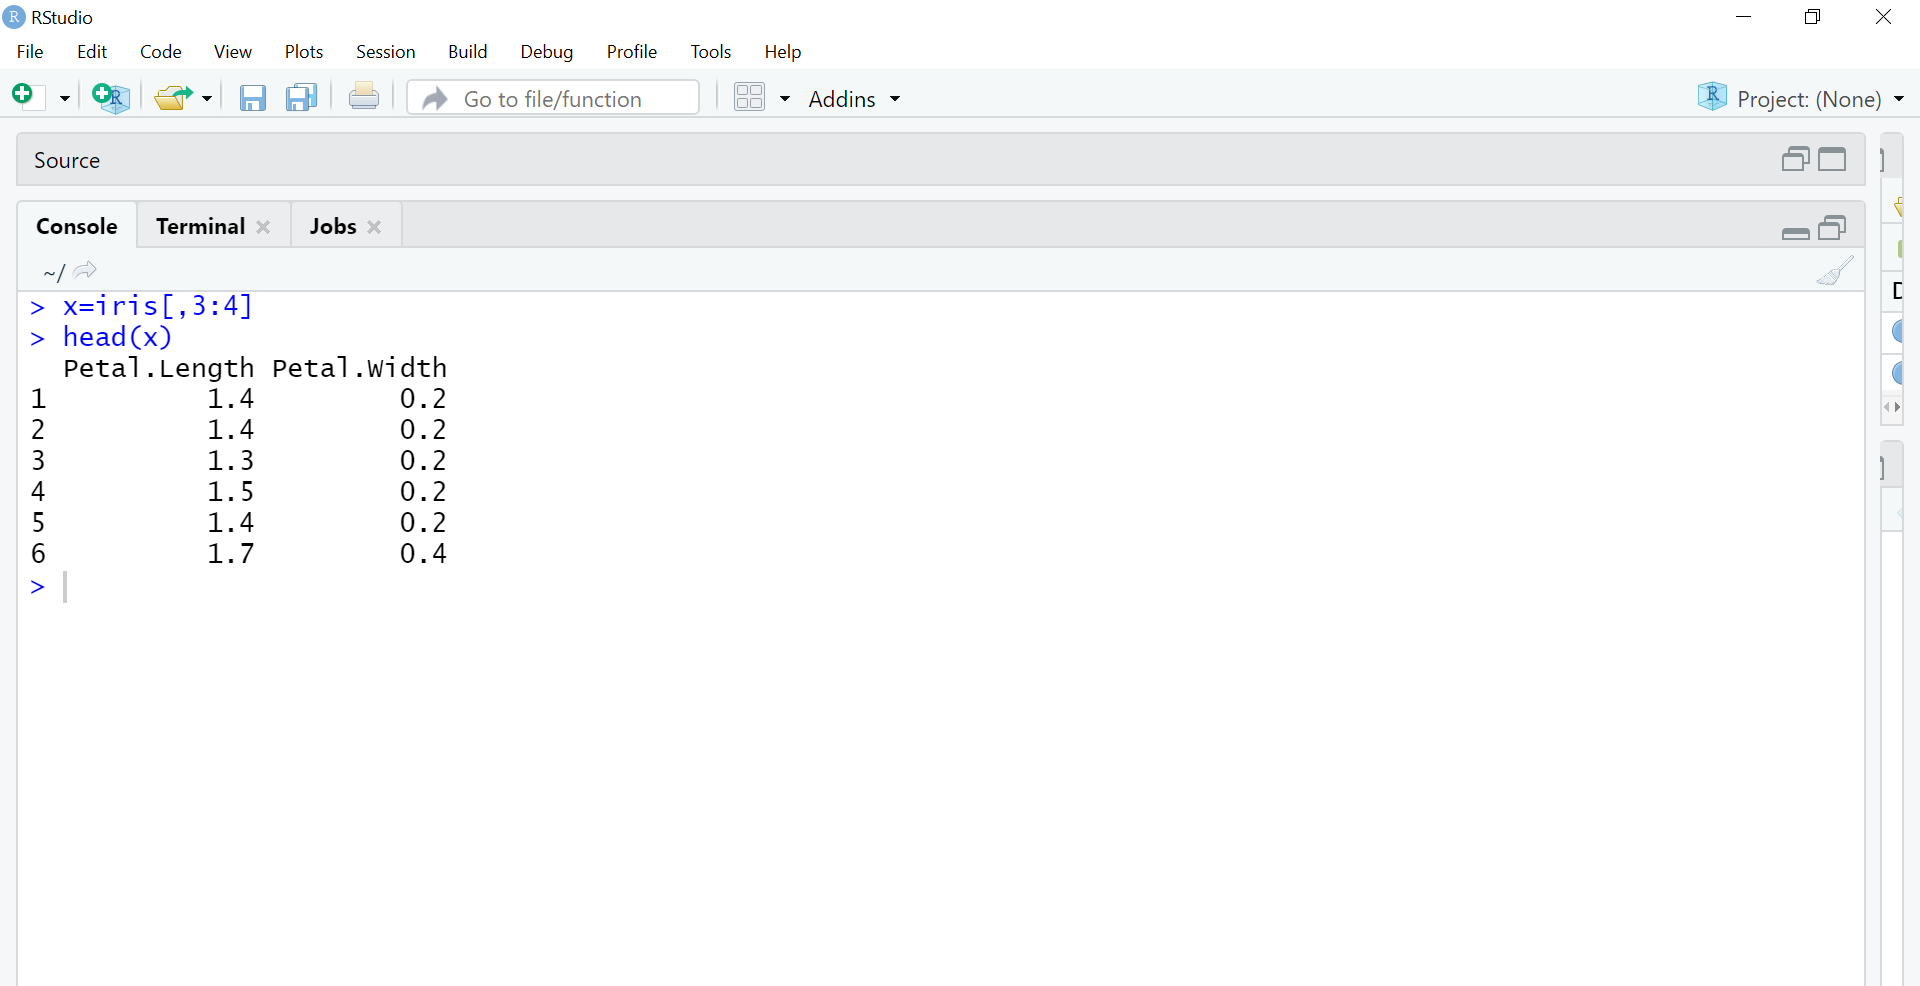
Step 3
The next step is to use the K Means algorithm. K Means is the method we use which has parameters (data, no. of clusters or groups). Here our data is the x object and we will have k=3 clustering data in r as there are 3 species in the dataset.
Then the ‘cluster’ package is called. Clustering in R is done using this inbuilt package which will perform all the mathematics. Clusplot function creates a 2D graph of the clusters.
model=kmeans(x,3)
 library(cluster)
clusplot(x,model$cluster)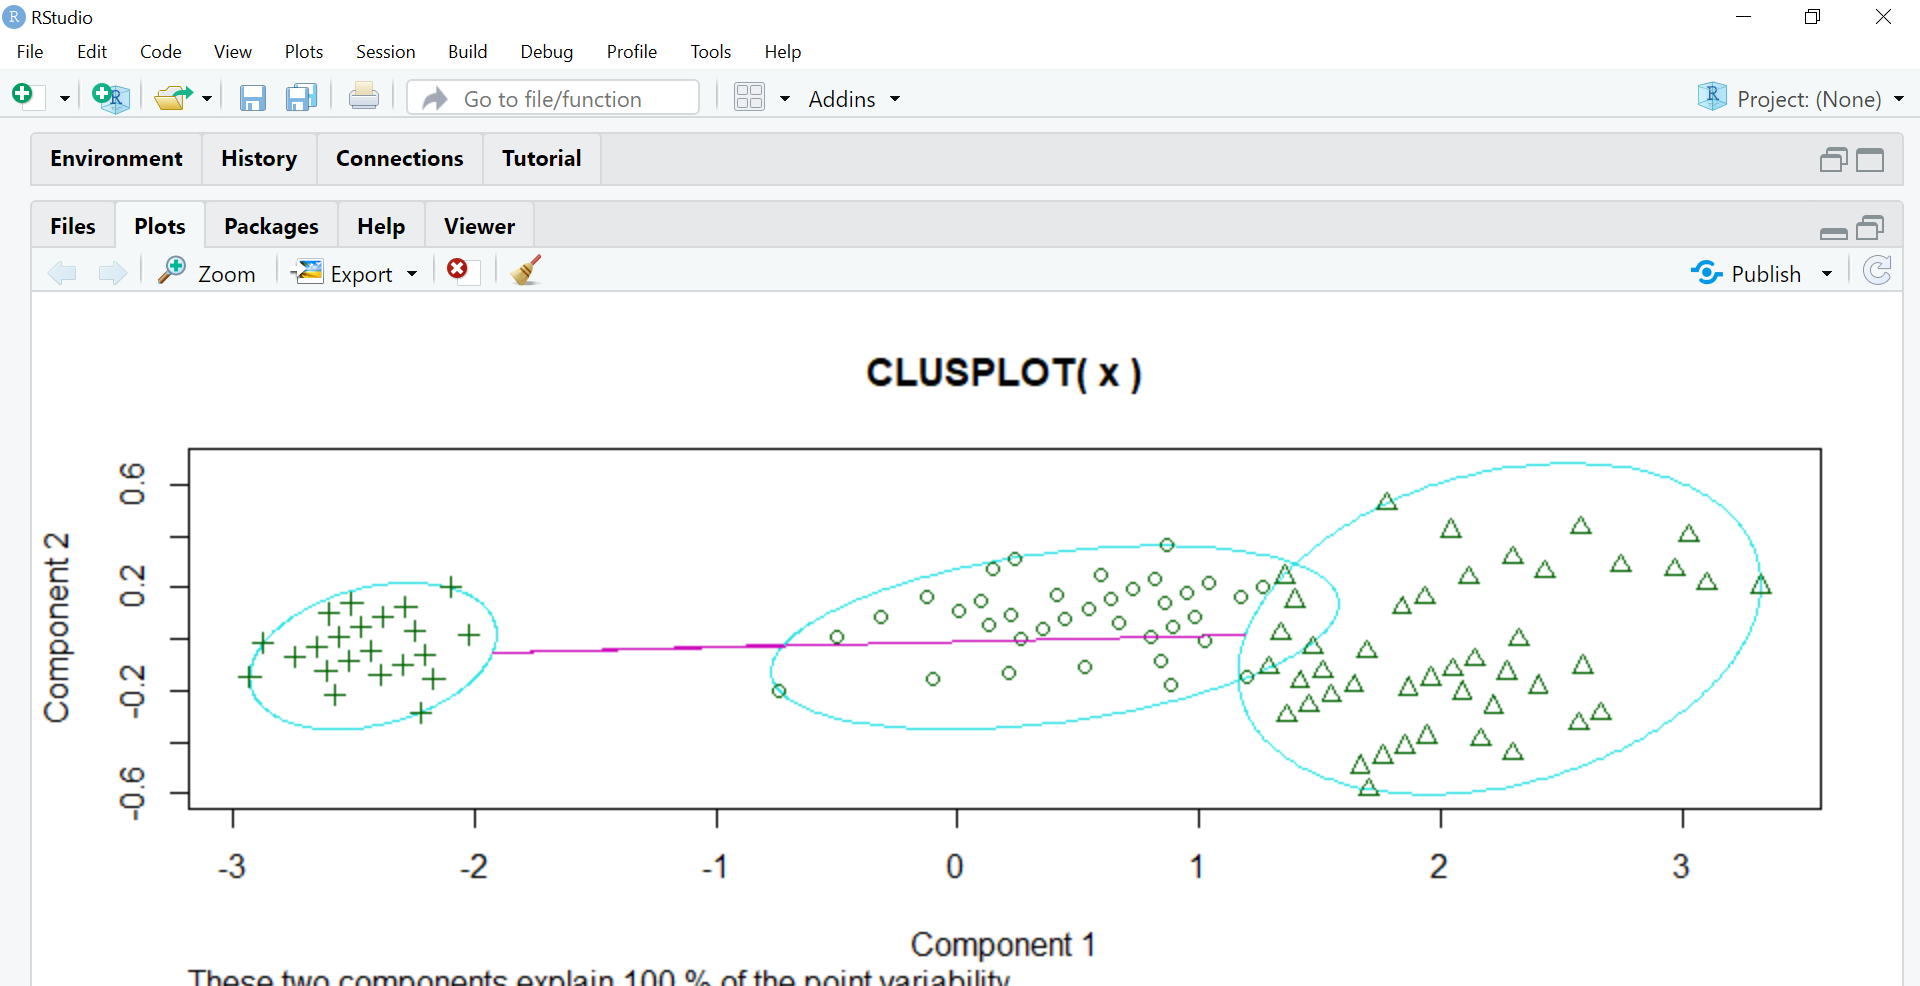
Component 1 and Component 2 seen in the graph are the two components in PCA (Principal Component Analysis) which is basically a feature extraction method that uses the important components and removes the rest. It reduces the dimensionality of the data for easier KMeans application. All of this is done by the cluster package itself in R.
These two components explain 100% variability in the output which means the data object x fed to PCA was precise enough to form clear clusters using KMeans and there is minimum (negligible) overlapping amongst them.
Step 4
The next step is to assign different colors to the clusters and shading them hence we use the color and shade parameters setting them to T which means true.
clusplot(x,model$cluster,color=T,shade=T)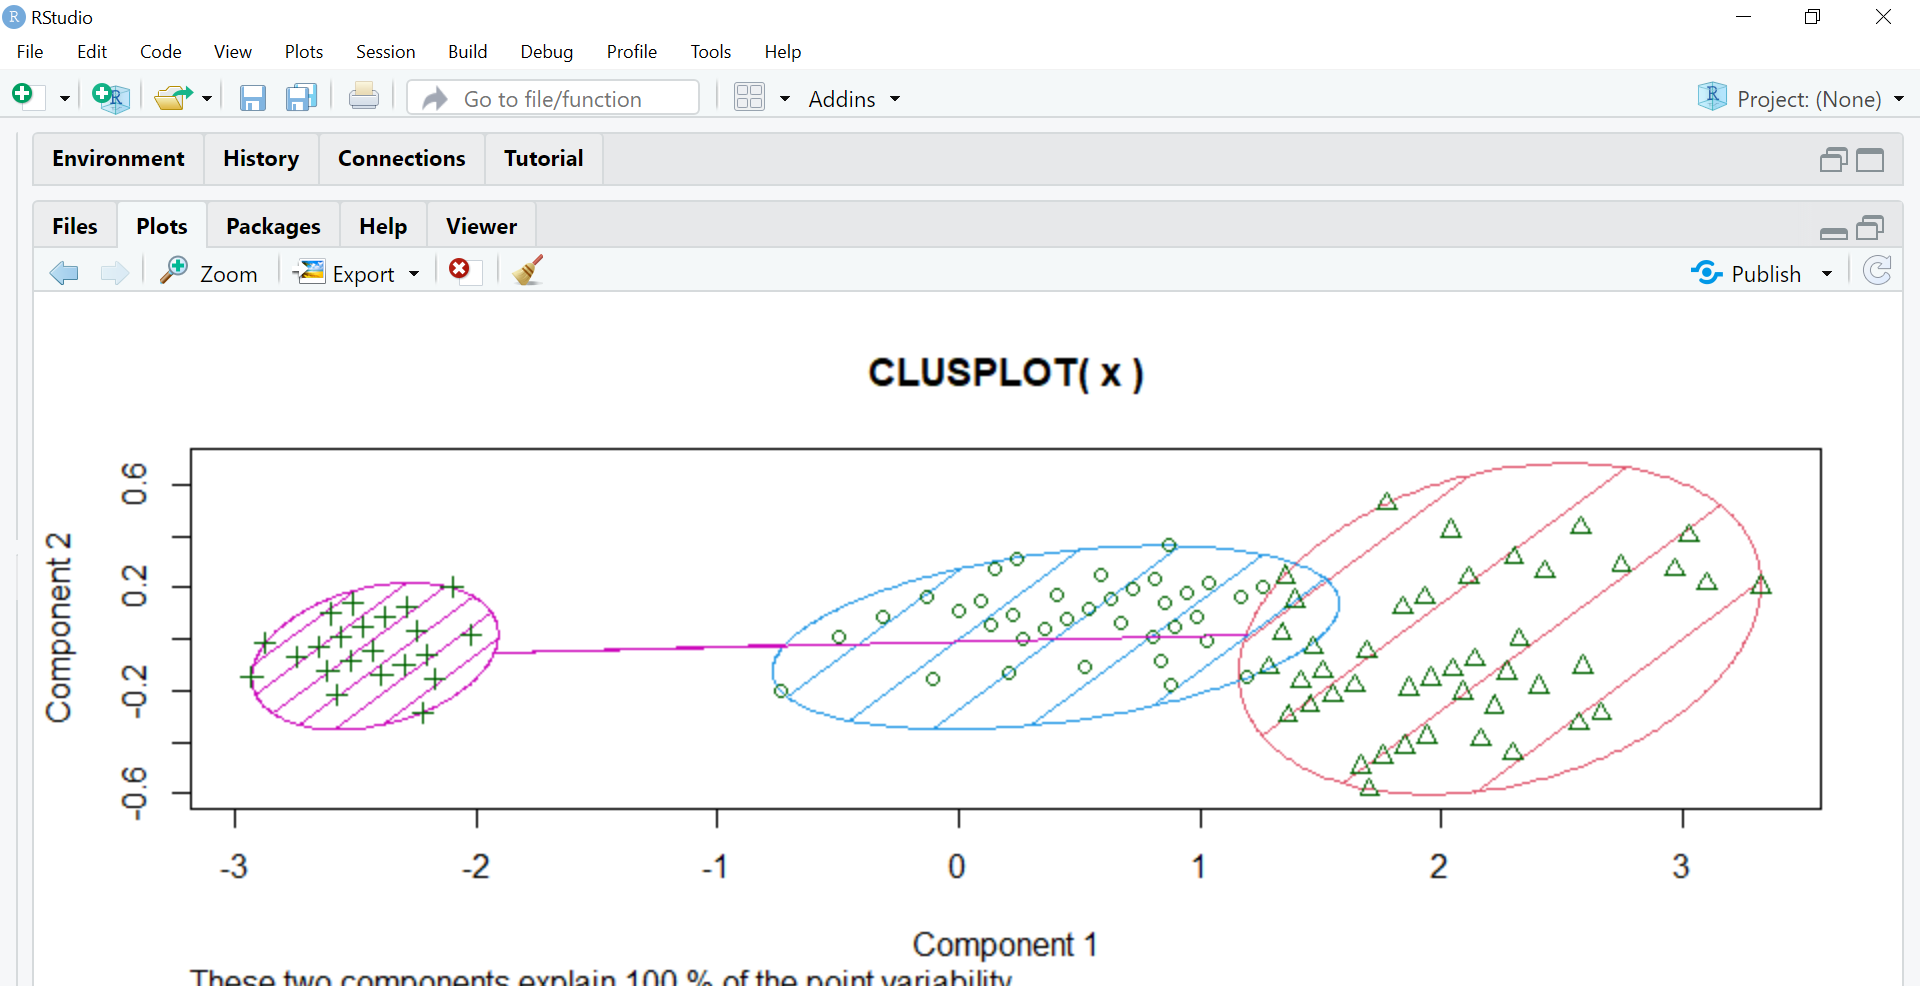
Importing datasets in R:
dataset <- read.csv("path.csv")
View(dataset)
attach(dataset)
Conclusion
Clustering in R provides a powerful method for grouping similar data points, with applications ranging from e-commerce to spam filtering. The article demonstrated the implementation of K-means clustering using the Iris dataset, showcasing R’s capabilities in data analysis and visualization. By leveraging R’s built-in functions and packages, data scientists can efficiently perform complex analyses and create insightful visualizations. As data-driven decision-making becomes increasingly important across industries, mastering clustering techniques in R can be a valuable skill for analysts and researchers.
Key Takeaways:
- R is a powerful tool for data analysis and visualization
- Clustering is an unsupervised learning method for grouping similar data points
- K-means is a popular clustering algorithm implemented easily in R
- Data visualization enhances understanding and interpretation of analysis results
Thanks for taking out time and reading this article ,feel free to comment on what further can be improved as learning is an everyday processafterall..
The media shown in this article are not owned by Analytics Vidhya and is used at the Author’s discretion.
Frequently Asked Questions
Q1. What is clustering in R?
A. Clustering in R involves grouping data points into clusters based on their similarities. By using various algorithms, you can identify patterns and structures within the data.
Q2. How to make a cluster in R?
A. To create a cluster in R, you can use functions like kmeans(), hclust(), or cluster::pam(). First, load the data, then apply the chosen clustering function, and finally, visualize the clusters to interpret the results.
Q3. What are the best clustering methods in R?
A. The best clustering methods in R include K-means, hierarchical clustering, and Partitioning Around Medoids (PAM). Each method has its strengths, so you should choose based on your specific data and goals.
Q4. What are the three types of clustering?
A. The three types of clustering are hierarchical clustering, partitional clustering, and density-based clustering. Hierarchical clustering builds a tree of clusters, partitional clustering divides data into non-overlapping subsets, and density-based clustering identifies clusters based on data density.


Heartly thanks for such nice explanation in simple wording with example.
I came to this page to solve a small problem and your code did exactly what I'd hoped It just worked with my 25000 row dataset! Many thanks Duncan