Rise of Microsoft Power BI as a Data Analytics powerhouse
Microsoft Power BI is a collection of apps, software services, tools, and connectors that work together to work on our data sources to turn them into insights, visually attractive, and immersive reports.
.jpg)
But, before we look into Power BI, let us first understand what is Business Intelligence.
Business Intelligence: What is it all about?
Data Science deals with data and is very useful these days in analytics and Machine Learning. Data Science and Exploratory Data Analysis help in finding out patterns and observations which are useful and productive. EDA explores the data and helps us discover whole new aspects of data. In the field of business, the primary equation is to maximize profits and increase the efficiency of the business. Business intelligence deals with working out through the data and drawing out useful managerial knowledge and intelligence.
The data and conclusions if used properly can increase the profitability of a company many times. Business intelligence improves the business framework overall and optimizes it for producing desired or predicted output.
BI software like Power BI and Tableau help with working with data and derive actionable insights from them. BI software has key features like Data Visualization, visual analytics, dashboards, and such. BI software automates a lot of things, they end the need for spreadsheet and static presentation tools. Using BI tools, businesses can take action using data, and identifying issues, trends are made easy.
The purpose of BI is to aid in controlling the vast flow of business information inside and outside of the organization by first identifying and then processing the information into condensed and useful managerial knowledge and intelligence. BI helps organizations to have the knowledge and draw conclusions from relevant data on business deciding factors such as standards and variations in production, demand, quality control, and the organization’s internal mechanisms. The ultimate goal of BI in any company is to make optimal decisions at all tiers of the company as efficiently and quickly as possible.
Dealing with the problem using BI Software has the following steps:
1. Data Collection
2. Data Storage
3. Data Cleaning
4. Data Analysis
5. Visualization
6. Decision
Using Power BI is very easy, all these steps can be implemented without much problem in Power BI.
Our data can be a simple Excel file or even a complex Cloud data warehouse, Power Bi will let us easily connect to our data sources, visualize, analyze and understand our data. Power BI can not only help us generate quick analytics and insights, but also help on large-scale real-time analytics on large amounts of data. So, Power BI can help in the data analytics needs not just for a small scale business, but also for large scale corporations dealing with a very huge amount of data.
What is Microsoft Power BI?
Power BI consist of three main parts :
1. Power Bi Desktop – A Microsoft Windows desktop application.
2. Power BI service – An online Software as a Service (SaaS) application.
3. Power BI mobile application – Available as Andriod and iOS application.
These services help one use them in a sort of ecosystem, to consume business insights in a way that serves them the best. Usually, a report is created on the Power BI desktop, it is then shared across the Power BI service so that other members of the team can use/ view them. Users who are on the move can also view them on the Power BI mobile applications. The dashboards and reports are very easily shared, and thus it is very easy for people on the team and external stakeholders (if any) to view them.
This makes it the ideal tool for Analyst firms, Consultancy companies, or other Service-based companies who work with various clients and teams.
The whole Power BI structure is broken into the basic building blocks of Power BI. These are the basic components that constitute the whole working of Power BI.
They are :
1. Visualizations
2. Datasets
3. Reports
4. Dashboard
5. Tiles
Datasets are a collection of data that Power BI uses to create its visualizations. Visualizations are a visual representation of those data, they can be plots, charts, maps, or any other way to visually interpret the data. A report is a collection of visualizations that appear together on one or more pages.
The dashboard is a collection of reports that we create for sharing purposes. A tile is a single visualization on a dashboard.
All these tools can be used to create visually pleasing dashboards that can be worked on by a large team together. Power BI service and Power BI desktop work together seamlessly. On the desktop version, the UI is simple, it looks like any other Microsoft Software like PowerPoint or Word. Any user having experience in working with MS Office will find the Power BI UI very easy to start with.
Data Analytics can be overwhelming for many people, but the simple but powerful features of Power BI make it a tool that can be used for a wide variety of applications.
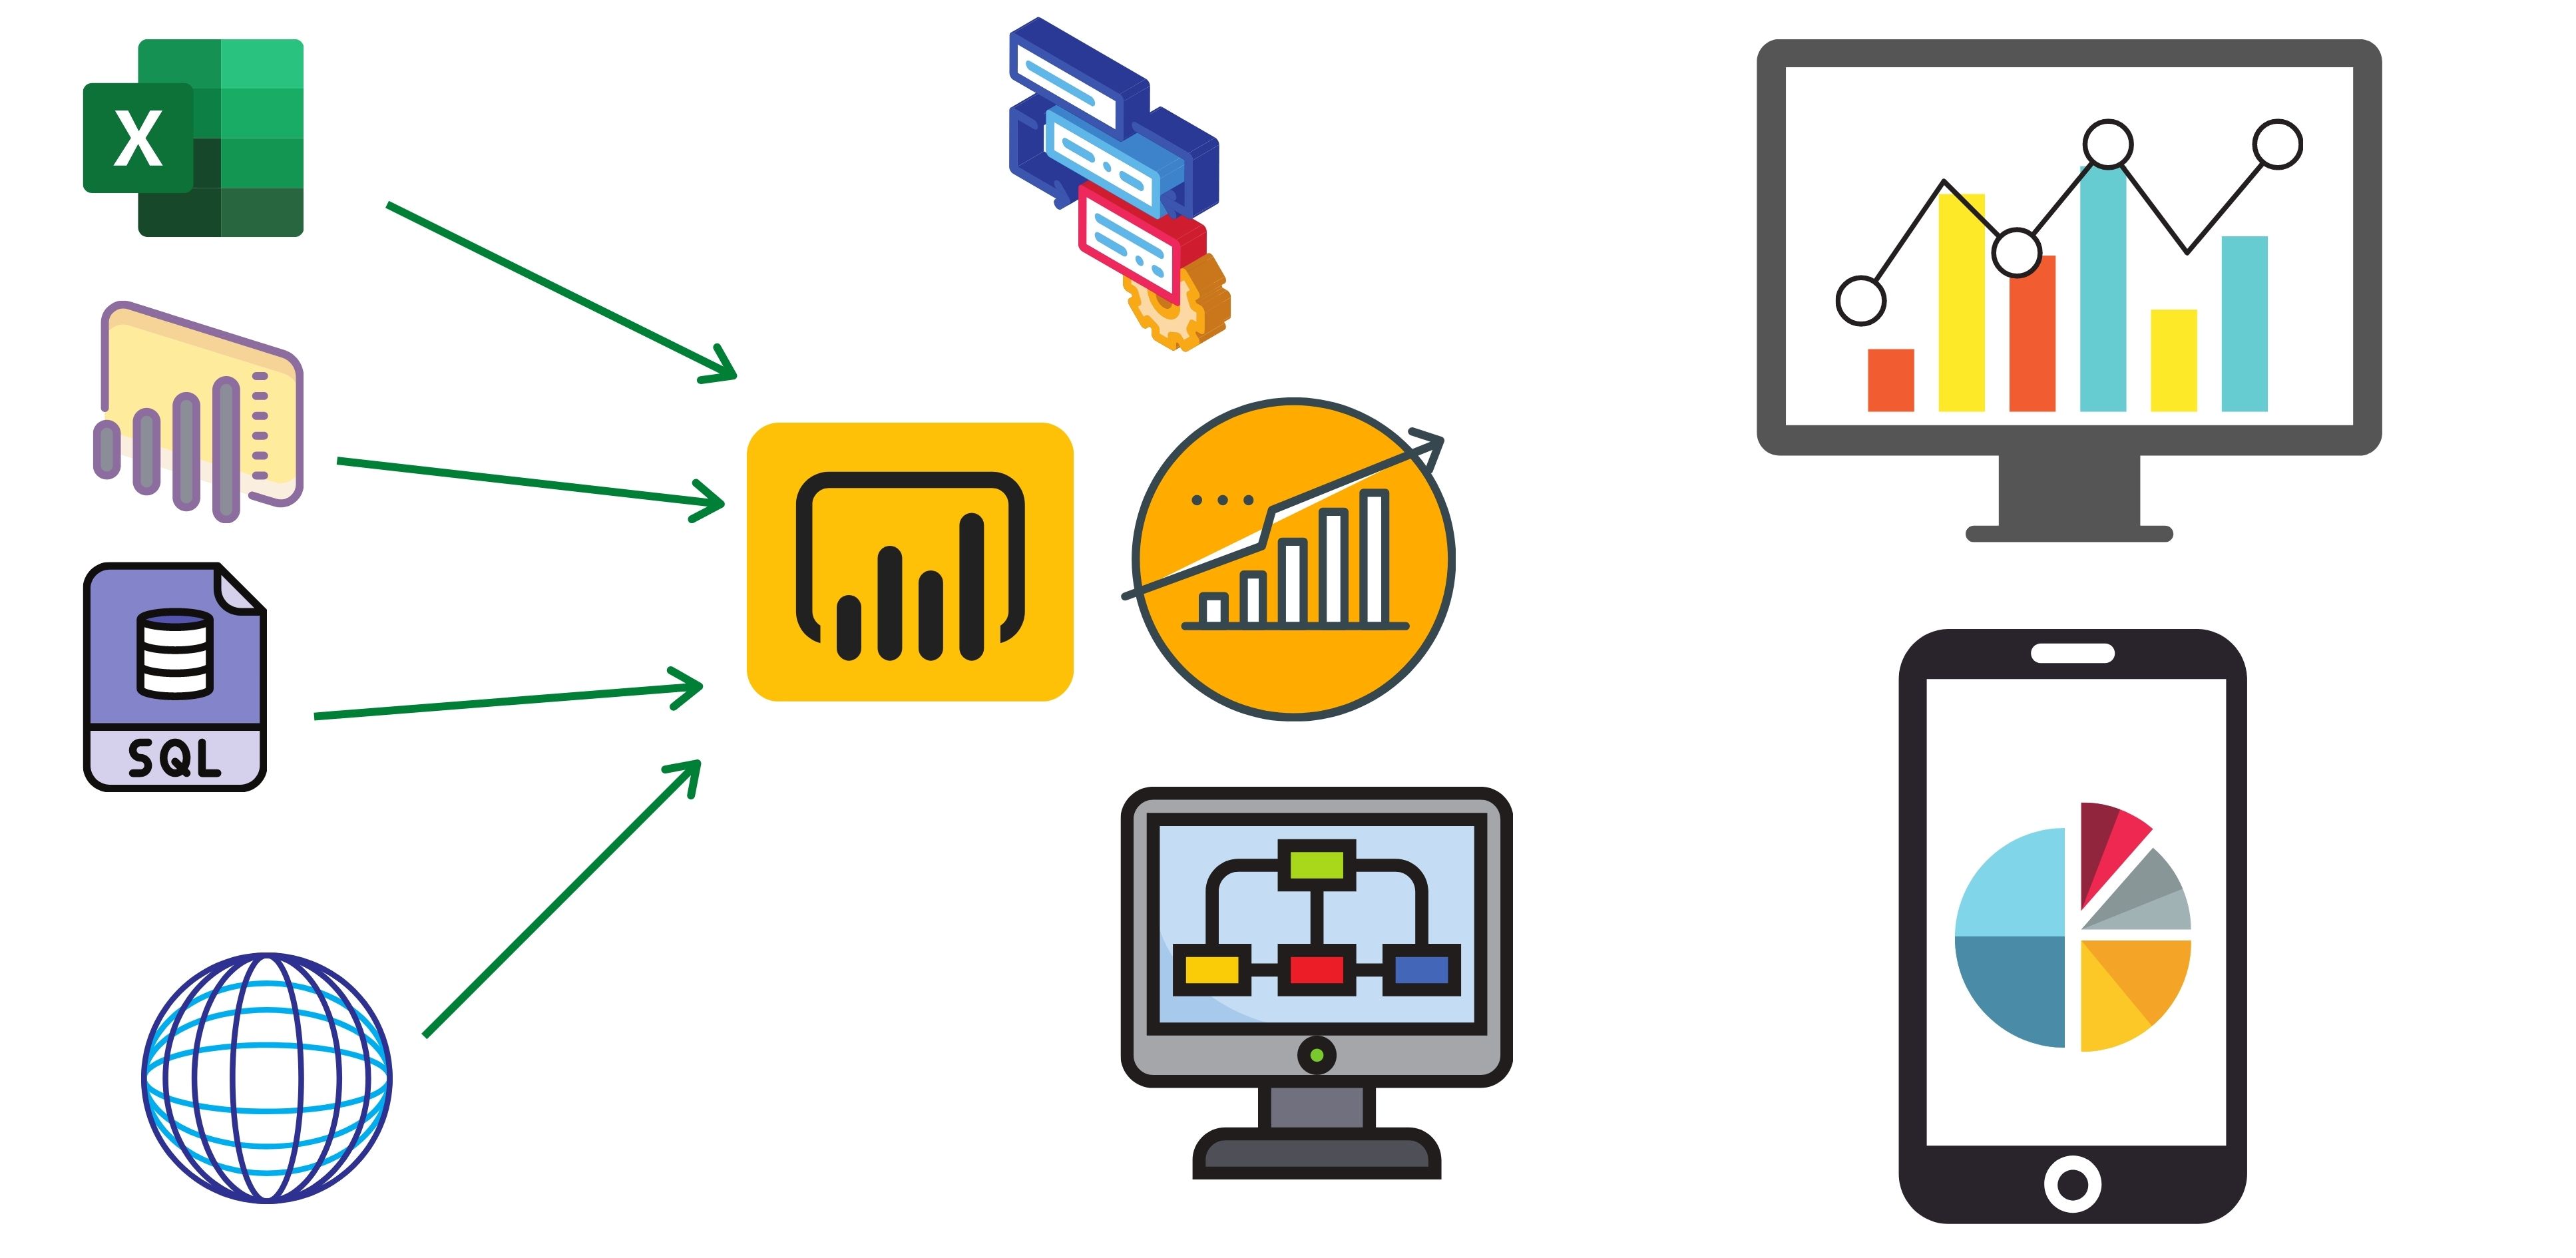
While connecting to Data Sources, we can choose from Excel files, Power BI datasets or dataflows, SQL servers, Web Data, csv files and many more. We can also use Power Query to transform data in Power BI. Data from various sources can also be combined. We can also clean and transpose data in Power BI.
Let us try some visualizations in Power BI. Visuals are tools that help us present the data in a compelling and insightful way, and help you show the important components of it. Visualizing data is one of the core parts and basic building blocks of Power BI. Well designed visuals are one of the most effective ways of presenting and sharing our data. For example, a chart or graph can be used to present data visually.
Common Visualizations in Power BI-
1. Maps
2. Card Visualization
3. Stacked area chart
4. Pie Chart
5. Bar Plot
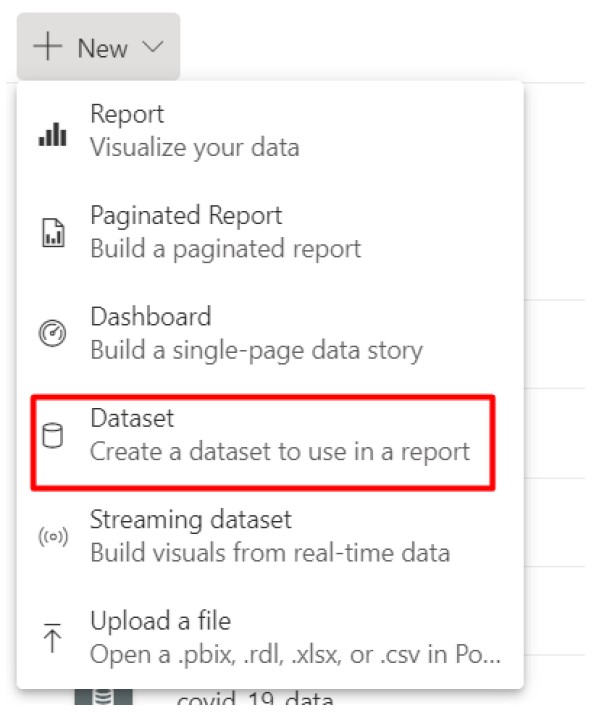
Getting data in Power BI
Here, let us take reference of Power BI Service. In your workspace, there will be an option “New”, select the dataset from there.
This will take to a new window, where one needs to select the data source.
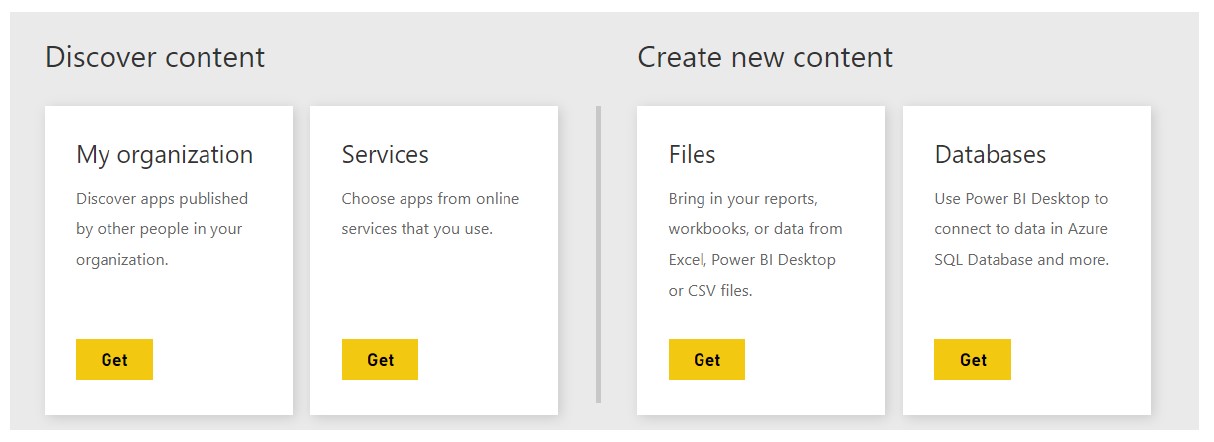
Depending on the type of work you do, you might take data from an online data source or a local CSV file.
Your datasets and dataflows are listed in Datasets + Dataflows.
These things vary from version to version, or the type of Power BI license you hold (or your organization holds). But, to put it simply, getting data in Power BI is very simple.
Power BI has many clear advantages which led to its place as a BI and Data Analytics powerhouse, let’s look at some of them.
Data Analysis Expressions (DAX)
Various DAX expressions can also be used in Power BI. They can be used for Data Manipulation, and working on the data. DAX makes it very easy to work with large volumes of data, making it a very good BI tool. This sort of flexibility in working with Data gives Power BI such popularity among Data Scientists and Analysts.
Read this article for more insight on DAX :
10 Useful Data Analysis Expressions (DAX) Functions for Power BI Beginners
Streamlined Pipelines and Report Publication
As the dashboards can be directly published to the Power BI, sharing is easy. Analysts no longer need to share large files over mail or Cloud drive. As the pipeline is streamlined, the dashboards are updated as soon as underlying data is updated.
Trust of Microsoft for Enterprise software
Microsoft is undoubtedly a name that everyone in the tech world knows. Microsoft already has a large client base, including corporations and personal users. Everyone knows how to use Word or Powerpoint, this makes the rollout of Power BI to the market very easy, and finding customers is not very difficult.
Artificial Intelligence
Using Power BI, users can access image recognition and text analytics and also integrate with Azure Machine Learning. Such support is often a game-changer.
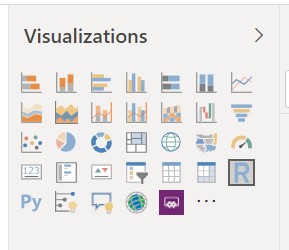
Wide variety of Visuals
Power BI has a large number of customizable visuals and many templates which help businesses make better sense of their data. The human brain is easily able to process visual information; hence it is easier to use images, charts, or graphs to understand and to visualize large amounts of complex data. There are many types of visualizations in the right panel in Power BI. One can just use drag and drop to put the data into these visuals.
Suppose we work with the Melbourne Housing Dataset.
Let us take the example of the Stacked Area chart.
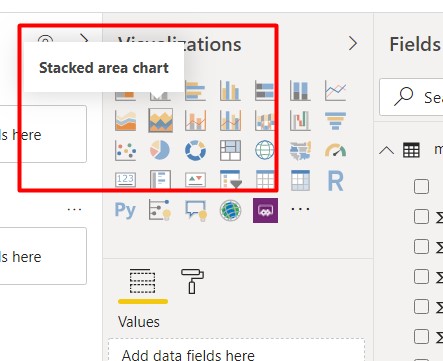
We drag and drop it into the workspace.
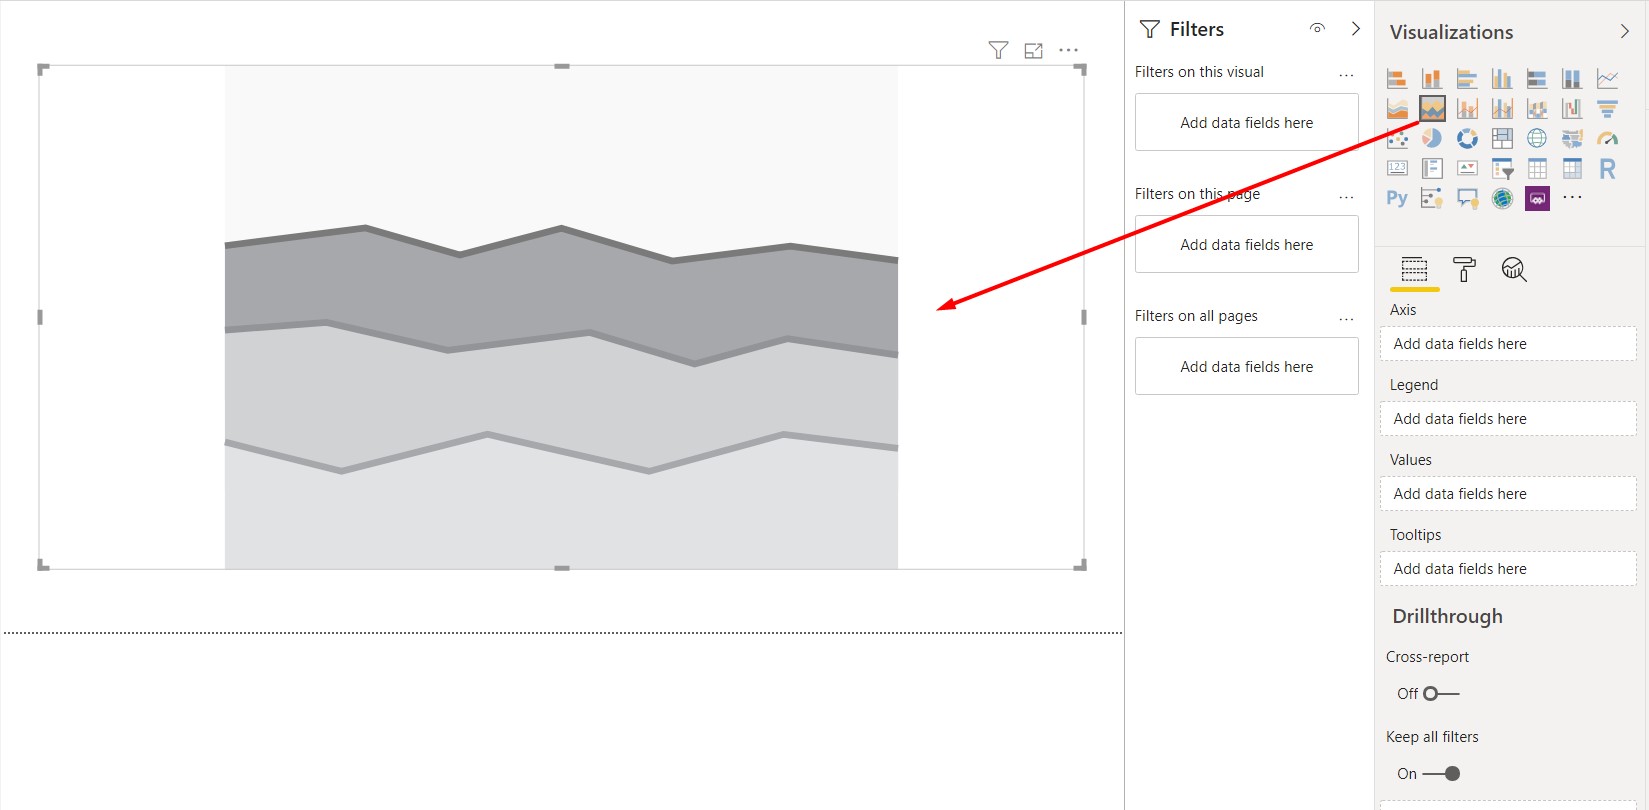
Next, we make some settings changes.
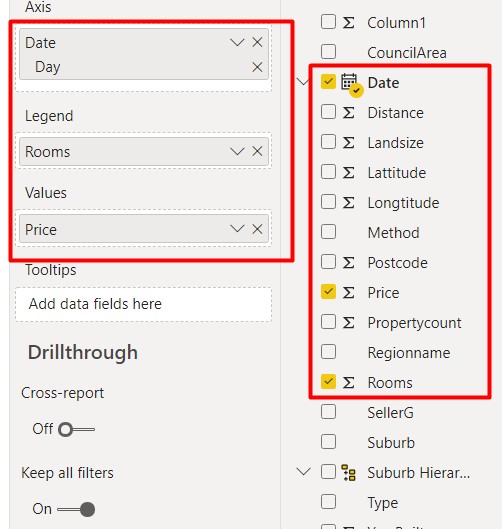
The day of the month is taken from the date, price consists the values and number of rooms in the house is the legend. This will show how much of the number of room houses are sold on a particular date of the month.
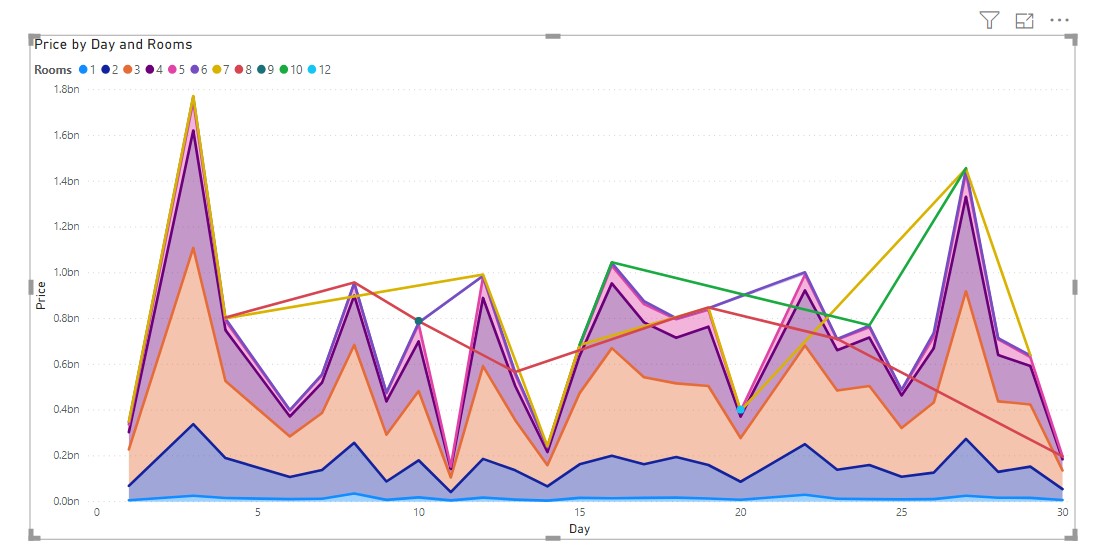
The chart as produced.
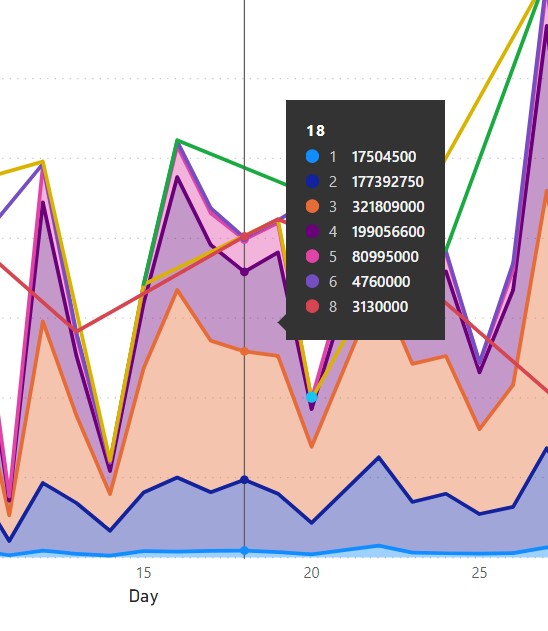
In focus mode, we can properly understand the values and analyse the data. There are numerous other types of charts and visuals in Power BI that make the analytics process easy and simple.
Integration with various other tools
Power BI integrates very well not only with Microsoft tools like Office 365, Dynamics 365, and Sharepoint but also with non-Microsoft tools like Spark, Hadoop, Google Analytics, SAP, Salesforce, etc. This makes it widely usable across the industry.
We can thus conclude that Power BI is a simple Cloud-based BI software that is easy to use and can be used to improve business performance. Its ability to work with almost all types of data makes it very popular in Marketing, Sales, Analytics, Strategy, Human Resouces, Operations and other departments.
I personally have worked a lot with Power BI for various purposes and I find using Power BI very simple and convenient.
I had spoken at two online events on Power BI, you can have a look at them.
1. Microsoft Student Partners Ignite the Spark | Day 3 Timestamp: 22:24
2.Devs Speak | Chapter 2 | Low Code, No Code Timestamp : 1:20:33
Microsoft Power BI with a lot of features, tools, and user-friendly UI has truly been a Data Analytics Power House, and everyone who wants to get into Data Science or Analytics should learn Microsoft Power BI.
Connect with me on Linkedin and follow me on my Github.
Prateek Majumder.
The media shown in this article are not owned by Analytics Vidhya and is used at the Author’s discretion.
Prateek is a final year engineering student from Institute of Engineering and Management, Kolkata. He likes to code, study about analytics and Data Science and watch Science Fiction movies. His favourite Sci-Fi franchise is Star Wars. He is also an active Kaggler and part of many student communities in College.


