This article was published as a part of the Data Science Blogathon
What does Interpretability/Explainability mean in AI?
The following points encompass the explainability-
Algorithms such as linear/logistic regression are easy to interpret based on model coefficients and Tree-based algorithms which can help us understand how it’s making decisions, with built-in support for feature importance and visualization.
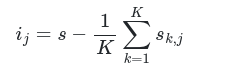
One simple method is Permutation Feature Importance, It is a model inspection technique that can be used for any fitted estimator when the data is tabular. The permutation feature importance is defined to be the decrease in a model score when a single feature value is randomly shuffled. This procedure breaks the relationship between the feature and the target, thus the drop in the model score is indicative of how much the model depends on the feature.
Where,
ij is the feature importance of feature j
s is the reference score calculated from the trained model
K is the number of iterations(shuffling operations) performed for a feature
sk,j is the score for kth iteration on feature j
We can use the python sklearn package for build-in permutation_importance function
from sklearn.inspection import permutation_importance
We will be using the Xgboost algorithm with default parameters on the Boston dataset
xg = xgboost.XGBRegressor()
xg.fit(Xtrain, ytrain)
Now we will use the permutation_importance function on the test set to calculate the feature importance, we need to provide a trained model and number of shuffling iteration to perform (n_repeats parameter)
r = permutation_importance(xg, Xtest, ytest,
                           n_repeats=30,
                           random_state=0)
Here, we have set n_repeats=30
The returned object, r will contain feature importance values for each feature which we can visualize using the matplotlib python library
plt.figure(figsize=(10,4))
plt.bar(boston.feature_names,r.importances_mean)
plt.xlabel('Features')
plt.ylabel('Mean Importance')
plt.title('Feature importance using Feature Permutation Importance');
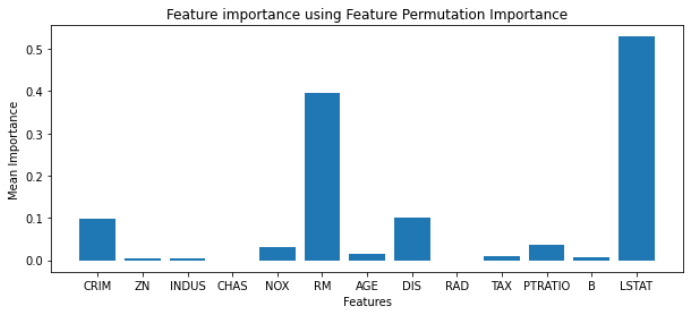
Source: Github
If two features are correlated and one of them is permuted then
Computationally expensive for a large number of features
A good practice is to drop one of the correlated features based on domain understanding and try to apply the Permutation Feature Importance algorithm which will provide better feature understanding.
Let’s discuss another method to interpret the black box models.
Flexible, as a selection of surrogate model, does not depend on the black-box model. If at some time we have a better performing black-box model in place of an existing black box, we do not have to change the method of interpretation
▪️How much confidence is enough(% of variance explained) in deciding the surrogate model is close enough to the black-box model
▪️ Interpretation becomes irrelevant if the black-box model is not performing well
We have seen few model interpretation techniques for Global interpretation, what about Local Interpretation i.e when we want to understand how a model prediction was made for a particular observation.
Consider a loan approval model, what if a user request is declined, then the user has the right to question WHY? and authorities should know why the model has declined the user request and communicate the same to the user as they just can’t say that their system has rejected it instead they need to explain on what factors(features) the request is rejected.
▪️LIME can explain the predictions of any classifier or regressor in a faithful way, by approximating it locally with an interpretable model(linear reg., decision tree..)
▪️It tests what happens to the predictions when we feed variations of the data into the machine learning model
▪️Can be used on tabular, text, and image data
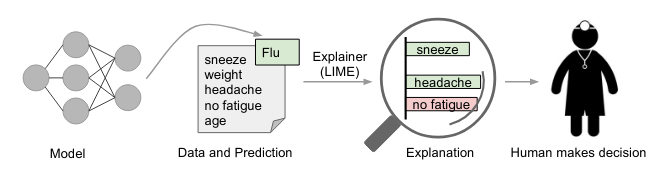
Source: LIME Paper
We can use python lime library to interpret models
import lime
import lime.lime_tabular
We will be using the Xgboost algorithm with default parameters on the Boston dataset
xg = xgboost.XGBRegressor()
xg.fit(Xtrain, ytrain)
Now we will create a lime explainer object, for which we have to specify the target column, features names, categorical features, and mode of the algorithm(regression or classification)
explainer = lime.lime_tabular.LimeTabularExplainer(Xtrain,
                                                  feature_names=boston.feature_names,
                                                  class_names=['price'],
                                                  categorical_features=categorical_features,
                                                  verbose=True, mode='regression')
We can use the explain_instance method of the explainer object to interpret a particular instance of data
exp = explainer.explain_instance(Xtest[i], xg.predict, num_features=5)
i is the index in test data that we need to interpret
we can visualize the interpretation output using the show_in_notebook method
exp.show_in_notebook(show_table=True)
We will get similar to below output
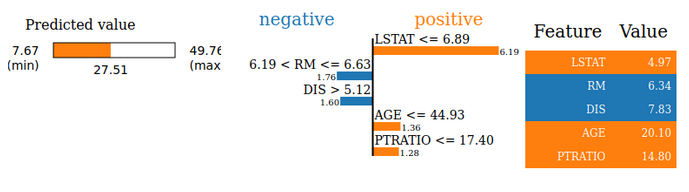
Source: Github
For Complete code refer to Github Repository
https://christophm.github.io/interpretable-ml-book/feature-importance.html
https://christophm.github.io/interpretable-ml-book/global.html
https://scikit-learn.org/stable/modules/permutation_importance.html
https://scikit-learn.org/stable/auto_examples/inspection/plot_permutation_importance_multicollinear.html#sphx-glr-auto-examples-inspection-plot-permutation-importance-multicollinear-py
LIME Research Paper: https://arxiv.org/pdf/1602.04938.pdf
https://github.com/marcotcr/lime
I am a Machine Learning Engineer, Solving challenging business problems through data and machine learning
The media shown in this article are not owned by Analytics Vidhya and are used at the Author’s discretion.
Lorem ipsum dolor sit amet, consectetur adipiscing elit,