KModes Clustering Algorithm for Categorical data
Clustering is an unsupervised learning method whose task is to divide the population or data points into a number of groups, such that data points in a group are more similar to other data points in the same group and dissimilar to the data points in other groups. It is basically a collection of objects based on similarity and dissimilarity between them. KModes clustering is one of the unsupervised Machine Learning algorithms that is used to cluster categorical variables.
Table of contents
What is KModes?
KModes is a clustering algorithm used in data science to group similar data points into clusters based on their categorical attributes. Unlike traditional clustering algorithms that use distance metrics, KModes works by identifying the modes or most frequent values within each cluster to determine its centroid. KModes is ideal for clustering categorical data such as customer demographics, market segments, or survey responses. It is a powerful tool for data analysts and scientists to gain insights into their data and make informed decisions.
KModes vs KMeans
KMeans uses mathematical measures (distance) to cluster continuous data. The lesser the distance, the more similar our data points are. Centroids are updated by Means. But for categorical data points, we cannot calculate the distance. So we go for KModes algorithm. It uses the dissimilarities(total mismatches) between the data points. The lesser the dissimilarities the more similar our data points are. It uses Modes instead of means.
How Does the KModes Algorithm Work?
Unlike Hierarchical clustering methods, we need to upfront specify the K.
- Pick K observations at random and use them as leaders/clusters
- Calculate the dissimilarities and assign each observation to its closest cluster
- Define new modes for the clusters
- Repeat 2–3 steps until there are is no re-assignment required
I hope you got the basic idea of the KModes algorithm by now. So let us quickly take an example to illustrate the working step by step.
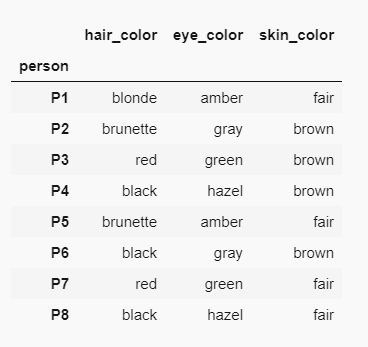
Example: Imagine we have a dataset that has the information about hair color, eye color, and skin color of persons. We aim to group them based on the available information(maybe we want to suggest some styling ideas)
Hair color, eye color, and skin color are all categorical variables. Below 👇 is how our dataset looks like.
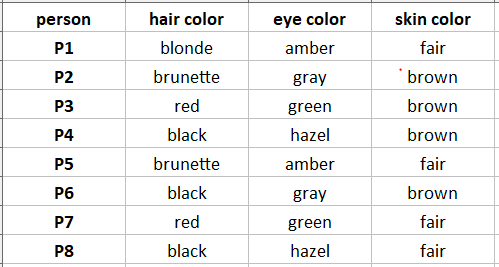
Alright, we have the sample data now. Let us proceed by defining the number of clusters(K)=3
Step 1: Pick K observations at random and use them as leaders/clusters
I am choosing P1, P7, P8 as leaders/clusters
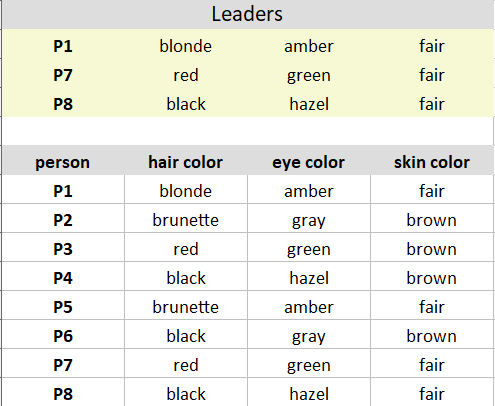
Step 2: Calculate the dissimilarities(no. of mismatches) and assign each observation to its closest cluster
Iteratively compare the cluster data points to each of the observations. Similar data points give 0, dissimilar data points give 1.
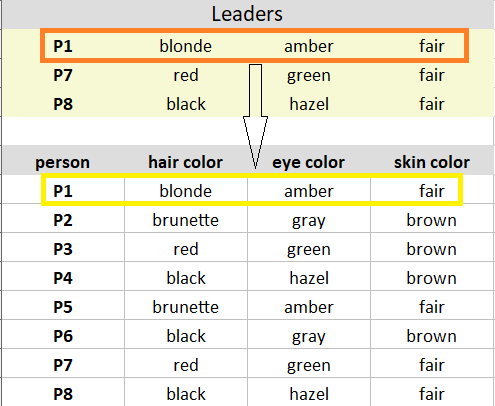
Comparing leader/Cluster P1 to the observation P1 gives 0 dissimilarities.
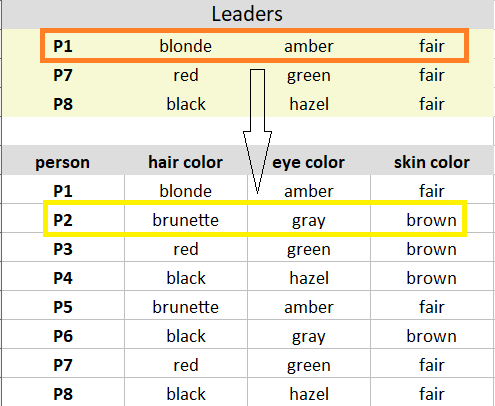
Comparing leader/cluster P1 to the observation P2 gives 3(1+1+1) dissimilarities.
Likewise, calculate all the dissimilarities and put them in a matrix as shown below and assign the observations to their closest cluster(cluster that has the least dissimilarity)
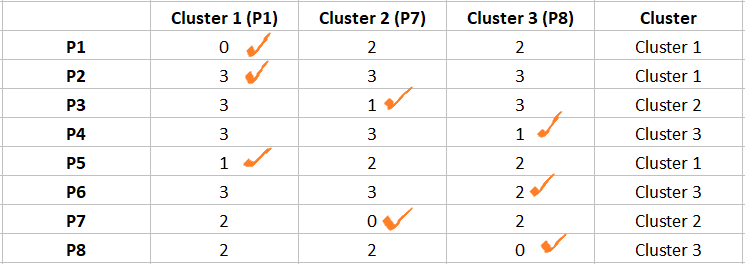
After step 2, the observations P1, P2, P5 are assigned to cluster 1; P3, P7 are assigned to Cluster 2; and P4, P6, P8 are assigned to cluster 3.
Note: If all the clusters have the same dissimilarity with an observation, assign to any cluster randomly. In our case, the observation P2 has 3 dissimilarities with all the leaders. I randomly assigned it to Cluster 1.
Step 3: Define new modes for the clusters
Mode is simply the most observed value.
Mark the observations according to the cluster they belong to. Observations of Cluster 1 are marked in Yellow, Cluster 2 are marked in Brick red, and Cluster 3 are marked in Purple.
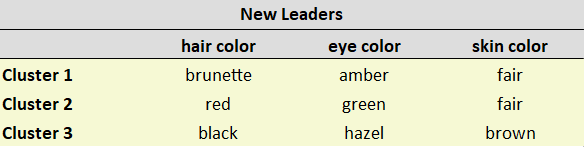
Considering one cluster at a time, for each feature, look for the Mode and update the new leaders.
Explanation: Cluster 1 observations(P1, P2, P5) has brunette as the most observed hair color, amber as the most observed eye color, and fair as the most observed skin color.
Note: If you observe the same occurrence of values, take the mode randomly. In our case, the observations of Cluster 3(P3, P7) have one occurrence of brown, fair skin color. I randomly chose brown as the mode.
Below are our new leaders after the update.
Repeat steps 2–4
After obtaining the new leaders, again calculate the dissimilarities between the observations and the newly obtained leaders.
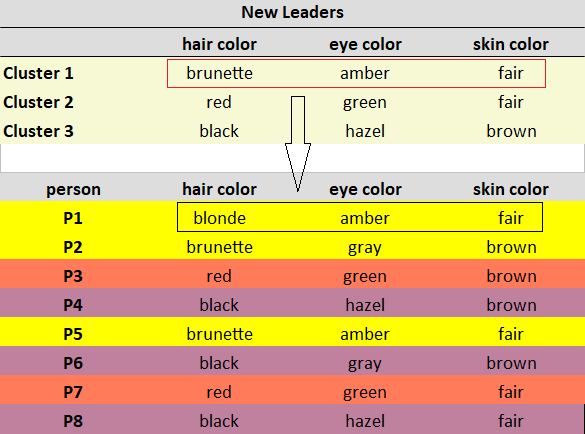
Comparing Cluster 1 to the observation P1 gives 1 dissimilarity.
.PNG)
Comparing Cluster 1 to the observation P2 gives 2 dissimilarities.
Likewise, calculate all the dissimilarities and put them in a matrix. Assign each observation to its closest cluster.
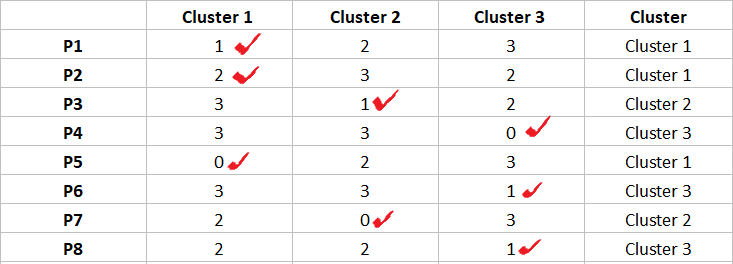
The observations P1, P2, P5 are assigned to Cluster 1; P3, P7 are assigned to Cluster 2; and P4, P6, P8 are assigned to Cluster 3.
We stop here as we see there is no change in the assignment of observations.
Implementation of KModes in Python
Begin with Importing necessary libraries
# importing necessary libraries
import pandas as pd
import numpy as np
# !pip install kmodes
from kmodes.kmodes import KModes
import matplotlib.pyplot as plt
%matplotlib inline
1. Creating Toy Dataset
Python Code:
2. Scree Plot or Elbow Curve to Find Optimal Kvalue
For KModes, plot cost for a range of K values. Cost is the sum of all the dissimilarities between the clusters.
Select the K where you observe an elbow-like bend with a lesser cost value.
# Elbow curve to find optimal K
cost = []
K = range(1,5)
for num_clusters in list(K):
    kmode = KModes(n_clusters=num_clusters, init = "random", n_init = 5, verbose=1)
    kmode.fit_predict(data)
    cost.append(kmode.cost_)

plt.plot(K, cost, 'bx-')
plt.xlabel('No. of clusters')
plt.ylabel('Cost')
plt.title('Elbow Method For Optimal k')
plt.show()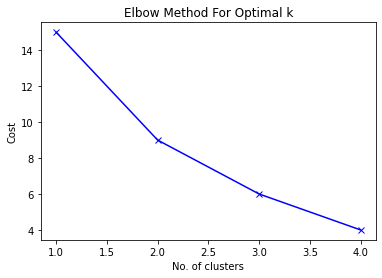
We can see a bend at K=3 in the above graph indicating 3is the optimal number of clusters.
3. Build a Model with 3 Clusters
# Building the model with 3 clusters
kmode = KModes(n_clusters=3, init = "random", n_init = 5, verbose=1)
clusters = kmode.fit_predict(data)
clusters
Finally, insert the predicted cluster values in our original dataset.
data.insert(0, "Cluster", clusters, True)
data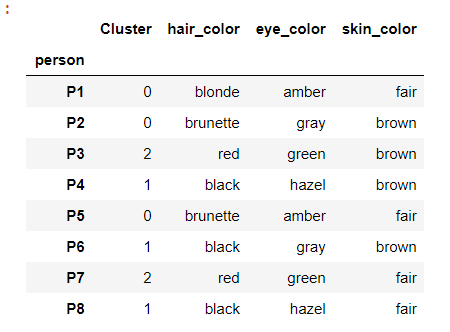
Inference from the model predictions: P1, P2, P5 are merged as a cluster; P3, P7 are merged; and P4, P6, P8 are merged.
The results of our theoretical approach are in line with the model predictions. 🙌
End Note
KModes is a valuable tool for clustering categorical data and gaining insights into your data. With its ability to identify modes and most frequent values, KModes can help you make informed decisions in your business or research. To learn more about data science and improve your skills, enrol in our BlackBelt program.
Frequently Asked Questions
A. K-modes is a clustering algorithm used in data mining and machine learning to group categorical data into distinct clusters. Unlike K-means, which works with numerical data, K-modes focuses on finding clusters based on categorical attributes. It’s useful for segmenting data with non-numeric features like customer preferences, product categories, or demographic information.
A. In Python, the Kmodes function is part of the kmodes library, which implements the K-modes clustering algorithm. This function is used to perform clustering on categorical data, grouping similar data points into clusters based on their categorical attributes. It takes as input the dataset and the desired number of clusters (k), and then it iteratively assigns data points to clusters and updates cluster centroids until convergence. The Kmodes function helps analyze and segment categorical data into meaningful groups for various applications in data analysis and pattern recognition.


Thanks for your post! It will help me a lot !
very well done! I worked thru the whole code and got excellent results on a much larger dataset...thanks! ajit balakrishnan founder and ceo rediff.com
The definition of "mode" in the article by Huang is non-standard (as are some of the other "definitions" in the article). Huang defines the mode as the set of $k$ strings $Q_1,...Q_k$ that simultaneously minimize the distance between the strings formed by the data ($X_1, X_2,...,X_n$) and the strings $Q_1,..Q_k$. I use strings instead of vectors here because integers do not form a vector space even over integers as the set of integers are not a field. Huang is using the metric $$d(x,y)=\Sum_i=1^n (delta(x_i,y_i))$$ where $delta(x_i,y_i)=1$ if $x_i=y_i$ and zero otherwise. This is a valid metric on the integers (it satisfies the definition of metric). Thus, we can discuss closeness of strings. The mode that Huang defines is not what we know as the mode in statistics. Mode in Huang's definition is a set of strings.
Thank you! One question, how can we measure the importance of particular features to the definition of the clusters in KModes?