Analyzing popular repositories on GitHub
This article was published as a part of the Data Science Blogathon
Introduction:
GitHub is one of the most popular version control and source code management platform. It is also one of the largest social networking sites for programmers. Software developers use it to showcase their skills to recruiters and hiring managers. By analyzing the repositories on GitHub, we can get valuable insights like user behaviour, what makes a repository popular or what technologies are trending among developers nowadays, and much more.

You can find the entire code used in the article here
I have used the ‘GitHub Repositories 2020’ dataset from Kaggle as it is more recent.
Implementation
Let’s git this started by importing necessary libraries and reading the input data,
The dataset contains 19 columns, out of which I have picked 11 columns based on the most popular GitHub terminologies and the ones relevant to the context of this analysis. You can see that there are typos in the column names, I have renamed them for better clarity.
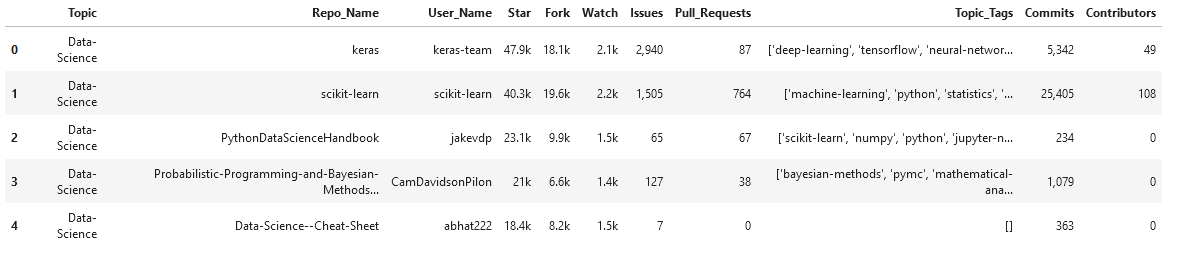
A quick brief about the columns in the data,
- Topic – A label describing the field or domain of the repo
- Repo_Name – Name of the repo (short name for repository)
- User_Name – Repository owner’s name
- Star – Number of stars a repo has received
- Fork – Number of times a repo has been forked
- Watch – Number of users watching the repo
- Issues – Number of open issues
- Pull_Requests – Total pull requests raised
- Topic_Tags – List of topic tags added to that repo by user
- Commits – Total number of commits made
- Contributors – Number of people contributing to the repo
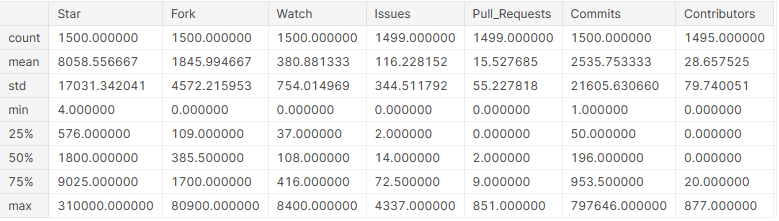
Notice how Star, Fork, and Watch columns contain ‘k’s to denote thousands, so let us convert them to multiples of 1000. Also, replacing the ‘,’(commas) from the Issues and Commits columns.
Now that the columns are numeric, we can get some basic statistical information from them.
# display basic statistical details about the columns
github_df.describe()
1. Analysis of top repositories based on popularity
What makes a GitHub repo popular? This question can be answered with 3 Metrics – Star, Watch, and Fork.
- Star – When a user likes your repo or they want to show some appreciation, they Star it.
- Watch – When a user wants to be notified of all the activities in a repo, then they Watch it.
- Fork – When a user wants a copy of the repo or they intend to make any contributions, they Fork it.
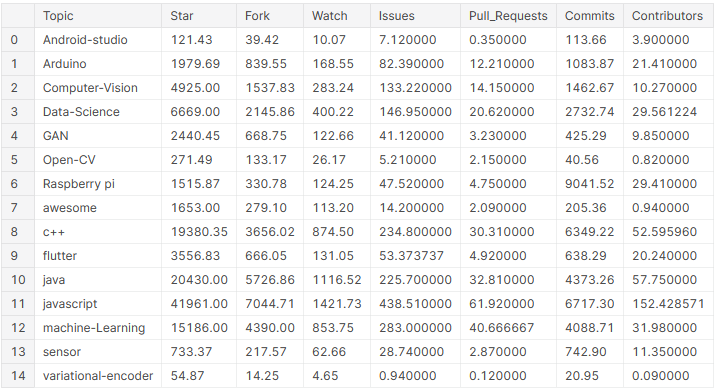
# create a dataframe with average values of the columns across all topics
pop_mean_df = github_df.groupby('Topic').mean().reset_index()
pop_mean_df
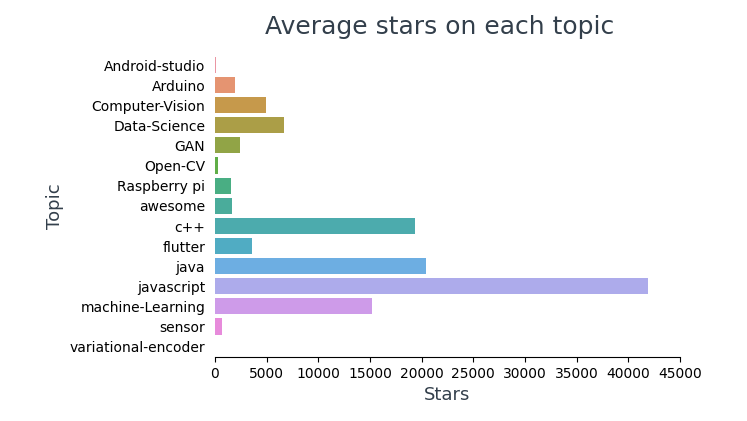
1.1 Analysis of Stars
Visualizing the average number of stars across each topic,
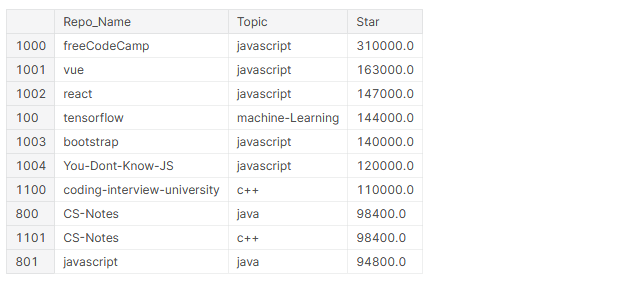
# top 10 most starred repos
github_df.nlargest(n=10, columns='Star')[['Repo_Name','Topic','Star']]
# Quick Tip: '33[1m' prints a string in bold and '33[0m' prints it back normally.
print('Most starred repository is {}{}{} in the topic {}{}{} with {}{}{} stars'.
      format('33[1m',github_df.iloc[github_df['Star'].idxmax()]['Repo_Name'],'33[0m',
             '33[1m',github_df.iloc[github_df['Star'].idxmax()]['Topic'],'33[0m',
            '33[1m',github_df.iloc[github_df['Star'].idxmax()]['Star'],'33[0m'))

In the top 10 most starred repositories, 4 are frameworks (Vue, React, TensorFlow, BootStrap) and 6 of them are about JavaScript.
1.2 Analysis of Watch
Visualizing the average number of watchers across each topic,
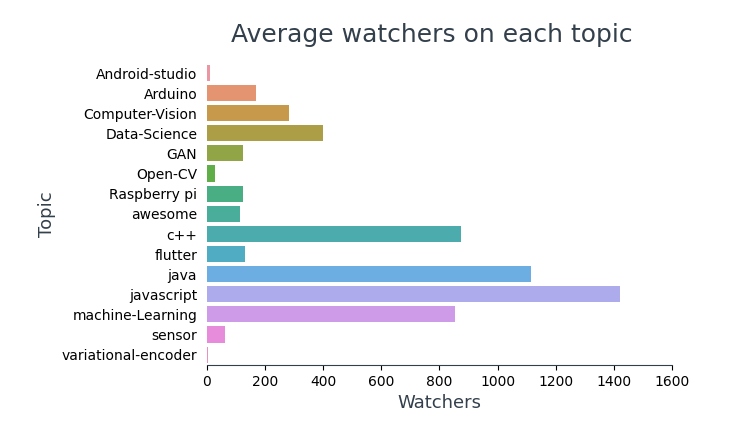
Note: Code for the above graph is the same as the ‘Average Stars on each topic’ except for the column names. I have not added the same to avoid redundancy.
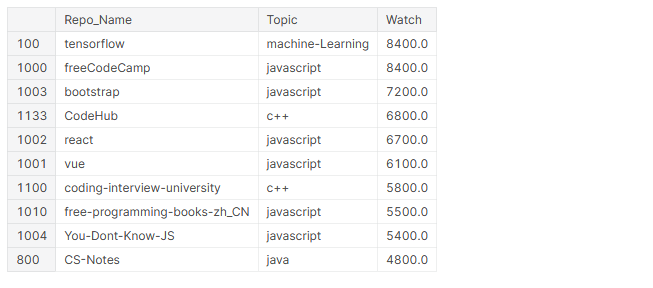
# top 10 most watched repos
github_df.nlargest(n=10, columns='Watch')[['Repo_Name','Topic','Watch']]
print('Most watched repository is {}{}{} in the topic {}{}'.
        format('33[1m',github_df.iloc[github_df['Watch'].idxmax()]['Repo_Name'],
        '33[0m','33[1m',github_df.iloc[github_df['Watch'].idxmax()]['Topic']))

In the top 10 most-watched repositories, 4 are frameworks (TensorFlow, BootStrap, React, Vue), 6 are about JavaScript, and 5 of them contain learning content for programmers.
1.3 Analysis of Fork
Visualizing the average number of forks across each topic,
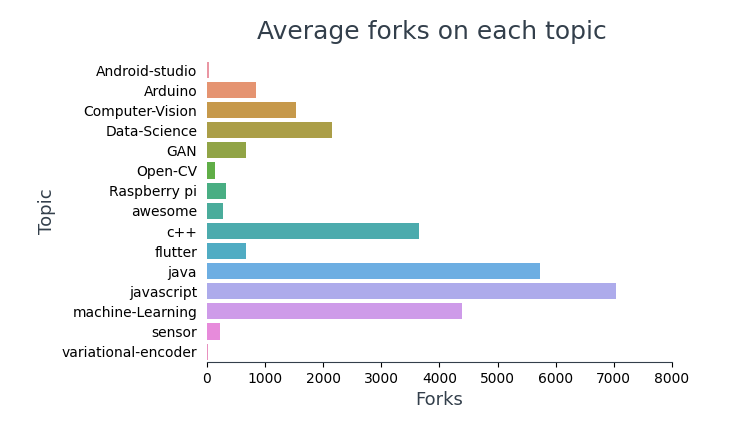
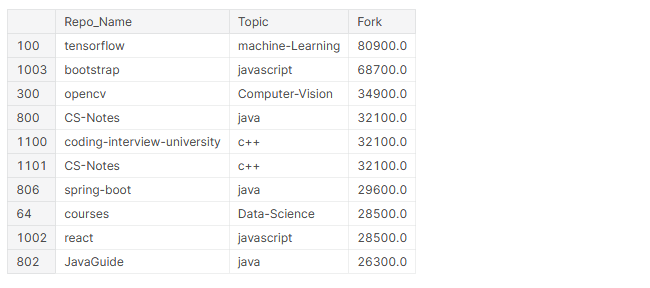
# top 10 most forked repos
github_df.nlargest(n=10, columns='Fork')[['Repo_Name','Topic','Fork']]
print('Most forked repository is {}{}{} in the topic {}{}'.
      format('33[1m',github_df.iloc[github_df['Fork'].idxmax()]['Repo_Name'],'33[0m',
      '33[1m',github_df.iloc[github_df['Fork'].idxmax()]['Topic']))

In the top 10 most forked repositories, 4 are frameworks (TensorFlow, bootstrap, spring-boot, react) and 5 of them contain learning content for programmers.
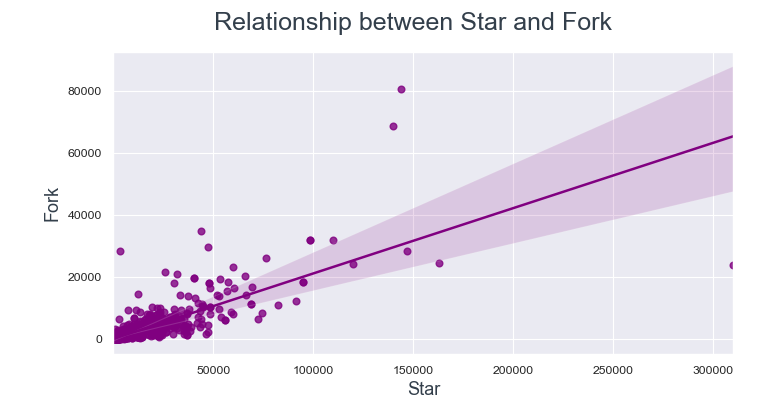
1.4 Relationship between Star, Fork, and Watch
Oftentimes users fork a repo when they want to contribute to it. So, let’s explore the relationship between star-fork and watch-fork.
# set figure size and dpi
fig, ax = plt.subplots(figsize=(8,4), dpi=100)

# set seaborn theme for background grids
sns.set_theme('paper')

# plot the data
sns.regplot(data=github_df, x='Watch', y='Fork', color='purple');

# set x and y-axis labels and title
ax.set_xlabel('Watch', fontsize=13, color = '#333F4B')
ax.set_ylabel('Fork', fontsize=13, color = '#333F4B')
fig.subtitle('Relationship between Watch and Fork',fontsize=18, color = '#333F4B')
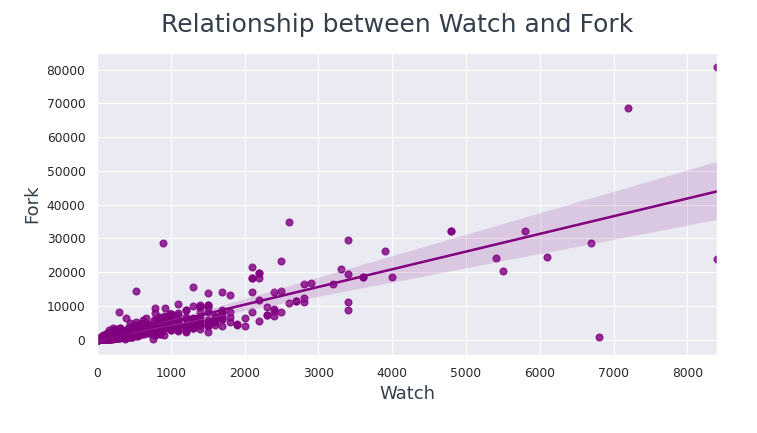
The data points are much more closer to the regression line between Watch and Fork compared to Star and Fork.
From this we can conclude, if a user is watching a repo then they are most likely to fork it.
2. Analysis of users with more repositories
Let’s take a look at users who have more popular repositories.
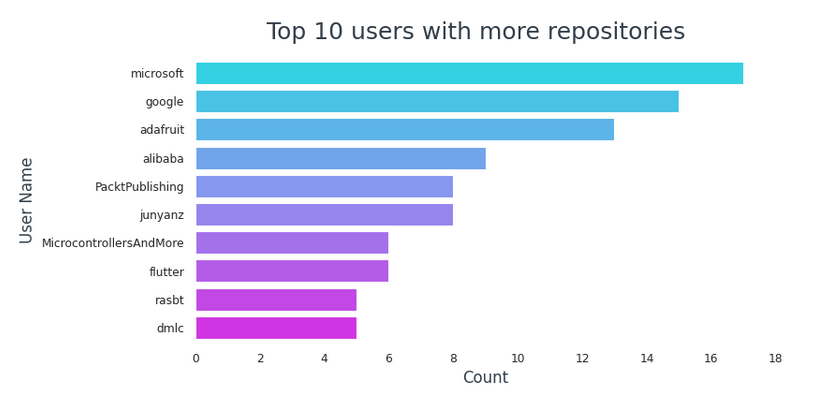
In the top 10 users with more repositories,
- Microsoft tops the list with 17 repos.
- Google follows with 15 repos.
- 6 of them are companies or owned by a company (Microsoft, Google, Adafruit, Alibaba, PacktPublishing, flutter)
- 3 are individual users (junyanz, rasbt, MicrocontrollersAndMore)
3.Understanding contribution activities across the repositories
GitHub is famous for its contribution graph.
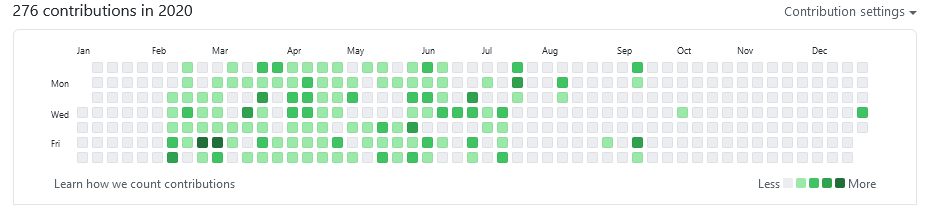
This graph is a record of all the contributions that a user has made. Whenever a user makes a commit, opens an issue, or proposes a pull request, it is considered a contribution. There are four columns related to contributions in our dataset, Issues, Pull_Requests, Commits, Contributors. Let us see if there is any real relationship between them.
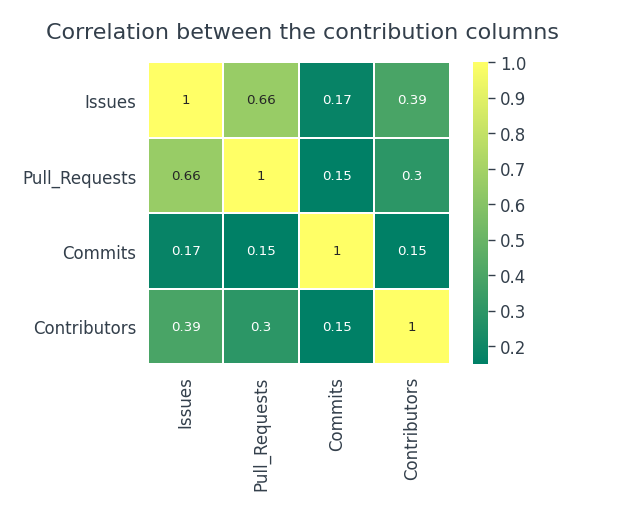
The number of Commits is not dependent on either issue, pull requests, or contributors. There is a Moderate Positive Relationship between Issues and Pull Requests.
Let’s explore the top 100 popular repositories and see if it’s the same,
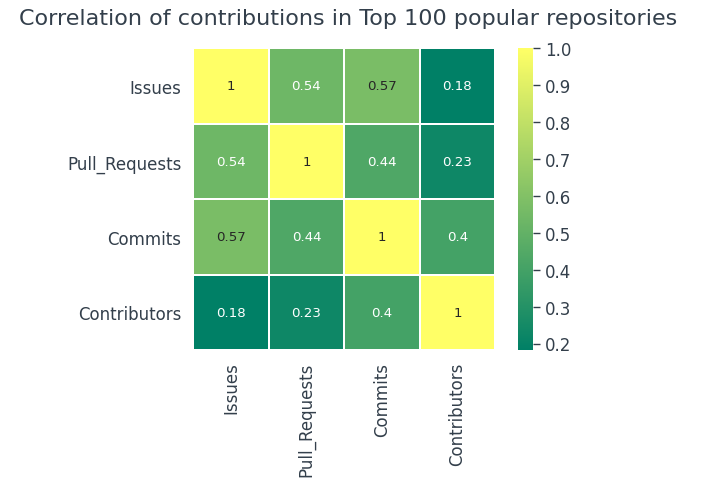
It’s nearly the same in the top 100 popular repositories as in the overall dataset.
Let’s check for users with more repositories,
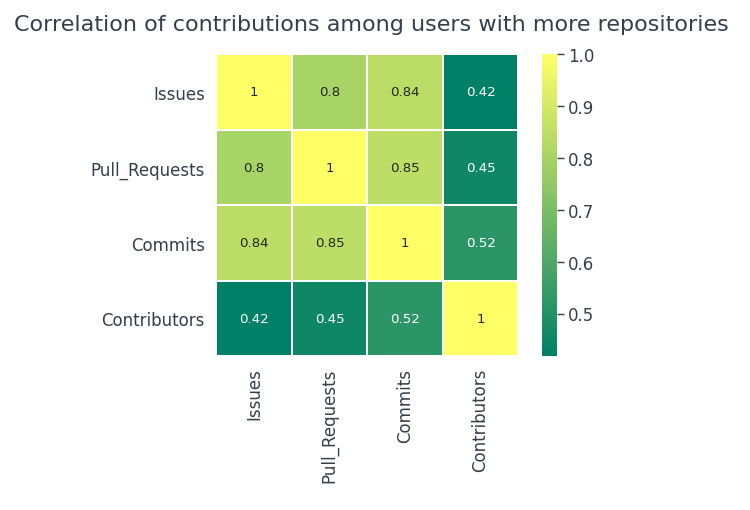
Surprisingly, users with more repos tend to be more active. There is a fairly strong positive correlation between
- Commits and pull requests
- Commits and Issues
- Issues and Pull requests
As far as contributions are concerned,
- There is no real relationship between contribution activities in the overall dataset.
- There is no correlation among contributions in the Top 100 popular repos either.
- If the users tend to have more repos, then the chances of contributions are fairly higher.
4. Analysis of Topic Tags
The topic_tags column consists of lists. In order to find popular tags, convert the entire column to a list of lists and count the occurrence of each tag. With that, we can visualize some of the most popular topic tags and see which topics tend to be tagged more.
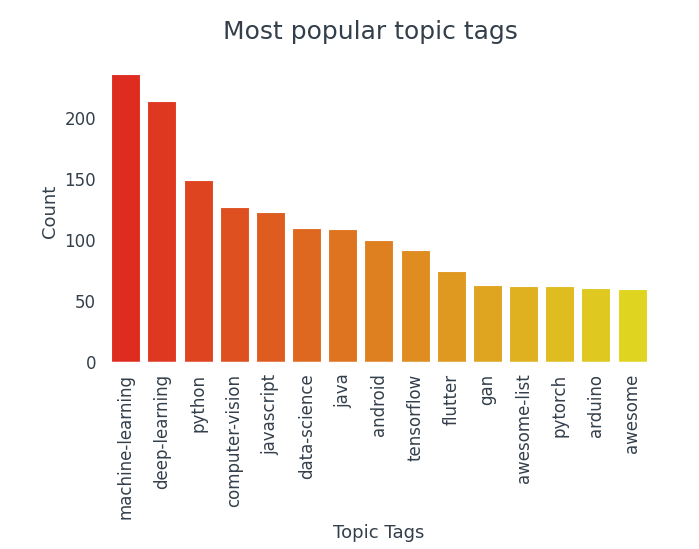
Out of the top 15 most popular tags, 10 belong to the world of data science.
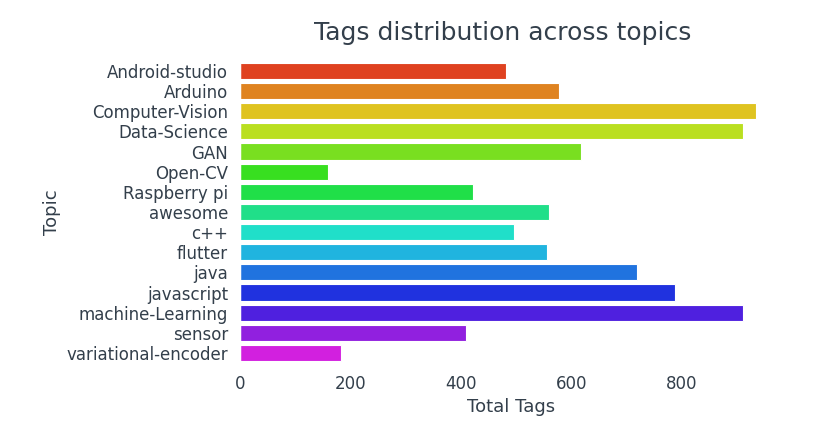
Repositories with topics Computer Vision, Data Science, and Machine Learning tend to be tagged more.
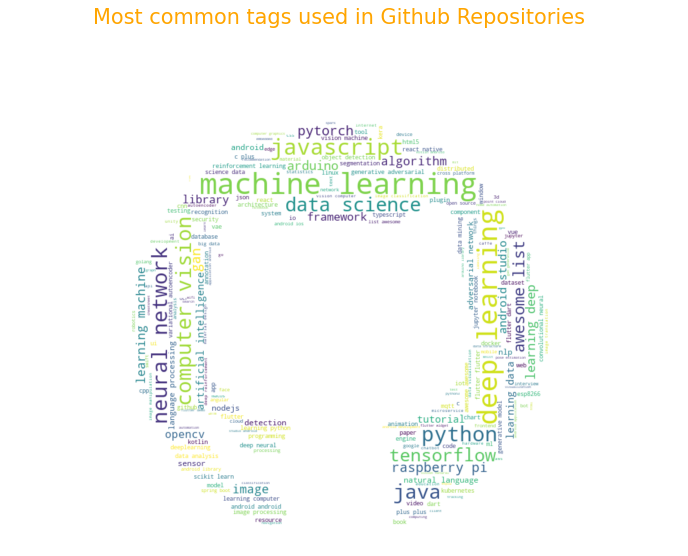
Let’s finish up with a wordcloud of topic_tags,
Inference:
- Among the top 10 most starred, watched, and forked repositories, 4 are frameworks.
- Tensorflow is the most-watched and forked repository.
- If a user is watching a repository, then they are most likely to fork it.
- Microsoft and Google tend to be users with more popular repositories.
- In the top 10 users with more popular repositories, 6 of them are companies.
- There is no actual relationship between contribution activities (Issues, Pull Requests, Commits).
- The most used tags are Machine Learning, Deep Learning, Python, Computer Vision, JavaScript.
- Repositories with topics Computer Vision, Data Science, and Machine Learning have more tags.
If we had analyzed data from a decade ago, these trends would have been completely different. It’s like data science had a monstrous growth in the past years!
Thank you for viewing all the way down here! I would love to connect on LinkedIn
Let me know in the comment section if you have any concerns, feedback, or criticism. Have a good day!
The media shown in this article are not owned by Analytics Vidhya and are used at the Author’s discretion.


Nicely presented, really enjoyed reading this article.