This article was published as a part of the Data Science Blogathon
Introduction
Images are considered to be one of the most important sources of information due to the large quantities of data that can be derived and extracted from them. At this point in our OpenCV Tutorial, we have been enlightened and informed of several interesting Image Manipulation and Processing Concepts. If you have not read through my previous articles and would like to do so, kindly navigate to my Analytics Vidhya Profile.
This article will help us to understand the technique of enhancing image contrast.
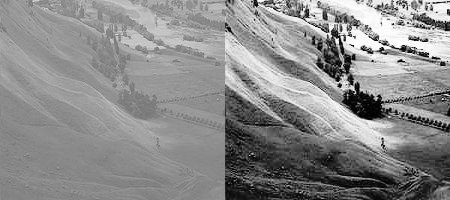
Image 1
Understanding Image Contrast with OpenCV
For human beings to see objects and colors in their surroundings, they require a sufficient amount of light to be present around them. This is because within our eyes there are light-sensitive cells that react to light in our environment which assists our eyes and brain with the creation of the 3D object we are trying to perceive.
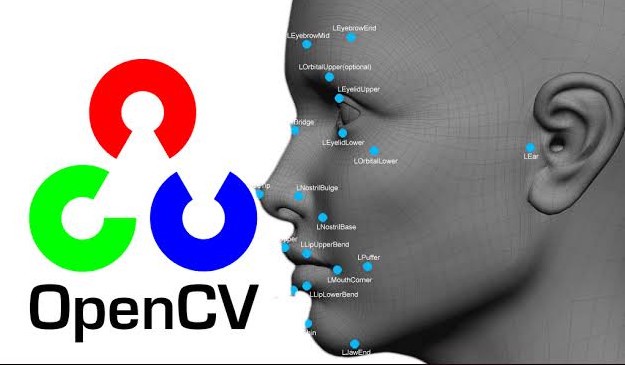
Image 2
This brings me to talk about a term which is the crucial point of this article:
Image Contrast
Contrast can be described as the particular amount of light that is emitted from a particular object in the real world, or in a digital image- we are focusing on digital images. Contrast allows us to perceive objects in the background and foreground in images.
Essentially what happens when we enhance contrast is: We try to find the most common pixel value in the image, and attempt to standardize (bring to a common pixel range) most/all pixels on the image, therefore, creating a more uniform visual and smoothing the image out. This is because there will be a greater number of pixels with similar intensities hence emitting a similar quantity of light to the human eye.
One will find that when the contrast of an image is increased, the light portions of the image will become lighter, and the dark portions, darker. This explanation can be reinforced with the human eye in a real-time example:
- Locate an object in your surroundings (a frame, mug, etc).
- Focus your vision on this object for a few seconds (5-10 seconds).
- Notice that your eyes will adjust to the distance of this object, to ensure that you have a clear sight of it.
- Upon looking at the object a second time, pay careful attention to how your eyes are able to isolate that specific object in the environment. Consciously observe how your eyes will attempt to blur out (faintly) any other objects that fall into your view, while you attempt to look at one specific object.
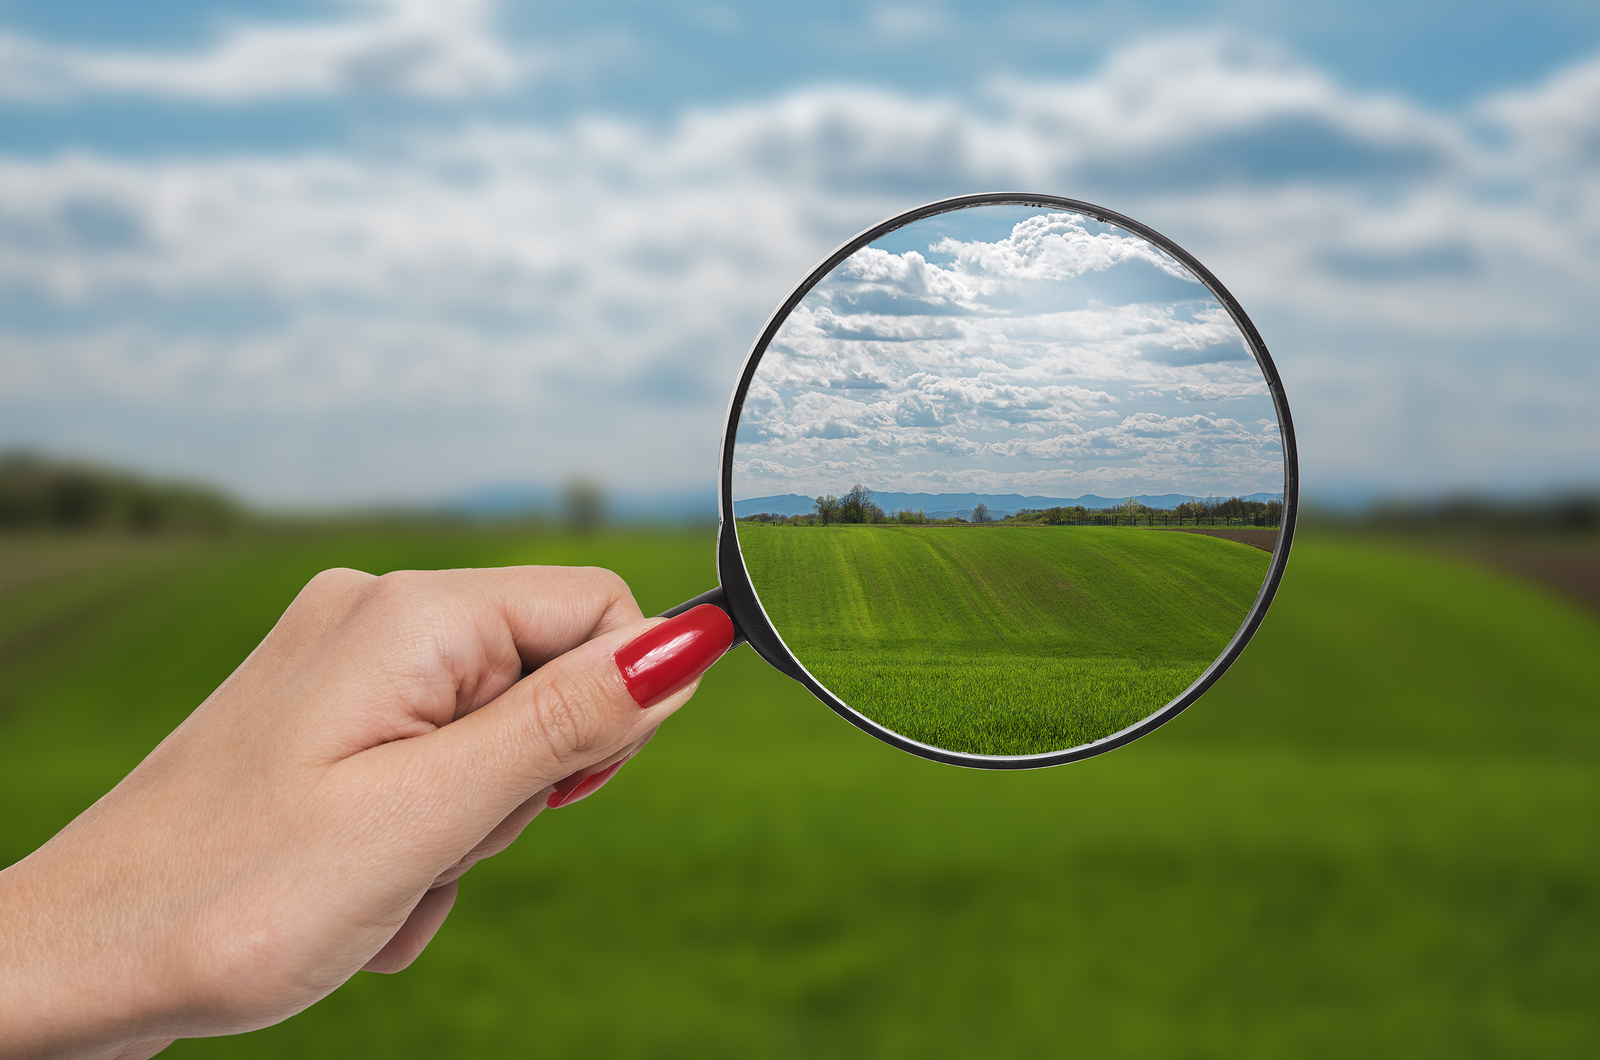
Image 3
The explanation for the above experience is simple and interesting
Upon looking at the object, you have caused your eyes to adjust the nerve and cell configurations within, hence making the eyes focus primarily on that object. The eyes attempt to capture as much light as possible from the surroundings and the object itself and in doing so unknowingly increases the contrast of the object, hence causing the object to become darker in real-time, therefore bringing the object into focus, causing it to become the foreground of our sight and making everything else blur/dim (not entirely) away into the background of our sight. In fact, while reading this very statement, your eyes have adjusted themselves to enhance the contrast of these words to allow you to bring your foreground focus to the text for easy reading.
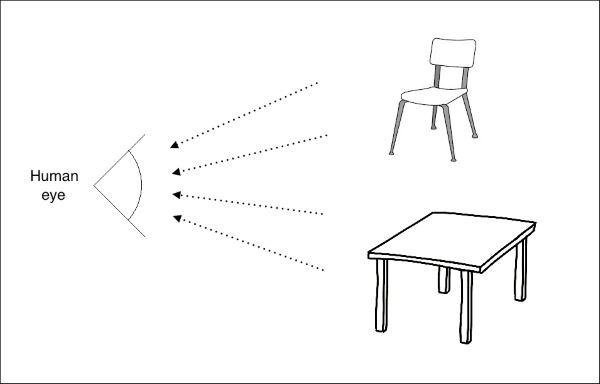
Image 4
Importance of Histograms and MatPlotLib
Given the fact that we have so many pixels in a particular image, we require an easy way to visually represent and understand the pixel orientation, especially when looking at our images with enhanced contrast.
The primary visualization tool we will work with is the MatPlotLib package in Python Programming Language.
Image 5
The visual diagram that we will be using within this package is the Histogram.
Visualizing Pixel Intensities
Before we conclude this article, I would like to provide you with a short example of how the pixel intensity histogram looks. To assist us in this learning experience, we shall make use of an image that may be downloaded at this link. Alternatively, you may save the image found below. Please note that this is only an example- we shall dive further into code explanations in future articles.
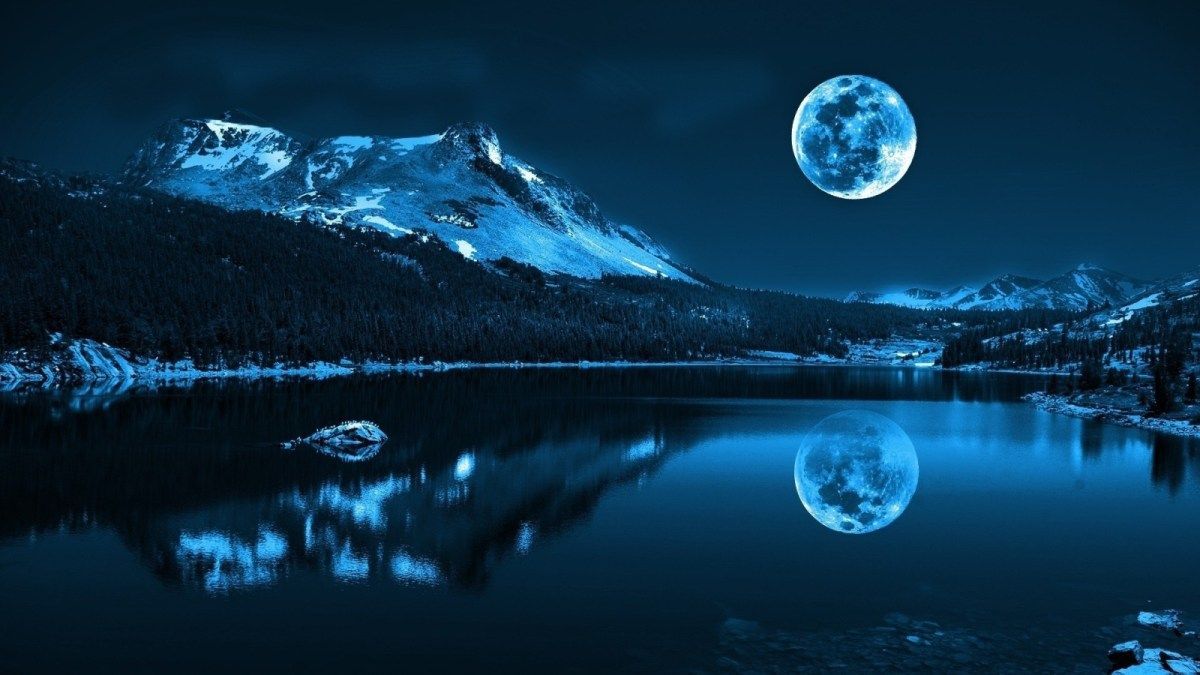
Image 6
We begin by importing the necessary packages:
import cv2
import numpy as np
import matplotlib.pyplot as plt
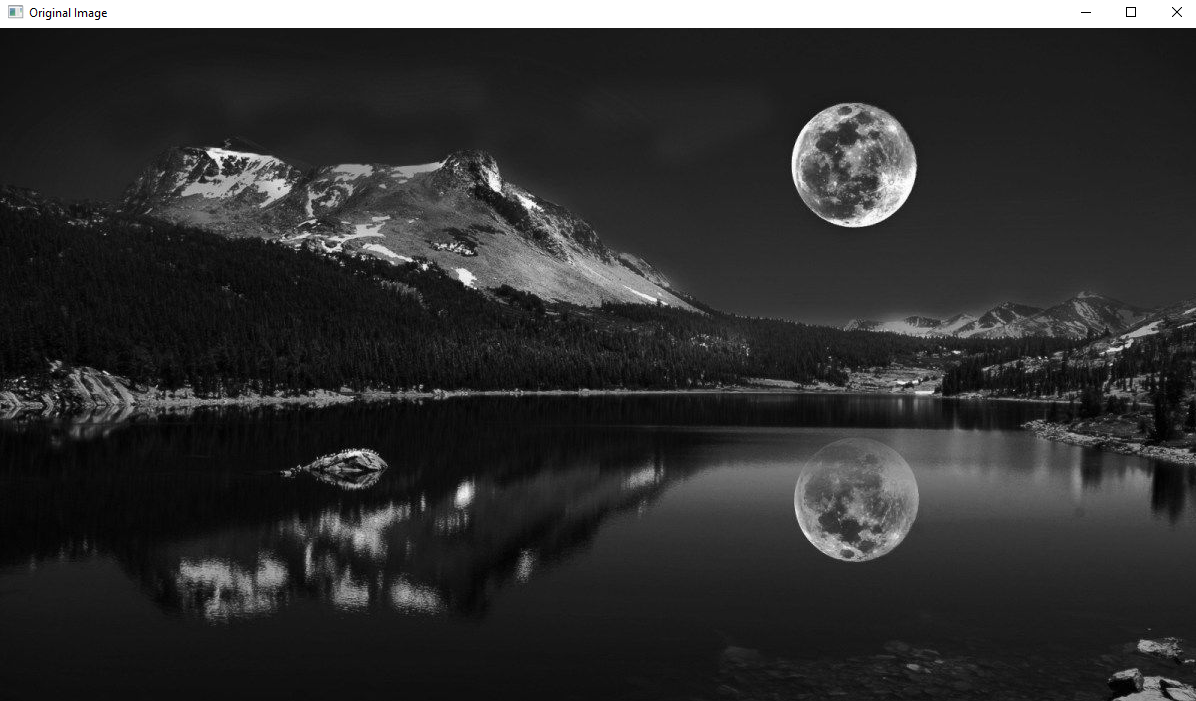
We thereafter load the image into our system memory in GRAYSCALE colour format and display it to the screen:
Python Code:
import cv2

image = cv2.imread(r"1360038.jpg", cv2.IMREAD_GRAYSCALE)
cv2.imshow("Original Image", image)
cv2.waitKey(0)
cv2.destroyAllWindows()
The output will be seen as follows:
Next, we will attempt to create the Histogram as follows:
import matplotlib.pyplot as plt
plt.hist(image.ravel(), 256, [0,256], color='crimson')
plt.ylabel("Number Of Pixels", color='crimson')
plt.xlabel("Pixel Intensity- From 0-255", color='crimson')
plt.title("Histogram Showing Pixel Intensity And Corresponding Number Of Pixels", color='crimson')
plt.show()
The Histogram will show as follows:
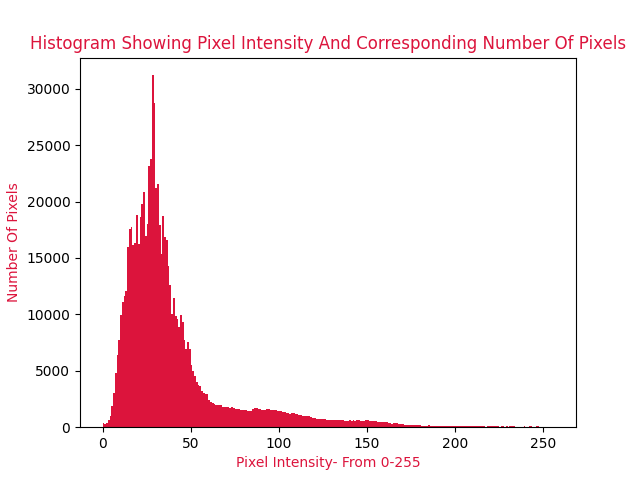
And as can be inferred from the title of the visual- this Histogram will show us the number of pixels belonging to a particular intensity. And this Histogram actually conveys the image shades and colors to us.
If we look at the histogram from left to right (0 onwards), we notice that there is a cluster of low-value pixels at the left, which represent the color black (as we know from the previous articles). Upon looking at the image, we observe that there is indeed a cluster of trees that account for the large number of black-shaded pixels that we observe in the Histogram bins- The image contrast decreases from left to right, and so do the number of dark pixels in the Histogram.
Image 7
Conclusion
This concludes my article Understanding Image Contrast With Python. I do hope that you are grasping knowledge about these interesting and real-world image processing techniques. If you have found my article interesting please share the link at will.
Please feel free to connect with me on LinkedIn. If you would like to see all articles that I have composed for Analytics Vidhya, please navigate to my Analytics Vidhya Profile.
Thank you for your time.
Image Sources-
Image 1 – https://docs.opencv.org/4.5.2/d5/daf/tutorial_py_histogram_equalization.html
Image 2 – https://medium.com/analytics-vidhya/getting-started-on-object-detection-with-opencv-5962a75876a6
Image 3 – https://www.rebuildyourvision.com/blog/vision-conditions/nearsightedness/6-tips-to-improve-your-distance-vision/
Image 4 – https://subscription.packtpub.com/book/application_development/9781785280948/1/ch01lvl1sec08/understanding-the-human-visual-system
Image 5 – https://interactivechaos.com/en/course/matplotlib-tutorial
Image 6 – https://wallpaperaccess.com/night-nature
Image 7 – https://www.cloudbooklet.com/how-to-install-opencv-on-ubuntu-18-04/
The media shown in this article are not owned by Analytics Vidhya and are used at the Author’s discretion.


