This article was published as a part of the Data Science Blogathon.
An exploratory data analysis article of the best cities for your next workcation.

Photo by Christin Hume on Unsplash
Introduction
Due to the pandemic, companies who were never comfortable letting their employees work from home, citing multiple reasons like the breach of data privacy and employees’ productivity, had to resort to working remotely. As the saying goes, necessity is the mother of invention; large corporates understand that the same amount of work, if not more, can be done while working from home.
However, we most definitely cannot ignore the impact of WFH on employee well-being. When the difference between a home and office environment becomes hazy, an employee can probably go crazy. But it might not be so bad to possess two one-hour meetings back to back if you’re sitting during a cafe in Darjeeling(in India), to the present view.
Well, a work vacation would be what you need to come out of your mundane regular day job! Today, this article aims to understand what makes a city, a desired workcation friendly spot. We would work with publicly available data on Kaggle, which was provided by Holidu.
Data Features
A quick look at the data will help us understand what features we would be able to play with.
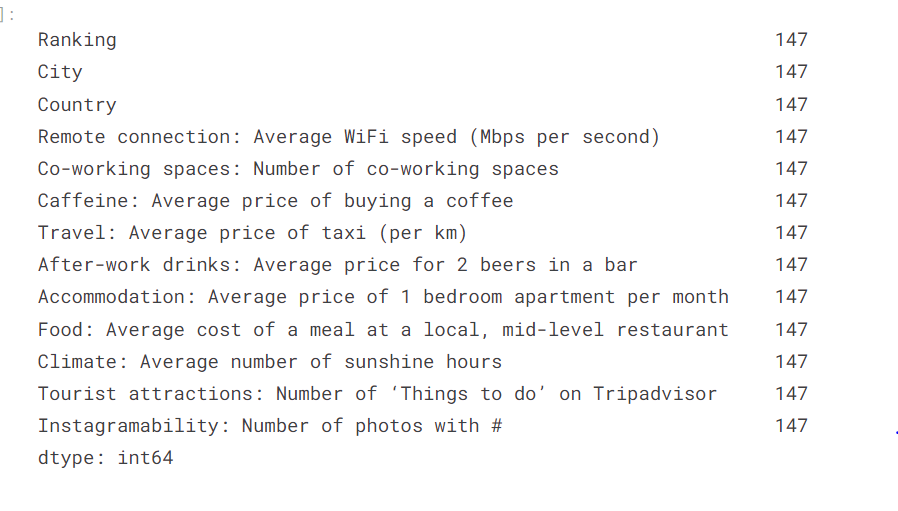
train.isna().count()
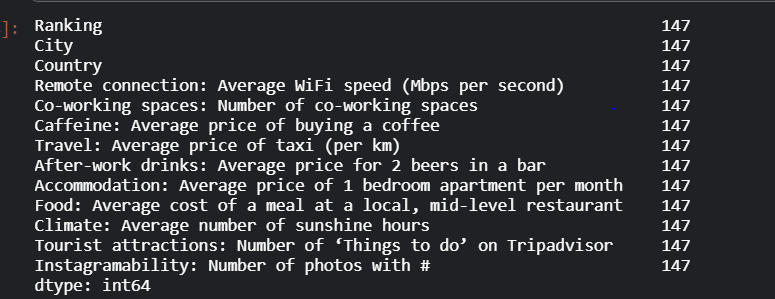
We do not null entries in our data. We would move forward to understand the data through visualizations.
Univariate Analysis
Let us start by understanding which country has the foremost number of cities mentioned in our dataset, giving us a way of the country’s popularity in terms of getting a workcation.
We would be using the plotly library in python for all our plots.
px.treemap(train,path=['Country'])
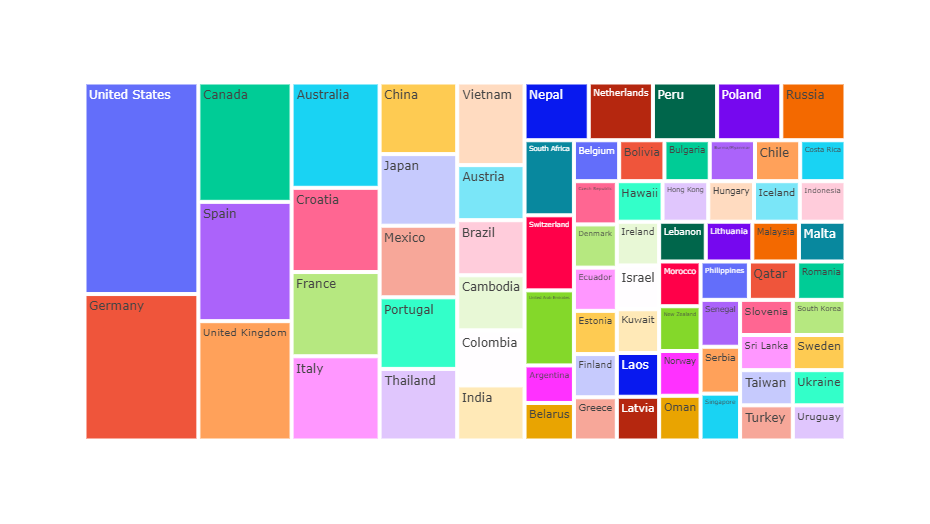
The US seems to possess the foremost number of workcation popular cities followed by Germany, Canada, Spain, and therefore the UK.
In my opinion, to make a workcation affordable the most important factors should be food and stay, let’s explore them.
acc = train.copy()
acc=acc.sort_values(by="Accommodation: Average price of 1 bedroom apartment per month")
acc.rename(columns={"Accommodation: Average price of 1 bedroom apartment per month":"Accomodation_Costs"},inplace=True)
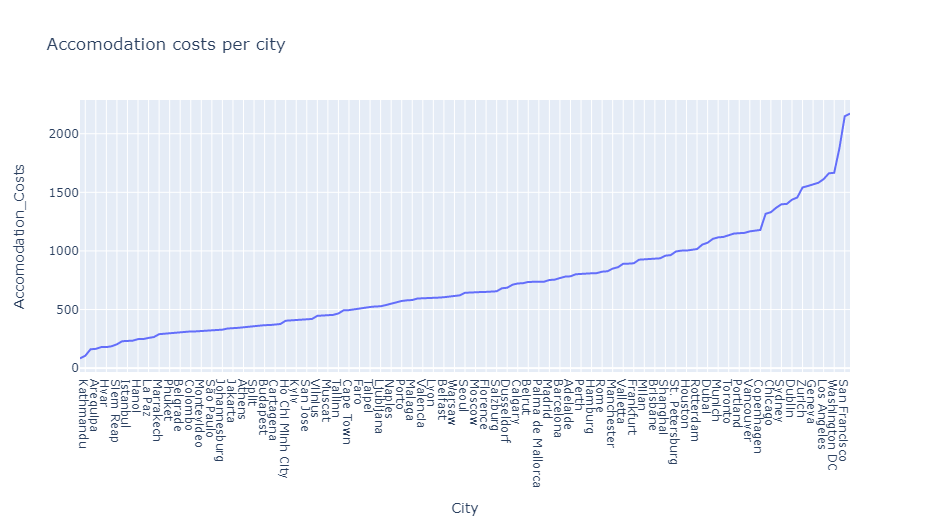
px.line(acc,x="City",y="Accomodation_Costs",title="Accomodation costs per city")
Source: Author
The accommodation costs are in pounds. Considering the same renting a 1 Bedroom apartment costs more than 1500 pounds(almost 1,50,856.30 INR according to currency rates at the time of publishing this article) in San Francisco, Washington DC, Los Angeles, London, and Boston.
The four cities with the highest rents fall in the United States, which has the most number of places that are best to work on your job given the data.
To understand the typical one-month rent per country, we plot the below.
acc = train.copy()
acc.rename(columns={"Accommodation: Average price of 1 bedroom apartment per month":"Accomodation_Costs"},inplace=True)
acc = acc.groupby(['Country'])['Accomodation_Costs'].mean().reset_index()
acc=acc.sort_values(by="Accomodation_Costs")
fig = px.bar(acc,x="Country",y="Accomodation_Costs",title="Accomodation costs per country")
fig.update_layout(
    xaxis = dict(
        tickmode = 'linear',
        dtick = 1,
        type = 'category',
        tick0 = 1
    )
)
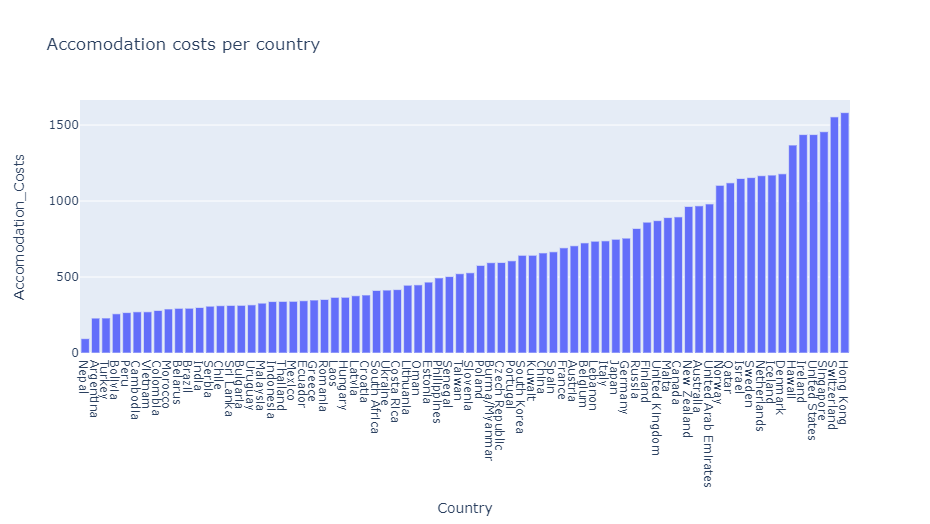
Source: Author
The top 5 most popular countries for a workcation have accommodation costs on the higher side.
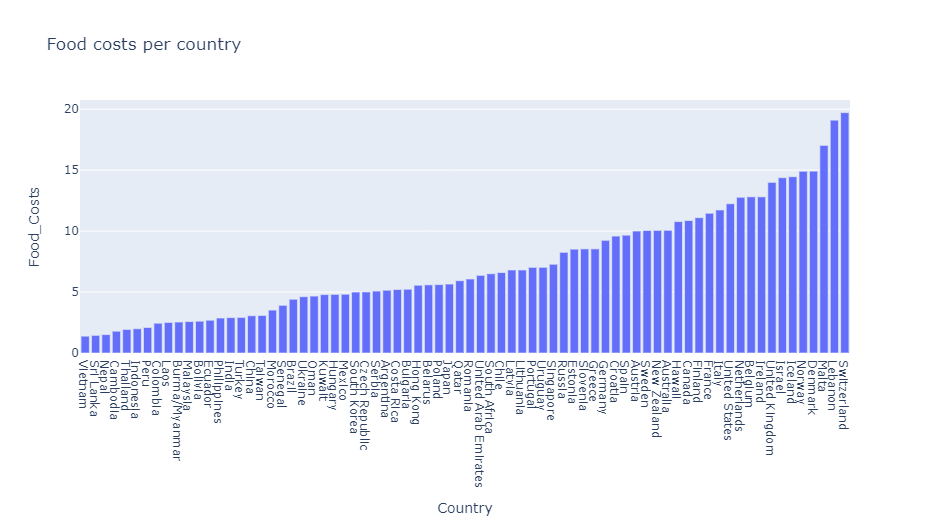
Next, we try to find a pattern in food costs.
Even with food costs, we see that the most workcation popular countries have their food costs per meal higher than other countries in our data.
Food costs per city:
food = train.copy()
food=food.sort_values(by="Food: Average cost of a meal at a local, mid-level restaurant")
food.rename(columns={"Food: Average cost of a meal at a local, mid-level restaurant":"Food_Costs"},inplace=True)
fig = px.line(food,x="City",y="Food_Costs",title="Food costs per city")
fig.update_layout(
    xaxis = dict(
        tickmode = 'linear',
        dtick = 2,
        type = 'category',
        tick0 = 1
    )
)
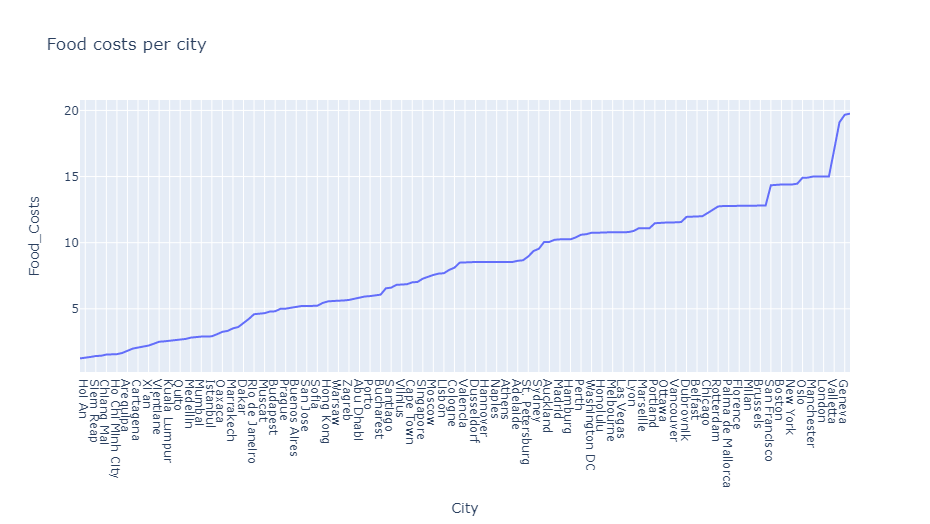
Highest costing meals are available in Beirut, London, Copenhagen, New York, and Tel Aviv. Lowest costing meals are often found at Arequipa, Bangkok, Siem Reap, Hanoi.
Food costs per country:
acc = train.copy()
acc.rename(columns={"Food: Average cost of a meal at a local, mid-level restaurant":"Food_Costs"},inplace=True)
acc = acc.groupby(['Country'])['Food_Costs'].mean().reset_index()
acc=acc.sort_values(by="Food_Costs")
fig = px.bar(acc,x="Country",y="Food_Costs",title="Food costs per country")
fig.update_layout(
    xaxis = dict(
        tickmode = 'linear',
        dtick = 1,
        type = 'category',
        tick0 = 1
    )
)
train.rename(columns={"Tourist attractions: Number of ‘Things to do’ on Tripadvisor":"Things_to_do"},inplace=True)
acc = train.copy()
#acc.rename(columns={"Tourist attractions: Number of ‘Things to do’ on Tripadvisor":"Things_to_do"},inplace=True)
acc = acc.groupby(['Country'])['Things_to_do'].mean().reset_index()
acc=acc.sort_values(by="Things_to_do")
fig = px.scatter(acc,x="Country",size="Things_to_do",title="Things to do based on country")
fig.update_layout(
    xaxis = dict(
        tickmode = 'linear',
        dtick = 2,
        type = 'category',
        tick0 = 1
    )
)
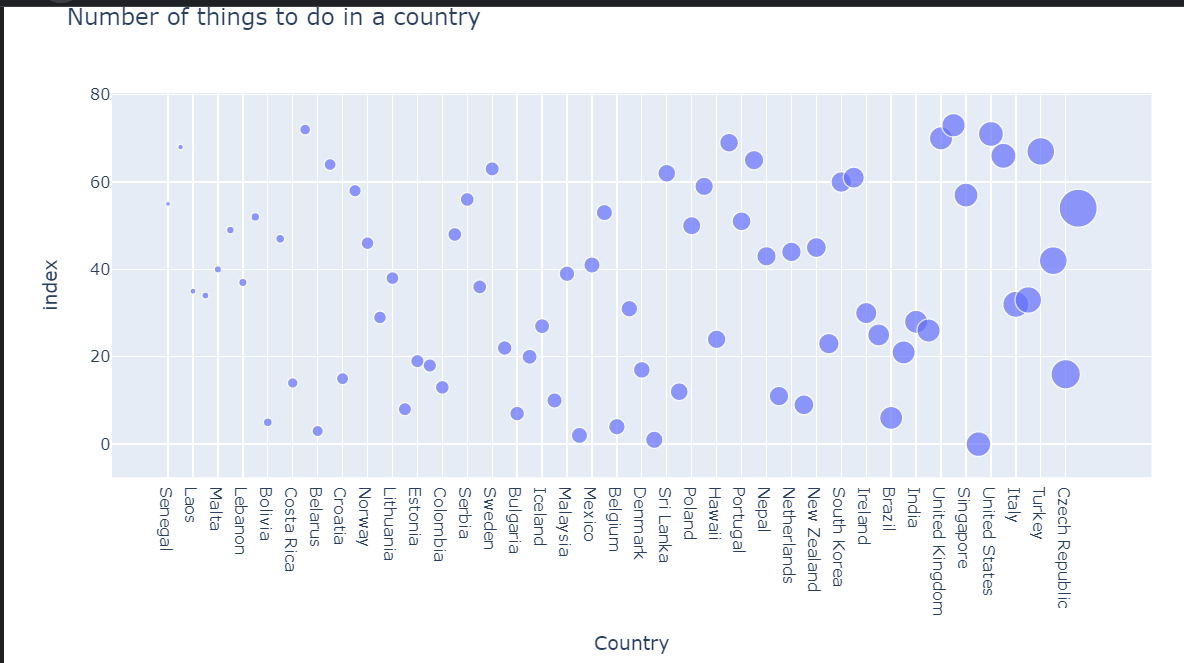
We are now starting to see a pattern, countries with a higher number of things to do have more cities than are workcation cities.
The plot above is a scatter plot with its size being determined by the number of things to do.
Can increasing co-working spaces and providing better internet facilities in the country garner more tourists?
acc = train.copy()
acc.rename(columns={"Co-working spaces: Number of co-working spaces":"Co_working_spaces"},inplace=True)
acc = acc.groupby(['Country'])['Co_working_spaces'].mean().reset_index()
acc=acc.sort_values(by='Co_working_spaces')
px.bar(acc,y="Country",x="Co_working_spaces",title="Co Working Spaces per country",orientation='h')
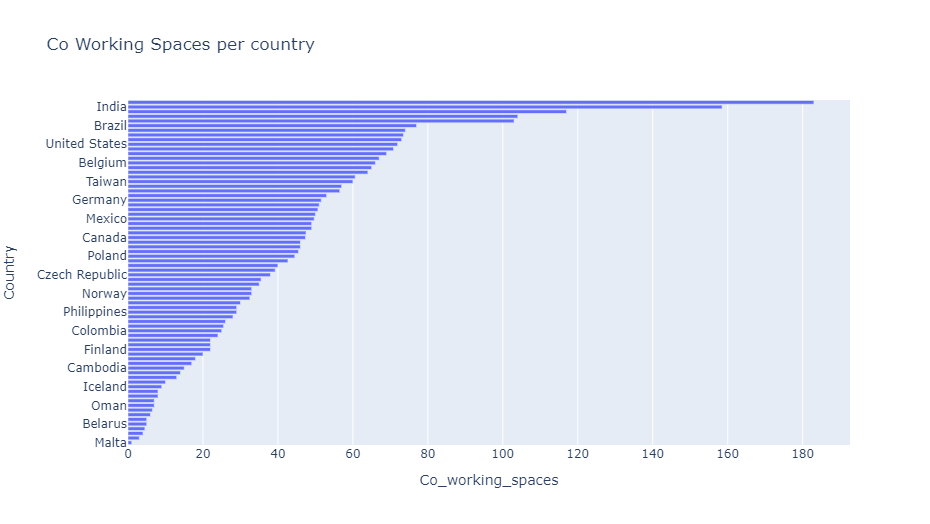
Source : Author
acc = train.copy()
acc.rename(columns={"Remote connection: Average WiFi speed (Mbps per second)":"Internet_connection"},inplace=True)
acc = acc.groupby(['Country'])['Internet_connection'].mean().reset_index()
acc=acc.sort_values(by='Internet_connection')
px.bar(acc,y="Country",x="Internet_connection",title="Internet connection per country",orientation='h')
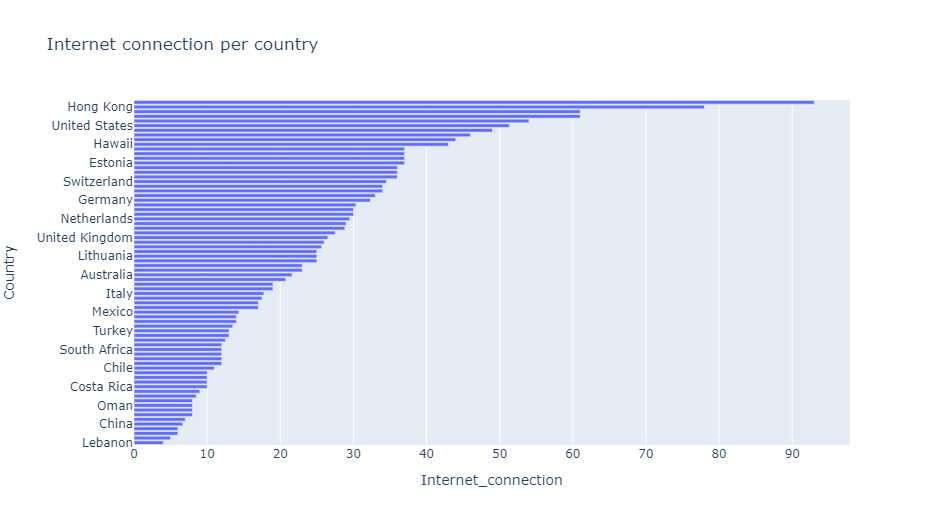
We, see a pattern, countries with better internet connectivity and co-working spaces have more workcation friendly cities.Can having lower transportation costs or cheaper coffee improve a country’s chances of getting more workcation cities?
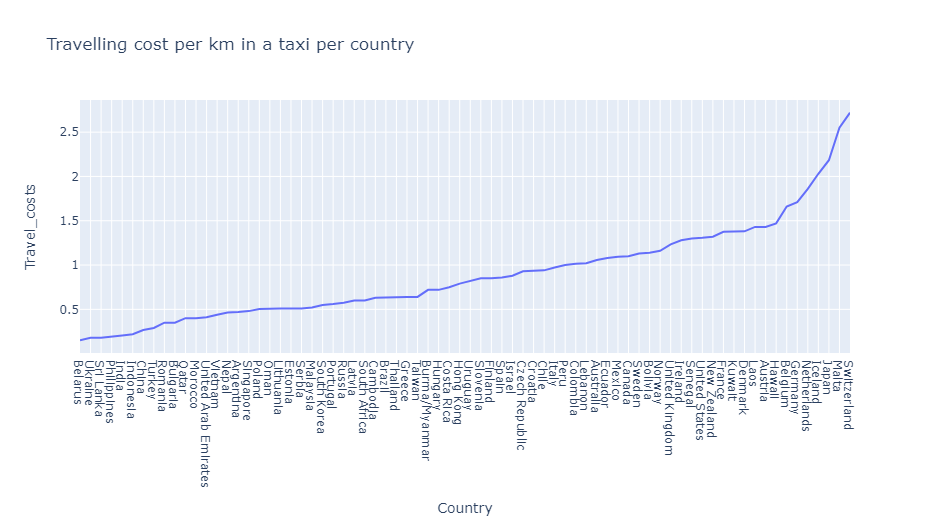
As with accommodation and food costs, taxi and coffee charges are expensive if you stay in the United States or Canada instead of staying in Sri Lanka or the Philippines.
acc = train.copy()
acc.rename(columns={"Caffeine: Average price of buying a coffee":"Caffeiene_costs"},inplace=True)
acc = acc.groupby(['Country'])['Caffeiene_costs'].mean().reset_index()
acc=acc.sort_values(by='Caffeiene_costs')
fig = px.line(acc,x="Country",y="Caffeiene_costs",title="Caffiene costs per country")
fig.update_layout(
    xaxis = dict(
        tickmode = 'linear',
        dtick = 1,
        type = 'category',
        tick0 = 0
    )
)
Conclusion
- Looking at the data, these costs do not make a country not desirable to visit, as we have the maximum number of workcation cities in places with a higher cost of living.
- Having more things to do in the country and being popular on Instagram seem to be stronger factors in considering a country to be a good place to visit while you work.
About the Author
I work as an Analyst and like to interrogate data and share my findings through technical articles. You can read other articles published by me on Analytics Vidhya here. You can reach out to me here. You can find the entire python code used in the article here.
The media shown in this article is not owned by Analytics Vidhya and are used at the Author’s discretion


