Nifty 50 Historical Data Using Python (2024)
This article was published as a part of the Data Science Blogathon.
Introduction
In India, a pandemic has drawn more private and govt. sectors to adopt work from home. This resulted in people having more time to research investing in stocks. Many start-ups and apps came into the picture for investing in stocks. A lot of people wanted to use different tools and techniques to analyze stocks.
If you have coding knowledge and want to analyze nifty 50 historical data and get insights, then this article will you out.
Once we have the proper historical data, then we can analyze trends and start investing in stocks.
Now thinking about how to get nifty 50 historical data?
There are a couple of websites which provide nifty historical data.
Please find websites below which provide historical data.
1. https://www1.nseindia.com/
2. https://finance.yahoo.com/
3. https://in.investing.com/
In this article, we will concentrate on investing.com. We will see how to extract Nifty 50 historical data from this website.
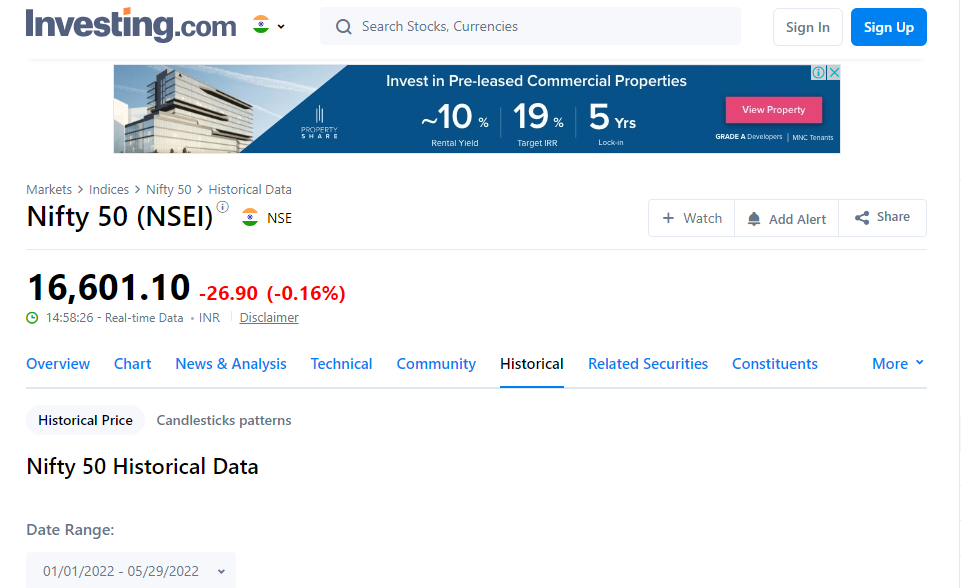
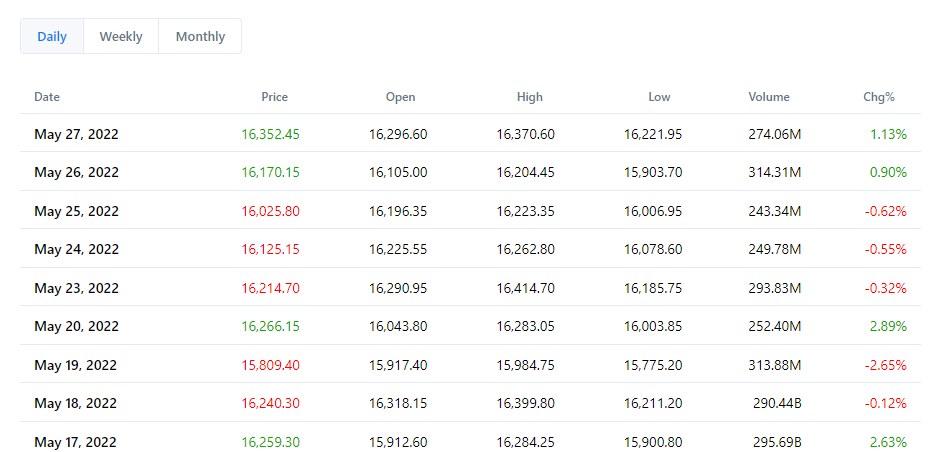
This article will scrap nifty 50 data by passing the date range. After passing the date range, we will get data as below.
Web scraping tools or modules used for getting data from nifty data
- Selenium
Selenium is also used for web scraping. Selenium requires a webdriver to interface with the browser. Here we will use the Chrome browser. Selenium will use a chrome driver as a webdriver to control the chrome browser.
- Requests
The request library or module is used for making HTTP requests to the site.
- BeautifulSoup
The BeautifulSoup library or module used for parsing HTML documents.
Below are the steps to be followed for the web scraping nifty historical data from investing.com
- Installing or downloading a chrome driver in Windows and Linux.
- Loading chrome driver using Selenium’s web driver for web scraping.
- Preparing Start Date and End Date for fetching data from investing.com.
- Constructing URL for extracting data from investing.com.
- Initializing selenium driver to get data.
- Getting the content of the page using Beautiful Soup.
- Extracting the required columns for Nifty data.
Installing or Downloading a Chrome Driver in Windows and Linux
For windows just download the required version of the chrome driver from the below-provided link and extract the chrome driver from the zip folder and store it in the same place where your python script is there
For Linux please follow the below steps
apt-get update # to update ubuntu to correctly run apt installapt install chromium-chromedrivercp /usr/lib/chromium-browser/chromedriver /usr/binsys.path.insert(0,'/usr/lib/chromium-browser/chromedriver')chrome_options = webdriver.ChromeOptions()
chrome_options.add_argument('--headless')
chrome_options.add_argument('--no-sandbox')
chrome_options.add_argument('--disable-dev-shm-usage')Selenium’s Web Driver for Web Scraping
driver = webdriver.Chrome()driver = webdriver.Chrome('chromedriver',chrome_options=chrome_options)Preparing Start Date and End Date for Fetching Data
Please find below the code for preparing the start date and end date. We will be pulling data from starting of the year to the current day.
The end date will be the current day and the start of the year will be the start date
Constructing URL for Extracting Data from investing.com
url="https://in.investing.com/indices/s-p-cnx-nifty-historical-data?end_date={}&st_date={}".format(enddate,stdate)Initializing Selenium Driver to get Data
The Below code will invoke the chrome browser by passing the above URL.
driver.get(url)
Getting the Content of the Page using Beautiful Soup
#Get Page Content Data
content = driver.page_source
soup = BeautifulSoup(content)
Extracting Required Columns for Nifty 50 Data
Now we will prepare a list and extract the required columns for Nifty 50 as a list
We will initialize a list for each required column and search for the required column in the content that we got from the website.
#Loading Dates Columndate=[]
for a in soup.findAll('td', attrs={'class':'col-rowDate'}):
date_txt=a.find('span', attrs={'class':'text'})
date.append(date_txt.text)The output of the above command will be as shown below
We will search for the required details and append them to the list.
We will perform similar activities in all required fields.
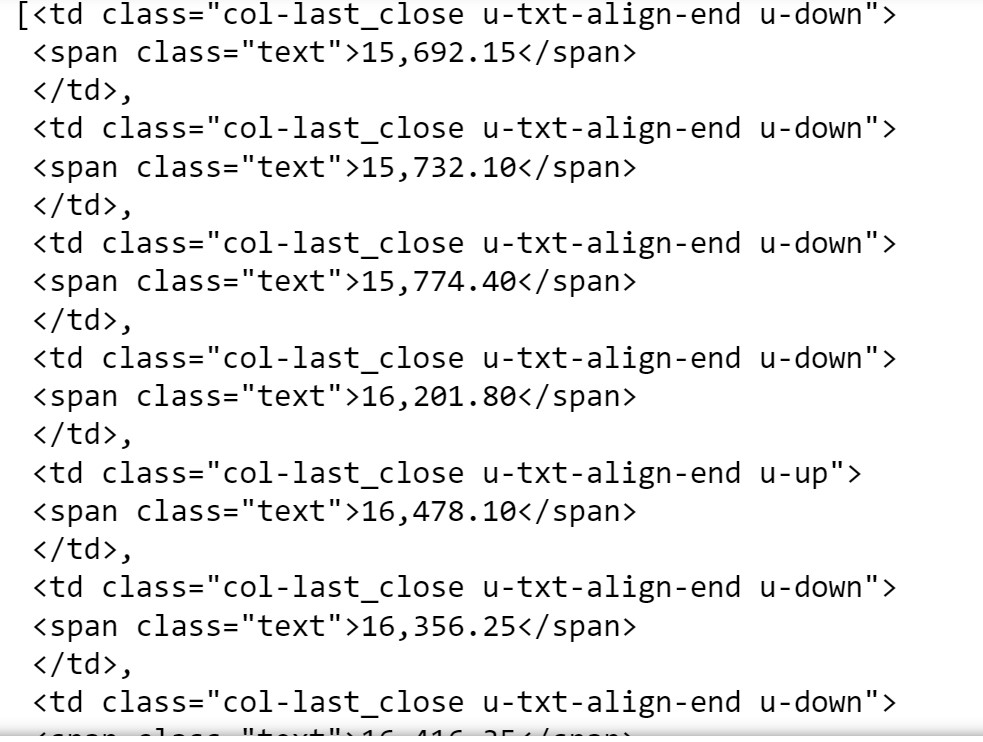
#Loading Closing Prices
close=[]
for a in soup.findAll('td', attrs={'class':'col-last_close'}):
    close_txt=a.find('span', attrs={'class':'text'})
    close.append(close_txt.text)
#Loading Open Prices
open=[]
for a in soup.findAll('td', attrs={'class':'col-last_open'}):
    open_txt=a.find('span', attrs={'class':'text'})
    open.append(open_txt.text)
#Loading High Prices
high=[]
for a in soup.findAll('td', attrs={'class':'col-last_max'}):
    high_txt=a.find('span', attrs={'class':'text'})
    high.append(high_txt.text)
#Loading Low Prices
low=[]
for a in soup.findAll('td', attrs={'class':'col-last_min'}):
    low_txt=a.find('span', attrs={'class':'text'})
    low.append(low_txt.text)
Preparing DataFrame and Transforming Data
## Prepare DataFrame
df_nifty = pd.DataFrame({'Date':date,'Open':open,'High':high,'Low':low,'Close':close})
Below is the sample data after converting it into DataFrame.
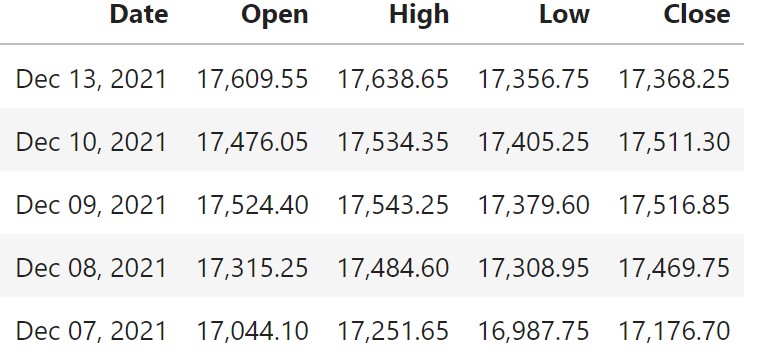
If you see the above screenshot of data, the Date is not in proper format and the other columns’ data is in string.
Now we will format the data. First, remove commas in the column data and then convert them to the required format, like string to date and string to float.
df_nifty['Date'] = df_nifty['Date'].str.replace(r",","")
df_nifty['Date']=pd.to_datetime(df_nifty.Date , format = '%b %d %Y')
df_nifty=df_nifty.drop_duplicates(subset="Date") #droping dupicate data
data = df_nifty
data['Close']=data['Close'].str.replace(r",","").astype('float')
data['Open']=data['Open'].str.replace(r",","").astype('float')
data['High']=data['High'].str.replace(r",","").astype('float')
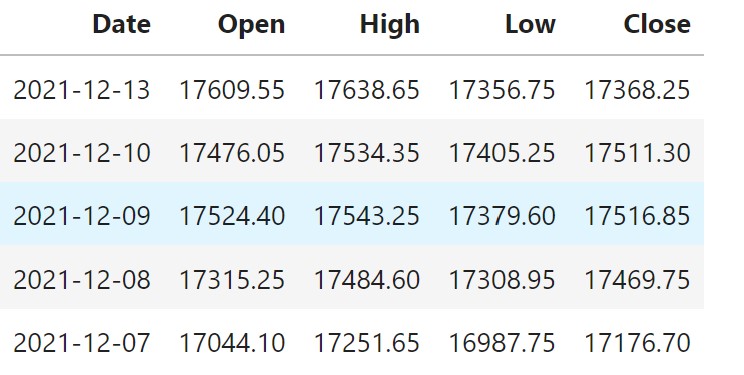
data['Low']=data['Low'].str.replace(r",","").astype('float')Sample data are shown below
Conclusion
In this article, we explored the process of extracting nifty 50 data from investing.com using web scraping in Python. We gained insights into installing Selenium on both Windows and Linux systems. Additionally, we acquired a fundamental understanding of locating elements within content using Beautiful Soup and storing them in a list. Moreover, we learned the basics of merging essential columns into a DataFrame and touched upon the rudiments of data cleaning and conversion into the proper format.
Now we have nifty historical data daily data and we can start analyzing upward and downward trends.
We can roll up data to weekly, monthly and quarterly.
What can we do next?
- EDA of the extracted nifty data.
Start Exploratory Data Analysis of data by plotting different graphs , checking for missing data , checking for outliers , checking correlation etc.
- Convert the extracted data into time series.
Convert the extracted data into timeseries data using different libraries.
- Use multiple models for forecasting.
Once we convert data into time series, then we can use multiple models for forecasting, like Facebook’s NeuralProphet , AUTO ARIMA , Long Short Term Memory (LSTM) etc.
Please find below the GitHub link which has code for both Windows and Linux.
Fork the repo and implement the code accordingly.
https://github.com/bashamsc/nifty_web_scraping
The media shown in this article is not owned by Analytics Vidhya and is used at the Author’s discretion.


It is scraping not scrapping. Scrapping means to dispose of. Scraping means to "slide" the data off of the web page.
Grateful that you mentioned how to use python for obtaining historical data on the nifty 50 price. This shall assist several investors.