This article was published as a part of the Data Science Blogathon.
Introduction
Academia is the integral coaching zone for humanity’s future talent and the development of new approaches toward our survival as human species in terms of task execution and thinking. The academic score is an indicator used for performance assessment and management by schools and institutions, where rank and scale student talent and ability.
Data Context
We first see all the variables in the dataset and which variables we need for targets and their related attributions towards generating a prediction correctly. We have to use relatable and dependent variables toward a predictive outcome.
We can see that our dataset has multiple dependent and independent variables which showcase academic workflow and social and motivational influencing factors towards.
Our goal with the dataset is to predict the future math scores and related variables to see its interactive expedition.
Model Stage
Educational Model
We will choose ‘math score’ as our target variable against all remaining variables to get the correct prediction with a 30% Split. We will use 70% training and 30% testing(unseen) data for predictive accuracy.
.png)
We can see above that math score is linearly influenced by reading and writing scores showing students who are good at reading and writing can also learn maths at a good pace.
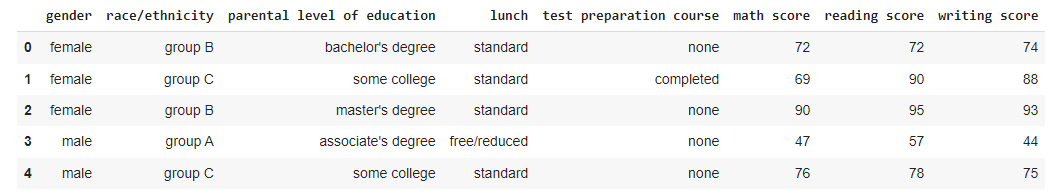
We first transform all categorical variables using a label encoder to make it easier for Machine Learning modeling to detect inputs and give outputs. As shown below:
As shown above, our inputs have transformed into a readable format for ML algorithms.
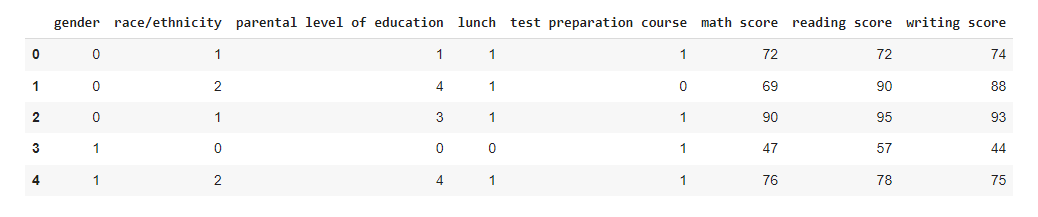
We feed our transformed data into Pycaret algorithms and get model recommendations below.
Our model choices from the list above are:
- One class SVM(svm)
- Isolation forest(forest).
- Principal Component Analysis(PCA).
They are the best choices for accounting outliers into our data fitting and forecasting datasets with accuracy even if the linear data becomes non-linear at any point of the journey and help us identify and reduce those irrelevant data points to achieve accuracy in predictions as math scores involve grading beyond percentile levels and can create anomalies.
.png)
IOF Model
.png)
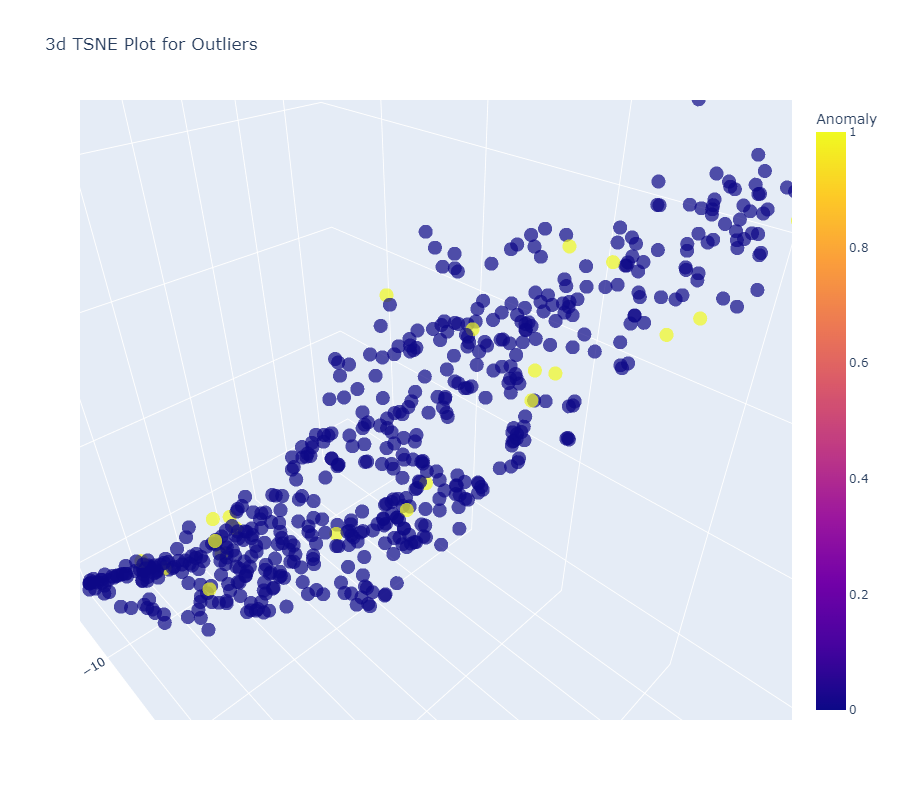
We can see Linear relationships in all three model visualizations. We choose PCA as our best predictive approach amongst all three as data shows best fitted in it with anomalies accounted.
Score relevance
After conducting our Exploratory analysis of our PCA model predictions generated, we can create insights for education strategy development to improve math scores earnt by students.
.png)
We can see that males are getting better-predicted grades for maths than females, which might demotivate females from improved scores. Thus, extra classes for maths need to be provided to females at their discretion to allow them to improve without demotivation.
.png)
We have to identify Group D as they are showing the best predictive math scores so they can help other groups in math teaching assistance.
.png)
We are noticing that female parents are showing higher predicted levels of education. However, in terms of math scores, males still receive more grades at the top quartile, thus showing that cultural factors or promoting male education at Home and School may be the outer influencing variable behind it.
Modeling Machine Learning life cycle Programming
Dataset is available in the below link: StudentPerformanceDataset
# Import necessary libraries
import pandas as pd
import numpy as np
from scipy.stats import shapiro # For statistical tests
from sklearn.model_selection import train_test_split # For splitting data
from sklearn.metrics import accuracy_score, confusion_matrix, classification_report # For evaluating model performance
from sklearn.ensemble import RandomForestClassifier # For building a random forest model
import missingno as mn # For visualizing missing data
import seaborn as sns # For data visualization
from matplotlib import pyplot as plt # For plotting

# Source: https://www.kaggle.com/datasets/adithyabshetty100/student-performance
# Read the dataset
df = pd.read_csv('StudentsPerformance.csv')
print("Dataset Preview:")
print(df.head())
print("\nData Types:")
print(df.dtypes)

# Visualize missing values
mn.heatmap(df)

# Encoding categorical variables
encoder = LabelEncoder()
df['gender'] = encoder.fit_transform(df['gender'])
df['race/ethnicity'] = encoder.fit_transform(df['race/ethnicity'])
df['parental level of education'] = encoder.fit_transform(df['parental level of education'])
df['lunch'] = encoder.fit_transform(df['lunch'])
df['test preparation course'] = encoder.fit_transform(df['test preparation course'])

# Check transformed data
print("\nTransformed Data Preview:")
print(df.head())

# Split data into features (X) and target (y)
X = df.drop(columns=['math score']) # Assuming "math score" is the target variable
y = df['math score']

# Split data into training and testing sets
X_train, X_test, y_train, y_test = train_test_split(X, y, test_size=0.3, random_state=42)

# Model Training - Random Forest Classifier
model = RandomForestClassifier(random_state=42)
model.fit(X_train, y_train)

# Model Evaluation
y_pred = model.predict(X_test)
accuracy = accuracy_score(y_test, y_pred)
conf_matrix = confusion_matrix(y_test, y_pred)
class_report = classification_report(y_test, y_pred)

print("\nModel Accuracy:", accuracy)
print("\nConfusion Matrix:\n", conf_matrix)
print("\nClassification Report:\n", class_report)

# Visualizing relationships
sns.pairplot(df)
plt.show()
Conclusion
Project Success
We were able to get an analysis of the Female grading and model predictions of it and insight into cultural trends in our education settings.With the implementation and analysis of our machine learning workflow above, we can:
- Create Improvement plans for female academic performance in classrooms.
- Do awareness sessions on education and the importance of meritocracy in bridging the gap between success likelihood between males and females.
- Invest in a gender-neutral curriculum and encourage females in STEM-based subject selection as we can see higher rates of male performance within it.
Project Implementation processTo implement machine learning workflow at any institute, we need to follow a particular sequence of steps, including pilot testing and feasibility study, which include:
- Conduct data analysis on the ratio of school genders.
- Check academic success records of female and male students and other recognized genders in school settings.
- Check which gender lacks Academic success.
- Sign an agreement between the Institute and the implementor regarding data migration and usage.
- Ensure all ethical guidelines are met on the dataset used.
- Feature engineer the variables “gender”, “race/ethnicity”, “parental level of education”, “lunch”,”test preparation course”, “math score”, “reading score”, “writing score”.
- Run the model on the data and see if it needs cross-validation for more improvement.
- Deploy it on the Institute’s cloud server or local machines once the test run is successful with the stakeholder’s agreement.
The media shown in this article is not owned by Analytics Vidhya and is used at the Author’s discretion.
I'm currently studying MSc in Data Science and AI from the University of London program at Goldsmiths University, Where I am currently studying Big Data Analytics, Neural Network predictabilities, and Machine Learning computation.
I'm also a part-time Business intelligence trainer and Consultant for a data consultancy called Ai datayard.


