This article was published as a part of the Data Science Blogathon.
Have you ever tried predicting your favorite stock’s price action? A stock’s price action varies with the company’s fundamentals and technicals. Sentiments drive this action as well. But, can a person without the knowledge of technicals and fundamentals predict the price action? While it’s true that one of the best ways to understand the short-term price action is by using OHLC candlesticks and keeping track of the market’s sentiments, we can predict the stock’s price action by time series forecasting.
In this article, we will understand the basics of Time Series Forecasting and different approaches to time series prediction. We will implement Facebook’s Prophet Model to predict the stock price action by considering a dataset of 5 years and predicting the movement for the next year.
Time Series is the collection of Indexed data at Datestamps/Timestamps in order. The values in the Dataset frequently change over time. The prediction of values for future timestamps is called Time Series Forecasting. Prominent examples of Time Series Forecasting include Stock Price prediction, City Weather forecasting, Tourist count analysis, etc.

There are several different methods that one can use for forecasting values like 1. Calculating the mean of all the observations. 2. Preferencing the latest observations and calculating the recent 2 observation average. 3. Interpolation methods like Newton’s or Lagrange’s, and the list continues. But, In Real Time, Time series Forecasting is affected by 3 terms:
1. Seasonality: This explains how values change with Seasons. e.g., Sales of a shop near a school drop during Summer break or Holiday Seasons. Also, Weather in India varies heavily throughout the seasons. Thus, while forecasting, we need to keep this in focus.
2. Trends: Trends are an important factor in time series forecasting as it captures our variable’s movement(Exponentiality or Depletion) over a specific period.
3. Unexpected events: Predicting the future is difficult because events can abruptly alter, and the future often diverges significantly from the past. These abrupt shifts are referred to as endogenous shocks by economists. We all saw how the pandemic affected the stock market. Capturing unexpected events in our forecasts is very difficult.
Time Series forecasting can be implemented by numerous Machine learning Models like the AR family, which includes AR, MA, ARMA, ARIMA, ARIMAX, SARIMAX, etc. LSTM(Long Short Term Memory) is a deep learning model built extensively for Time Series Forecasting.
The autoregression(AR) time series model predicts the value at future timestamps using Data entries from past timestamps as input to a regression equation. An AR model regresses Itself.
ARMA stands for Auto Regressive Moving Average, and it’s a special kind of time series analysis. This model also considers the moving average, which helps for unstable values.
An artificial recurrent neural network, LSTM is utilized in deep learning and can process whole data streams. LSTM has evolved into a trending method for time series forecasting due to the model’s capacity to learn long-term sequences of observations.
Prophet(previously FbProphet), by META(previously Facebook), is a method for predicting time series data that uses an additive model to suit non-linear trends with seasonality that occurs annually, monthly, daily, and on holidays. Prophet typically manages outliers well and is robust to missing data and changes in the trend. The Prophet library can automatically manage seasonality parameters. The official guide to Prophet is here.
This article will implement the Prophet model for an Indian company’s stock price forecast(MRPL). We will be taking into consideration the previous 5-year dataset from YFinance. YFinance, Yahoo Finance’s API, is a reliable source for stock market data. The Prophet model and the YFinance can be pip installed in your local environment. We will first train our Model and calculate the Mean Absolute Error to evaluate our Model.
!pip install fbprophet
!pip install yfinance
Next, we must import all the necessary packages for Data extraction, Visualisations, and the Prophet Model.
#IMPORTING ALL THE NECESSARY PACKAGES.
import matplotlib.pyplot as plt                                                 #Importing matplotlib to plot and analyse data.
import pandas as pd
import plotly.express as px
from pandas import read_csv
from fbprophet import Prophet                                                   #Importing prophet (prediction and forecasting library.)
import yfinance as yf                                                           #importing yahoo finance to generate historic data.
The YFinance is an API tool that will take the ticker name, start time, and end time as parameters and will return the historical data of that stock between the defined period. A ticker is a unique codename given to every stock. It has a ‘.ns’ suffix mostly to the stock’s name.
Python Code:
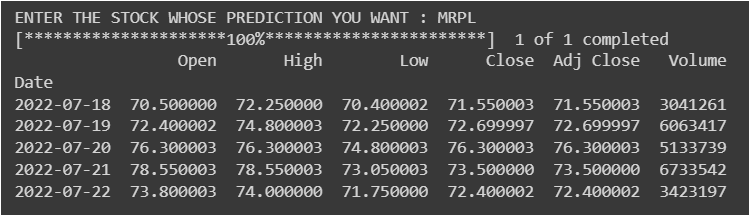
We get a total of 6 columns, including OHLC and volume indexed by Date.
Let’s reset the index and make a date a part of the DataFrame.
df = df.reset_index() #indexing data_frame
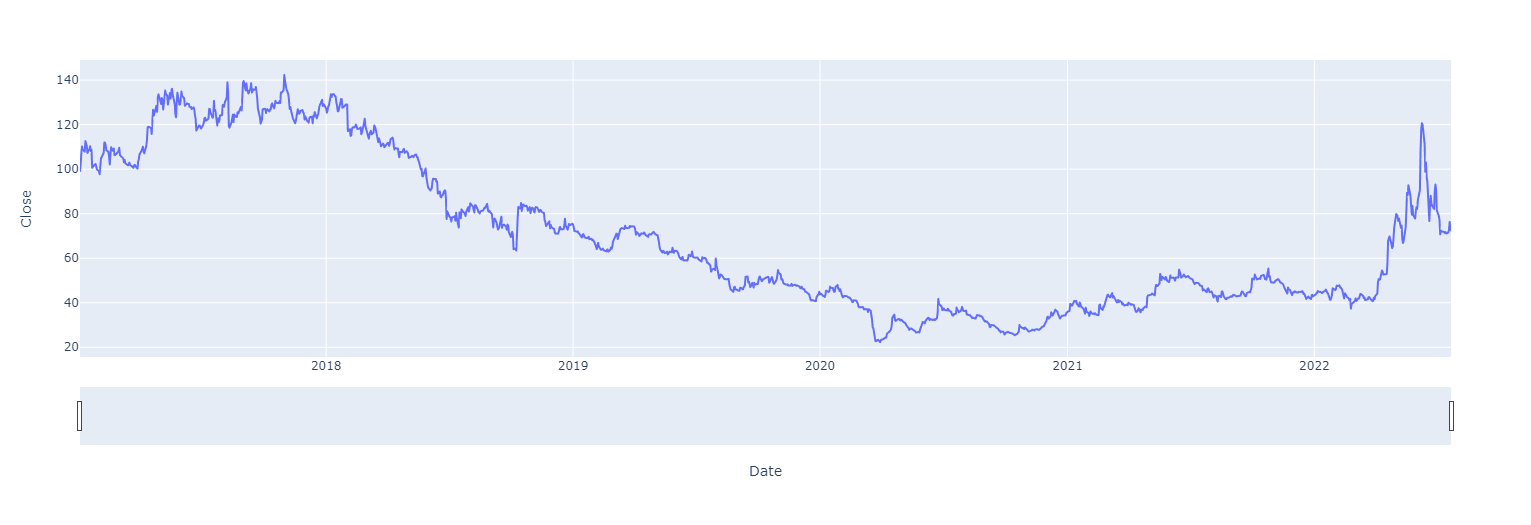
Let’s Visualise the past 5 years’ price action in the DataFrame. We will use plotly for the same as it provides range slider, making visualization more attractive.
fig = px.line(df, x='Date', y='Close')
fig.update_xaxes(rangeslider_visible=True)
fig.show()
Note: Prophet models only understand the ds and y as input and output features. So before training the model, we will have to add 2 columns denoting value and date.
df[['ds','y']] = df[['Date','Adj Close']]                       #preparing expected column names
df
.png)
Next up, we divide our data for training and testing. I’ve chosen an 80-20 ratio for training and testing the model.
train_data = df.sample(frac=0.8, random_state=0)
test_data = df.drop(train_data.index)
print(f'training data size : {train_data.shape}')
print(f'testing data size : {test_data.shape}')
OUTPUT:
training data size : (1100, 9)
validation data size : (275, 9)
We will import Mean_Absolute_Error from the sklearn.metrics library.
from sklearn.metrics import mean_absolute_error
model = Prophet(daily_seasonality=True)
model.fit(train_data)
y_actual = test_data['y']
y_predicted = prediction['yhat']
y_predicted = y_predicted.astype(int)
mean_absolute_error(y_actual, y_predicted)
prediction = model.predict(pd.DataFrame({'ds':test_data['ds']}))
OUTPUT: 5.368521409468217
it means the mean error in our actual value and the predicted value is 5.368.
Let’s visualize the predicted and the actual values.
plt.plot(test_data['ds'], y_predicted, 'k')
plt.plot(test_data['ds'], y_actual, 'y')
plt.xlabel("Year")
plt.ylabel("Price Action")
plt.title("Price Action: Predicted vs Actual")
plt.show()
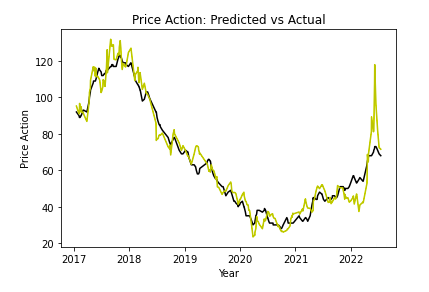
The yellow line denotes the actual price action, while the black line denotes the predicted price action. We see that the prediction for the testing data has been very closely accurate. Now that we have tested our model let’s predict the future of this stock. Let’s look out for a 365-day prediction.
model = Prophet()                                                               #creating an instant of prophet class in model.
model.fit(data_frame)                                                           #fitting data_frame to the model.
future = model.make_future_dataframe(365)                                       #making future dataframe for 365 days and storing the date values in future.
forecast = model.predict(future)                                                #using predict function of python, predicting the values for future data values and storing it in forecast.
model.plot(forecast)                                                            #plotting the values in forecast using atplotlib.
plt.show()                                                                      #displaying the graph.
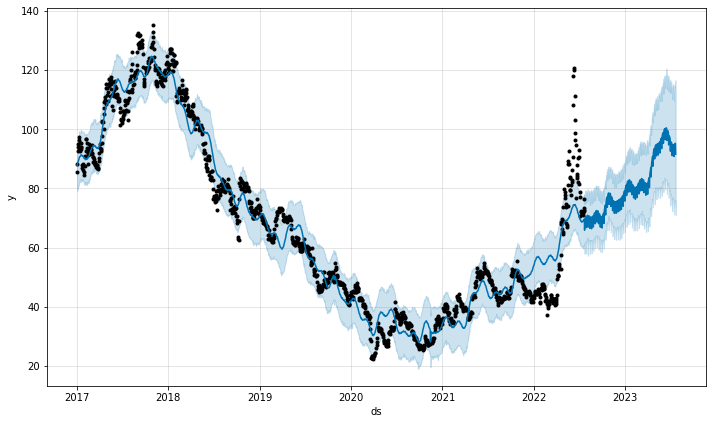
Let’s print the tail of the prediction.
.png)
We can see that the Model predicts the stock price on 22/07/2023, 1 year from now, would be 91, and considering unexpected events, it evaluates the low and high as 70.94 and 112.37, respectively.
Facebook’s Prophet model is the messiah itself in the field of Time Series Forecasting. It is fast and accurate compared to most of its peers. The Prophet model is preferred over other models when you are working with a non-linear module of data and the observations taken to change over seasons like yearly, monthly, weekly, or daily. In addition, the Prophet model is robust to missing values and outliers and knows how to deal with the holiday effects. Therefore, Prophet is a must-try model if you are interested in business analytics of sales, a tech geek trying to forecast foot traffic for a tourist attraction, or a fin-tech enthusiast curious to catch the falling knife or the launching rocket. Try it out for yourself, and let us know how it goes.
In this article,
I hope you found this post to be interesting on Facebook’s prophet. This is my LinkedIn profile URL. Feel free to connect with me.
The media shown in this article is not owned by Analytics Vidhya and is used at the Author’s discretion.
Lorem ipsum dolor sit amet, consectetur adipiscing elit,


