This article was published as a part of the Data Science Blogathon.
Introduction
Textual data from social media posts, customer feedback, and reviews are valuable resources for any business. There is a host of useful information in such unstructured data that we can discover. Making sense of this unstructured data can help companies better understand how and why customers prefer their goods and services, allowing them to adjust their operations as soon as possible.
Text Mining can help discover insights from unstructured data like reviews data. Using this article, we will try to understand how we can use different text mining operations to find meaningful patterns and insights out of business review data and answer some of the typical business questions and make necessary recommendations.
Let us take the case of ‘Earl Sandwich,’ the most popular fast-food restaurant, as per the highest number of 5-star ratings given by users on the Yelp platform. The Yelp reviews dataset consists of valuable features like business_id, user_id, review_id, stars, date, and text, which are the reviews. With the help of text mining, this data can give valuable insights to help Earl Sandwich’s Management and Marketing team make informed decisions for business improvements.
Common Business Questions That we can Answer From The Analysis of Review Data
We will break down our analysis into a few typical business questions, as listed below. These are common questions that any business owner would like to get the answers to better understand their customers’ concerns, likes, and dislikes.
1. What is the yearly trend of the number of reviews?
2. How is the customer’s rating distributed?
3. Which are the most common words in the reviews?
4. Which pair of words show up together frequently in any review?
5. Why do people like the restaurant? Because of unique taste, quality, or service.
6. What is the user sentiment attached to the review?
7. What is the topic focus of the reviews?
Before moving into analysis, we will have to filter out Earl Sandwich’s reviews data from the entire Yelp reviews dataset, which also consists of other businesses. We can apply the filter on the business_id of ‘Earl Sandwich’ and store it in a new data frame.
The Yearly Trend of the Number of Reviews Per Month
With the help of a line chart visualization, we can get the required trend. We will use the matplotlib library and plot the count of observations in the ‘text’ column concerning the Year from the ‘date’ column.
import matplotlib.pyplot as plt
df_1['date'] = pd.to_datetime(df_1['date'])
df_1 = df_1.set_index('date')
plt.plot(df_1['text'].resample('M').count())
plt.xlabel('Year')
plt.ylabel('Number of reviews')
plt.title('Number of reviews per month')
plt.show()
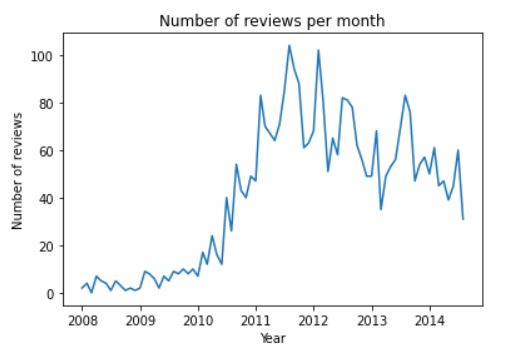
The above chart from code output shows that the reviews are from 2008 to 2014, i.e., around six years. The number of reviews per month increased sharply from 2010 onwards, which could mean that the fast-food chain was becoming more and more popular between 2010 to 2012, with a peak of almost 100 reviews per month. But there has been some decline since then, where we see only 40 customers writing a review every month in 2014. It implies that the company has reached a maturity stage in its business, so to attract new customers, the company can experiment with its brand, offerings, and pricing.
Distribution of Customer Rating
Basic visualizations using the matplotlib or seaborn library will give us the rating’s distribution. We will create two charts here, i.e., Percentage distributions of Star wise ratings and Year wise Average Monthly Star ratings, respectively.
import seaborn as sns
ax = sns.barplot(data=df_1, x='stars', y='stars', estimator=lambda x: len(x) / len(df_1) * 100)
ax.set(ylabel="Percent")
plt.title('Distribution of Customer Rating')
plt.show()
plt.plot(df_1['stars'].resample('M').mean())
plt.xlabel('Year')
plt.ylabel('Rating')
plt.title('Average Monthly Customer Rating')
plt.ylim(0,5)
plt.show()
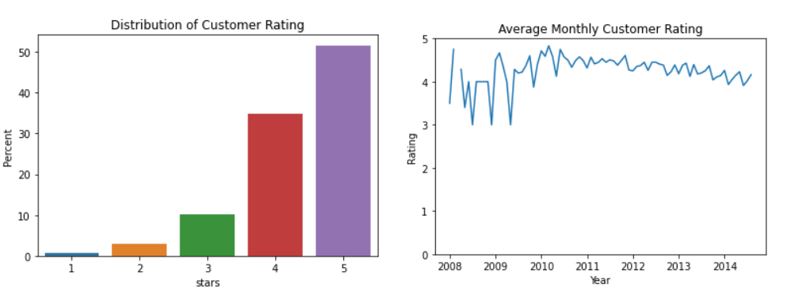
We can see that over 80% of the customers have given four or 5-star ratings, which means that most customers are delighted with the restaurant. Also, there is not much variation in the rating, and it is pretty stable at 4.5. The company should capitalize on its frequent and loyal customers and look for strategies to maintain long-term relationships with them and retain them using discounts and loyalty programs.
The Most Common and High-frequency Words in the Review Data
Before analyzing the most frequent words, we need to preprocess the review text data. Preprocessing of textual data involves various techniques like:
1. Tokenization to create a token for each word.
2. Regular expressions to remove patterns of unwanted characters and symbols from the sentences.
3. Removal of stopwords like ‘a’, ‘an’, ‘the,’ etc.
4. Stemming & lemmatization, which groups together the inflected forms of a word like run, ran, & running, so we can analyze them as a single item.
NLTK library contains all these preprocessing functions.
import string
import nltk
nltk.download('punkt')
nltk.download('stopwords')
nltk.download('wordnet')
nltk.download('omw-1.4')
from nltk.corpus import stopwords
from nltk.tokenize import word_tokenize
from nltk.stem import WordNetLemmatizer
from nltk.tokenize import regexp_tokenize, wordpunct_tokenize, blankline_tokenize
df_1['text'] = [i.replace("&", '').replace("'",'') for i in df_1['text']]
def preprocessing(text):
    words = regexp_tokenize(text, pattern='w+|$[d.]+|S+')
    tokens = [w for w in words if w.lower() not in string.punctuation]
    stopw = stopwords.words('english')
    tokens = [token for token in tokens if token not in stopw]
    tokens = [word for word in tokens if len(word)>=3]
    lemma = WordNetLemmatizer()
    tokens = [lemma.lemmatize(word) for word in tokens]
    preprocessed_text = ' '.join(tokens)
    return preprocessed_text
df_1['text']=df_1['text'].apply(preprocessing)
df_1['text'] = df_1['text'].str.lower()
text_1 = df_1['text'].values
After prepossessing, we can create a word cloud of the corpus to highlight the most frequent words. The more frequently a specific word appears in the text, the bigger and bolder it will be in the word cloud.
from wordcloud import WordCloud
wordcloud = WordCloud().generate(str(text_1))
plt.figure(figsize=(12,12))
plt.imshow(wordcloud.recolor(random_state=2017))
plt.title('Most Frequent Words')
plt.axis("off")
plt.show()
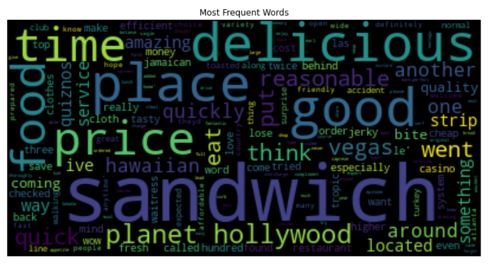
From the generated word cloud, we can see that “sandwich,” “delicious,” “place,” “good,” “price,” and some other words were mentioned by lots of customers. The company should look into the context of these words from the reviews, e.g., why delicious, which place, what price, etc., to get more insights.
Pair of Words that Often Show up Together in a Review | Text Mining
Here, we will use the Bag-of-Words approach, where we represent the text in numbers. It builds a list of words occurring within the corpus and keeps track of their frequencies. However, it discards the word order. But in this case, we need to know the sequence of words. To better capture the context, we can consider pairs or triples of words that appear next to each other, which gives us more helpful information. This process is called N-grams. Here since we need teams of words, so we will consider Bi-gram.
word_list = []
for line in text_1:
    word_list.append(preprocessing(line))
word_list
from nltk.util import ngrams
from collections import Counter
def get_ngrams(txt, n):
    n_grams = ngrams(nltk.word_tokenize(txt),n)
    return [' '.join(grams) for grams in n_grams]
word_list_1 = str(word_list)
def remove_punctuations(word_list_1):
    words = nltk.word_tokenize(word_list_1)
    punt_removed = [w for w in words if w.lower() not in string.punctuation]
    return " ".join(punt_removed)
word_list_1=remove_punctuations(word_list_1)
bigrams = get_ngrams(word_list_1, 2)
bigrams_count = Counter(bigrams)
bigram_freq = pd.DataFrame.from_dict(bigrams_count, orient='index')
bigram_freq = bigram_freq.rename(columns={'index':'words', 0:'frequency'})
bigram_freq = bigram_freq.sort_values(by='frequency', ascending=False).head(20)
print(bigram_freq)
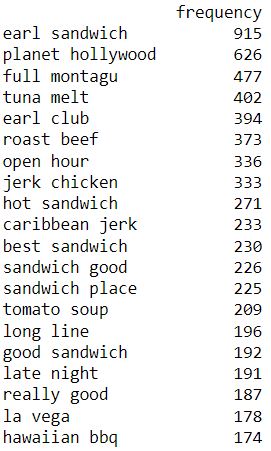
From the above-generated frequency table of the top 20 pairs of words, ‘Earl sandwich’ seems to be the most famous pair of menu items, hence the restaurant’s name. Other top-selling dishes include tuna melt, roast beef, and jerk chicken. Pairs of tokens give us more insights than single ones.
The Liking for Earl Sandwich. Is it Because of any Unique Taste, Service, or Quality?
To answer this question, we will use the Word2Vec model and see which words are most likely around our target words, such as taste, service, etc. Word2Vec learns word associations from the corpus using a neural network model. Compared to Bag-of-Words and N-grams, Word2Vec leverages the context and better captures the meaning and relationship of the word. We will use the Gensim library to perform text similarity.
from nltk.corpus import stopwords
my_stop_words = set(stopwords.words('english') + ['super', 'duper', 'place'])
from nltk.tokenize import sent_tokenize
reviews = ' '.join(df_1.text)
sentences = sent_tokenize(reviews)
good_token_clean = list()
import re
for sentence in sentences:
    eng_word = re.findall(r'[A-Za-z-]+', sentence)
    good_token_clean.append([i.lower() for i in eng_word if i.lower() not in my_stop_words])
from gensim.models import Word2Vec
model_ted = Word2Vec(sentences=good_token_clean, window=10, min_count=1, workers=4, sg=0)
model_ted.predict_output_word(['taste'], topn=10)
model_ted.predict_output_word(['service'], topn=10)
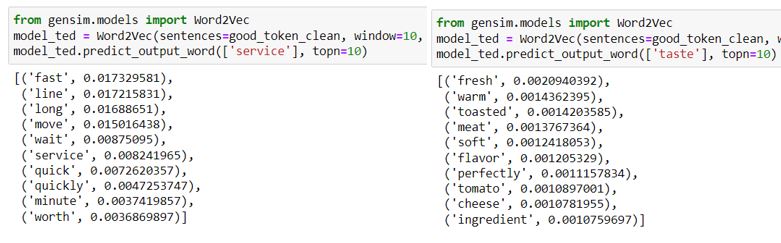
The output shows the top words around the target word and gives a score to it. We can observe that people appreciate the restaurant’s fast and quick customer service. Also, the menu items are rich in freshness and warmth, which complements the taste. We can do the same for other target words of our interest. These surrounding words are very informative and can better explain why people love or clarify certain things.
The User Sentiment or Opinion Attached to the Reviews | Text Mining
We will perform a sentiment analysis here. We can use the lexicon/rule-based: VADER method to get it. This method has a predefined list of words with sentiment scores, and it matches words from the lexicon with words from the text. For each piece of text, the VADER analyzer provides four scores to measure the sentiment: negative, neutral, positive, and compound. The compound score combines positive and negative and ranges from -1 to 1. A score below 0 is negative and above 0 is positive.
nltk.download('vader_lexicon')
from nltk.sentiment import SentimentIntensityAnalyzer
sid = SentimentIntensityAnalyzer()
sentiment_scores = df_1['text'].apply(sid.polarity_scores)
sentiment = sentiment_scores.apply(lambda x: x['compound'])
monthly_sentiment = sentiment.resample('M').mean()
plt.plot(monthly_sentiment)
plt.xlabel('Year')
plt.ylabel('Sentiment_score')
plt.title('Average Monthly Sentiment Score')
plt.ylim(0,1)
plt.show()
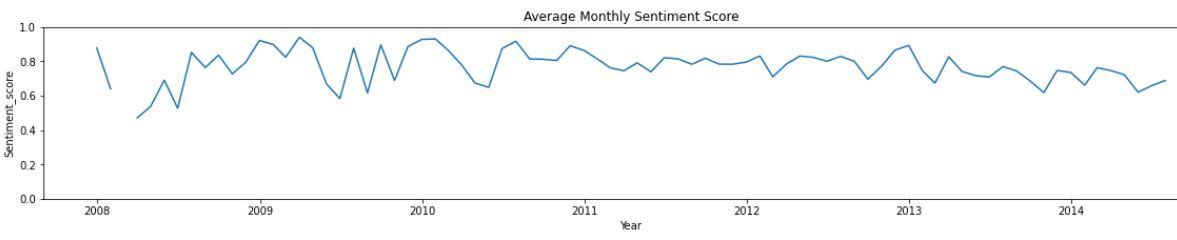
From the above sentiment plot, we can observe that, in general, this restaurant’s sentiment is positive with a constant trend. So, Earl Sandwich has maintained its quality and service over the years.
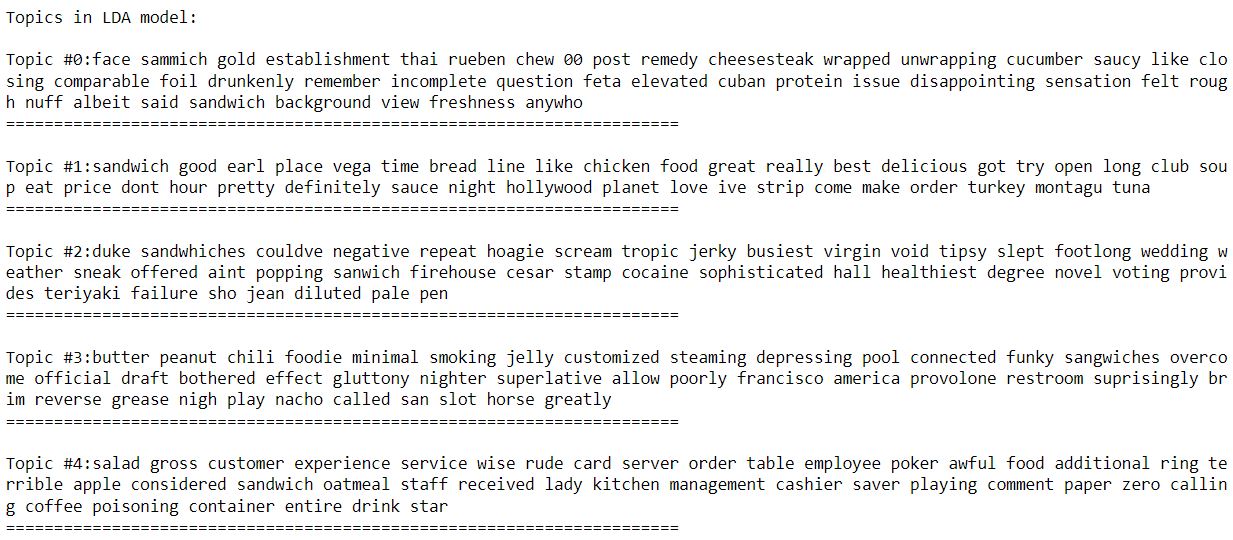
The Topic Focus of the Reviews and its Evolution Through Time | Text Mining
We must perform topic modeling to get topics out of the reviews corpus. We can use LDA (Latent Dirichlet Allocation) to perform topic modeling. In LDA, the modeling process revolves around three things: the text mining corpus, its collection of documents, and the words in the documents. The LDA algorithm first models documents through a mixture model of topics. From these generated topics, words are then assigned weights based on the probability distribution of these topics. This probabilistic assignment over words allows an LDA user to find the chances of a particular word falling into a topic. Eventually, from the collection of words assigned to a specific topic, we can gain insight into what that topic would represent from a linguistic point of view. We can further perform word cloud visualizations on each topic.
from sklearn.feature_extraction.text import CountVectorizer
lemm = WordNetLemmatizer()
class LemmaCountVectorizer(CountVectorizer):
    def build_analyzer(self):
        analyzer = super(LemmaCountVectorizer, self).build_analyzer()
        return lambda doc: (lemm.lemmatize(w) for w in analyzer(doc))
tf_vectorizer = LemmaCountVectorizer(max_df=0.95,
                                     min_df=2,
                                     stop_words='english',
                                     decode_error='ignore')
tf = tf_vectorizer.fit_transform(word_list)
from sklearn.decomposition import LatentDirichletAllocation
lda = LatentDirichletAllocation(n_components=5, max_iter=5,
                                learning_method = 'online',
                                learning_offset = 50.,
                                random_state = 0)
lda.fit(tf)
def print_top_words(model, feature_names, n_top_words):
    for index, topic in enumerate(model.components_):
        message = "nTopic #{}:".format(index)
        message += " ".join([feature_names[i] for i in topic.argsort()[:-n_top_words - 1 :-1]])
        print(message)
        print("="*70)
n_top_words = 40
print("nTopics in LDA model: ")
tf_feature_names = tf_vectorizer.get_feature_names()
print_top_words(lda, tf_feature_names, n_top_words)
first_topic = lda.components_[0]
first_topic_words = [tf_feature_names[i] for i in first_topic.argsort()[:-1000 - 1 :-1]]
firstcloud = WordCloud(
                          background_color='black',
                          width=3000,
                          height=2000
                         ).generate(" ".join(first_topic_words))
plt.imshow(firstcloud)
plt.axis('off')
plt.show()
# wordclouds for remaining topics can be created similarly
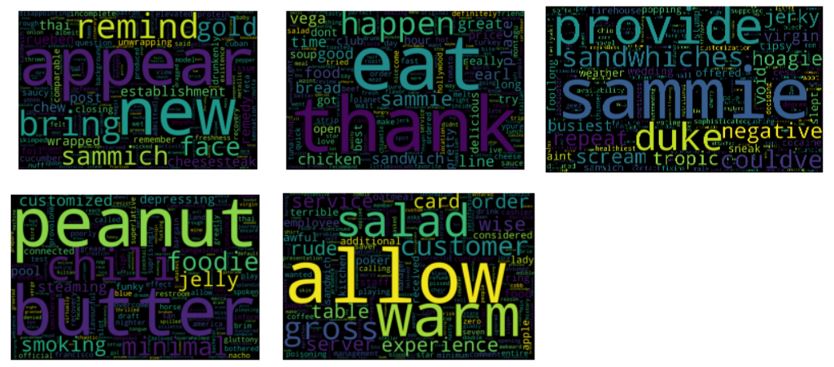
The first topic discusses verbs or action words like remind, appear, bring, etc. The second topic discusses positive words like thank, great, good, etc. The third topic concerns sandwiches, slices of bread, hoagies, i.e., submarine sandwiches, etc. The fourth topic concerns sandwich ingredients like peanuts, chili, butter, jelly, etc. The fifth topic concerns table service with words like warm, salad, table, card, etc. The company can use this information to realize and work on various aspects of its menu, offerings, and service.
Conclusion
This article taught us that text mining of review data enables us to understand what people are talking about and how and why they are talking about it. It is crucial and helpful for brand monitoring, product analysis, and customer service. Python and useful libraries like nltk, sklearn, and genism make it simple for us to take advantage of various functions to dive deeper into the text mining and uncover insightful information using techniques like word associations, topic modeling, and sentiment analysis.
The media shown in this article is not owned by Analytics Vidhya and is used at the Author’s discretion.
I am an MBA (Business Analytics) student. Highly enthusiastic about learning Machine learning and its use case across industries. I strongly believe in knowledge sharing and follow the same through my articles on Analytics Vidhya.


Text mining enable me to know the minds of people with respect to their products or services they receive from vendors.
Great insights. Would be very helpful for a beginner who wants to venture into NLP
A very practical approach usung text mining to get business insights .