As a Business Analyst, I have been a predictive modeler for most of my career. Majority of this time was spent on SAS along with tools like CART.
My usage of in memory BI solutions / mashups started with Qlikview about 2 years back. I found it simple to use, which along with its slicing and dicing capabilities helped faster data discovery. I also started using Tableau about a month back and was impressed by its native ability for geo-spatial analysis and simplicity of use (no coding required!).
I have used these tools in broadly 2 ways:
- Deploying dashboards across an Enterprise
- Using mashups to explore data – popularly known as data discovery
Yesterday, Tableau Software announced a new version of their tool (Tableau 8.1). The new release has a bunch of advances over the last version. I have spent some time going over the new features and here are my thoughts about them. Please note that this is my initial impression. I’ll update the article, in case my view changes.
List of new features:
[stextbox id=”section”]1. Improvement in Analytical capabilities:[/stextbox]
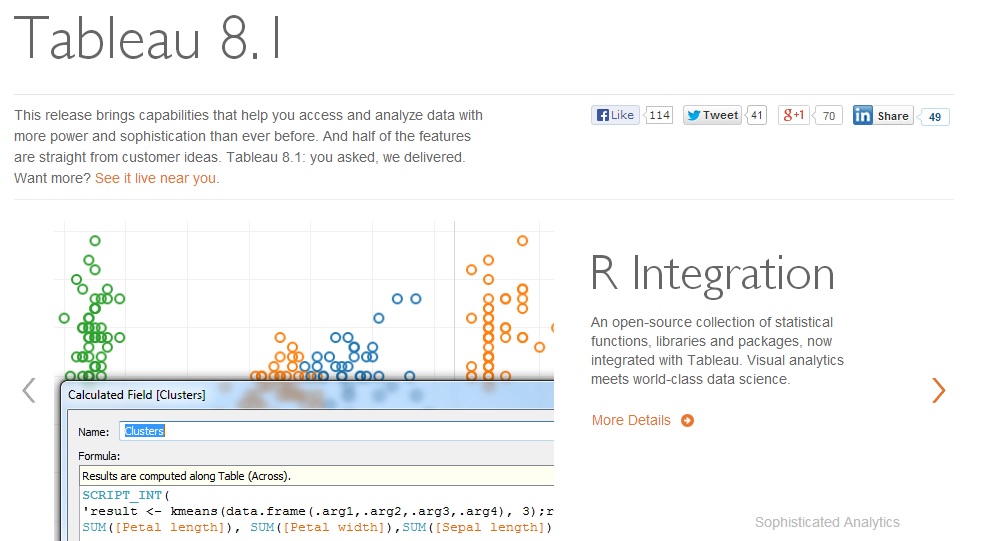
Tableau now integrates with R. This in my mind is one of the big bets for Tableau in this version. As an analyst, I always missed some of the advanced analytical functions in the mashups. For example, features like clustering and correlation matrix can make data exploration lot more meaningful. So, when I heard about this feature, I got really excited. What this means is that now I would be able to run clustering through Tableau with use of SCRIPT_ command. There are still some limitations to this integration:
- It is not possible to export data from Tableau to R outside of SCRIPT functions
- It is also not possible to import data from R to Tableau directly
This looks like a welcome feature which will expand the capabilities of Tableau. This also enables me to now monitor my models in R through a set of dashboards on Tableau.
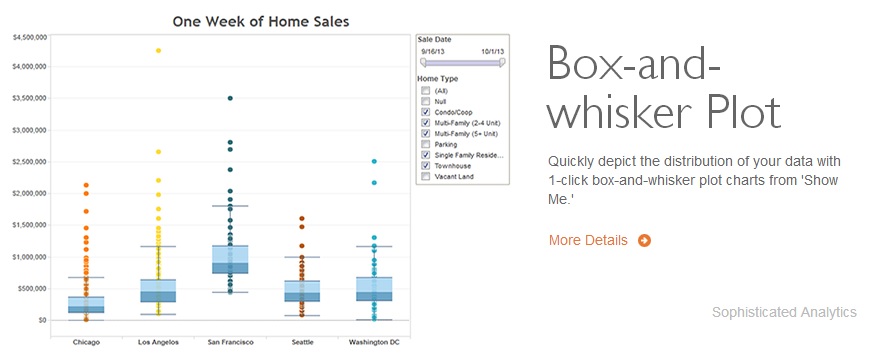
Box and Whisker plots on click of a button. Again, as an analyst, I am used to looking at these plots and these would enable better representations about the distributions. However, they are primarily used by statisticians and analysts. The larger business community would not be able to take out inferences from these charts.
Ranking and (1 click) percentiles. These are some features which are widely used in dashboards. Having them easily accessible will help creation of better dashboards and analysis.
[stextbox id=”section”]2. Better visualization:[/stextbox]
I think Tableau already does a good job at visualization. Hence, I didn’t expect too much improvement. I think most of the improvements in this area are either incremental in nature or are filling gaps about features, which should have been there earlier. The list includes:
- Copy content within workbooks
- Presentation mode
- Dashboard transparency
[stextbox id=”section”]3. Improvements in data integration:[/stextbox]
There are 2 features I would want to call out here:
- Dateparse functions: Convert text strings into datetime
- Google Analytics segments: Advanced segmentation now available in GA connector
I think both the features were expected from perspective of making the tool comprehensive.
[stextbox id=”section”]4. 64 bit support:[/stextbox]
Entire Tableau product suite is now available on 64 bit support. Given the amount of machines using 64 bit architecture, this was expected. Should provide some extra speed on these machines now.
[stextbox id=”section”]5. Web authoring in android app: [/stextbox]
Now you can edit views in your android app, which would enable you to perform better slicing and dicing of data on the go. I think this is a cool feature, given the increased usage of mobile devices to access information.
[stextbox id=”section”]Conclusion:[/stextbox]
Overall, I think Tableau has made enough changes to continue its good run in the industry. Integration with R and web authoring in Android app are the highlight for me in this release. I think Tableau makes an attempt to improve its analytical capabilities, and improves it to some extent, but is still away from a place where it could become the only tool to perform all data exploration (especially for model building).
Would this release force other mashups to integrate seamlessly with advanced analytics engines? What are your views about Tableau 8.1? Were you expecting some additional features as part of this release? Please let me know through comments below.
If you like what you just read & want to continue your analytics learning, subscribe to our emails or like our facebook page.
Kunal Jain is the Founder and CEO of Analytics Vidhya, one of the world's leading communities of Al professionals. With over 17 years of experience in the field, Kunal has been instrumental in shaping the global Al landscape. His expertise spans diverse markets, from developed economies like the UK to emerging ones like India, where he has successfully led and delivered complex data-driven solutions. As a recognized thought leader, Kunal has empowered countless individuals to realize their Al ambitions through his visionary approach to Al education and community building. Before founding Analytics Vidhya, Kunal earned both his undergraduate and postgraduate degrees from IIT Bombay and held key roles at Capital One and Aviva Life Insurance across multiple geographies. His passion lies at the intersection of analytics, Al, and fostering a thriving community of data science professionals.


hi Kunal, Very nice review and thoughts on the new features. As the product makers, Tableau constantly tries to improve the product experience every year. infact in the community space, tableau has taken out a survey to see what the users would like to add to Tableau for better experience and kindly follow the link to see the suggestions: http://www.tableausoftware.com/about/blog/2013/10/few-more-ideas-tableau-81-25402 Thank you for your effort in giving us your two cents :) Warm Regards, Sai Kumar. C (Goldstone)
Great analysis Kunal! ..that too in such a shorter time span..yesterday i read this news of new version and today i saw your post!! great work brother!! thanks
Kunal that was the best way to express your thoughts on Tableau:)