Introduction
People remain confused when it comes to summarizing data real quick in R. There are various options. But, which one is the best ? I’ve answered this question below. You must choose one at first. And, become expert at it. That’s how you should move to the next.
People who transition from SAS or SQL are used to writing simple queries on these languages to summarize data sets. For such audience, the biggest concern is to how do we do the same thing on R.
In this article I will cover primary ways to summarize data sets. Hopefully this will make your journey much easier than it looks like.
Generally, summarizing data means finding statistical figures such as mean, median, box plot etc. If understand well with scatter plots & histogram, you can refer to guide on data visualization in R.
Methods to Summarise Data in R
1. apply
Apply function returns a vector or array or list of values obtained by applying a function to either rows or columns. This is the simplest of all the function which can do this job. However this function is very specific to collapsing either row or column.
m <-matrix(c(1:10, 11:20), nrow = 10, ncol = 2)apply(m, 1, mean)[1] 6 7 8 9 10 11 12 13 14 15
apply(m, 2, mean)[1] 5.5 15.5
2. lapply
“lapply” returns a list of the same length as X, each element of which is the result of applying FUN to the corresponding element of X.”
l <-list(a = 1:10, b = 11:20)lapply(l, mean)$a[1] 5.5
$b[1] 15.5
3. sapply
“sapply” does the same thing as apply but returns a vector or matrix. Let’s consider the last example again.
l <-list(a = 1:10, b = 11:20)l.mean <-sapply(l, mean)class(l.mean)[1]"numeric"
4. tapply
Till now, all the function we discussed cannot do what Sql can achieve. Here is a function which completes the palette for R. Usage is “tapply(X, INDEX, FUN = NULL, …, simplify = TRUE)”, where X is “an atomic object, typically a vector” and INDEX is “a list of factors, each of same length as X”. Here is an example which will make the usage clear.
attach(iris)# mean petal length by speciestapply(iris$Petal.Length, Species, mean)setosa versicolor virginica1.462 4.260 5.552
5. by
Now comes a slightly more complicated algorithm. Function ‘by’ is an object-oriented wrapper for ‘tapply’ applied to data frames. Hopefully the example will make it more clear.
attach(iris)by(iris[, 1:4], Species, colMeans)
Species: setosaSepal.Length Sepal.Width Petal.Length Petal.Width5.006 3.428 1.462 0.246
------------------------------------------------------------ Species: versicolorSepal.Length Sepal.Width Petal.Length Petal.Width5.936 2.770 4.260 1.326
------------------------------------------------------------ Species: virginicaSepal.Length Sepal.Width Petal.Length Petal.Width6.588 2.974 5.552 2.026
What did the function do? It simply splits the data by a class variable, which in this case is the specie. And then it creates a summary at this level. So it does apply function on split frames. The returned object is of class “by”.
6. sqldf
If you found any of the above statements difficult, don’t panic. I bring you a life line which you can use anytime. Let’s fit in the SQL queries in R. Here is a way you can do the same.
attach(iris)summarization <- sqldf(select Species, mean(Petal.Length) from Petal.Length_mean where Species is not null group by Species’)
And it’s done. Wasn’t it simple enough? One setback of this approach is the amount of time it takes to execute. In case you are interested in getting speed and same results read the next section.
7. ddply
Fastest of all we discussed. You will need an additional package. Let’s do what we exactly did in tapply section.
library(plyr)attach(iris)
# mean petal length by speciesddply(iris,"Species",summarise, Petal.Length_mean = mean (Petal.Length))
Additional Notes: You can also use packages such as dplyr, data.table to summarize data. Here’s a complete tutorial on useful packages for data manipulation in R – Faster Data Manipulation with these 7 R Packages.
In general if you are trying to add this summarisation step in the middle of a process and need a table as output, you need to go for sqldf or ddply. “ddply” in these cases is faster but will not give you options beyond just grouping. “sqldf” has all features you need to summarize the data in SQL statements.
In case you are interested in using function similar to pivot tables or transposing the tables, you can consider using “reshape”. We have covered a few examples of the same in our article – comprehensive guide for data exploration in R.
Challenge : Here is a simple problem you can attempt to solve using all the methods we have discussed. You have a table for all school kids marks in a particular city.
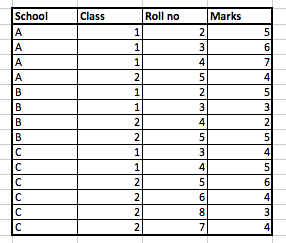
Write a code to find the mean marks of each school for both class 1 and 2, for students with roll no less than 6. And print only the class whose mean score comes out to be higher for the school. For instance, if school A has a mean score of 6 for class 1 and 4 for class 2, you will reject class 2 and only take class 1 mean score for the school. In cases of tie, you can make a random choice. Assume that the actual table is much bigger and keep the code as generalized as possible.
End Notes
You can use any of the functions given above and get your results. I would recommend to execute the same task using all the functions discussed and check the time it takes to execute. Once you have this comparison in your mind, R will be as easy as SAS or and other SQL language.
Did you find the article useful? Have you used any other function to summarize data on R. If yes, tell us about the function and your views on other functions discussed in this blog.
If you like what you just read & want to continue your analytics learning, subscribe to our emails, follow us on twitter or like our facebook page.
Tavish Srivastava, co-founder and Chief Strategy Officer of Analytics Vidhya, is an IIT Madras graduate and a passionate data-science professional with 8+ years of diverse experience in markets including the US, India and Singapore, domains including Digital Acquisitions, Customer Servicing and Customer Management, and industry including Retail Banking, Credit Cards and Insurance. He is fascinated by the idea of artificial intelligence inspired by human intelligence and enjoys every discussion, theory or even movie related to this idea.


Add "data.table" methods as well, more effective ones :)
Thank you, very nice overview ! For anyone interested in more details on the apply-functions, I recommend this rather old (but as far as I can tell still valid) additional blog post: https://nsaunders.wordpress.com/2010/08/20/a-brief-introduction-to-apply-in-r/ One remark from my side: for "real coders" the one-liners from the example are probably more elegant. For daily work with data frames, I prefer in the meantime using not ddply() from the plyr package, but rather using the dplyr-package with its piping. The resulting code is more verbose, but more readable and accessible, like e.g. this pseudo code working on the Titanic dataset: df % group_by(Class, Sex, Age, Survived) %>% summarise(Count = n()) where basically any function can be used in combination with the summarise()-function.
How is this? --- library(dplyr) d <- read.csv('school.csv', stringsAsFactors=F) dd <- d[d$rollno % group_by(school, class) %>% summarise(marks=mean(marks)) sapply(seq(1, nrow(dd)-1, 2), FUN=function(i) { if (dd$marks[i] == dd$marks[i + 1]) { dd[sample(c(i, i+1), 1), ] } else { dd[ifelse(dd$marks[i] > dd$marks[i + 1], i, i+1), ] } }) %>% t
The formatting in the first comment was broken. Please refer to the link below. http://justpaste.it/po5s