Regression is much more than just linear and logistic regression. It includes many techniques for modeling and analyzing several variables. This skill test was designed to test your conceptual and practical knowledge of various regression techniques.
A total of 1845 number of people participated in the test. I am sure they all will agree it was the best skill assessment test on regression they have come across.
If you are one of those who missed out on this skill test, then you did miss out on the real time test. But here the questions with detailed solutions, find out how many you could have answered correctly.

Are you a beginner in Machine Learning? Do you want to master the concepts of Regression and Machine Learning? Here is a beginner-friendly course to assist you in your journey –
Overall Scores
Below are the distribution of scores, this will help you evaluate your performance:
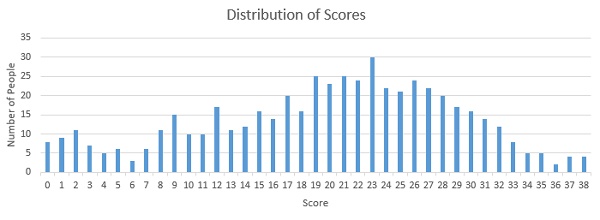
Around 530 people participate in the skilltest and the highest score was 38. Here are a few statistics about the distribution.
Mean Score: 23.15
Median Score: 23
Mode Score: 23
Helpful Resources for Regression
In case you want to revise your knowledge, here are a few resources for brushing up your knowledge on Regression.
Going Deeper into Regression Analysis with Assumptions, Plots & Solutions
5 Questions which can teach you Multiple Regression (with R and Python)
7 Types of Regression Techniques you should know
Simple Guide to Logistic Regression in R
A Complete Tutorial on Ridge and Lasso Regression in Python
Using Platt Scaling and Isotonic Regression to Minimize LogLoss Error in R
Q1. Which of the following step / assumption in regression modeling impacts the trade-off between under-fitting and over-fitting the most.
A. The polynomial degree
B. Whether we learn the weights by matrix inversion or gradient descent
C. The use of a constant-term
Solution: A
Choosing the right degree of polynomial plays a critical role in fit of regression. If we choose higher degree of polynomial, chances of overfit increase significantly.
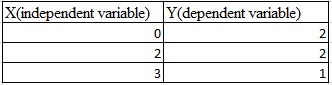
Q2. Suppose you have the following data with one real-value input variable & one real-value output variable. What is leave-one out cross validation mean square error in case of linear regression (Y = bX+c)?
A. 10/27
B. 20/27
C. 50/27
D. 49/27
Solution: D
We need to calculate the residuals for each cross validation point. After fitting the line with 2 points and leaving 1 point for cross validation.
Leave one out cross validation mean square error = (2^2 +(2/3)^2 +1^2) /3 = 49/27
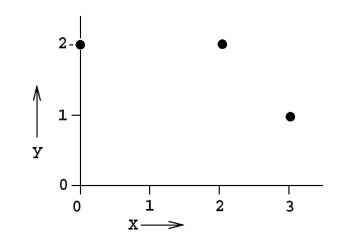
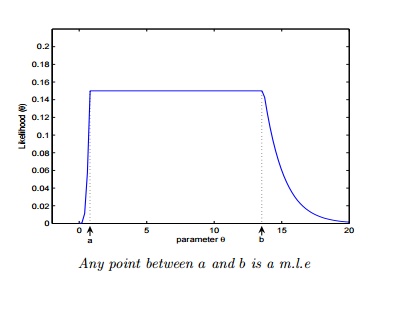
Q3. Which of the following is/ are true about “Maximum Likelihood estimate (MLE)”?
- MLE may not always exist
- MLE always exists
- If MLE exist, it (they) may not be unique
- If MLE exist, it (they) must be unique
A. 1 and 4
B. 2 and 3
C. 1 and 3
D. 2 and 4
Solution: C
The MLE may not be a turning point i.e. may not be a point at which the first derivative of the likelihood (and log-likelihood) function vanishes.
* The MLE may not be unique.
Q4. Let’s say, a “Linear regression” model perfectly fits the training data (train error is zero). Now, Which of the following statement is true?
A. You will always have test error zeroB. You can not have test error zero
C. None of the above
Solution: C
Test error may be zero if there no noise in test data. In other words, it will be zero, if the test data is perfect representative of train data but not always.
Q5. In a linear regression problem, we are using “R-squared” to measure goodness-of-fit. We add a feature in linear regression model and retrain the same model.
Which of the following option is true?
A. If R Squared increases, this variable is significant.
B. If R Squared decreases, this variable is not significant.
C. Individually R squared cannot tell about variable importance. We can’t say anything about it right now.
D. None of these.
Solution: C
“R squared” individually can’t tell whether a variable is significant or not because each time when we add a feature, “R squared” can either increase or stay constant. But, it is not true in case of “Adjusted R squared” (increases when features found to be significant).
Q6. Which one of the statement is true regarding residuals in regression analysis?
A. Mean of residuals is always zero
B. Mean of residuals is always less than zero
C. Mean of residuals is always greater than zero
D. There is no such rule for residuals.
Solution: A
Sum of residual in regression is always zero. It the sum of residuals is zero, the ‘Mean’ will also be zero.
Q7. Which of the one is true about Heteroskedasticity?
A. Linear Regression with varying error terms
B. Linear Regression with constant error terms
C. Linear Regression with zero error terms
D. None of these
Solution: A
The presence of non-constant variance in the error terms results in heteroskedasticity. Generally, non-constant variance arises because of presence of outliers or extreme leverage values.
You can refer this article for more detail about regression analysis.
Q8. Which of the following indicates a fairly strong relationship between X and Y?
A. Correlation coefficient = 0.9
B. The p-value for the null hypothesis Beta coefficient =0 is 0.0001
C. The t-statistic for the null hypothesis Beta coefficient=0 is 30
D. None of these
Solution: A
Correlation between variables is 0.9. It signifies that the relationship between variables is fairly strong.
On the other hand, p-value and t-statistics merely measure how strong is the evidence that there is non zero association. Even a weak effect can be extremely significant given enough data.
Q9. Which of the following assumptions do we make while deriving linear regression parameters?
- The true relationship between dependent y and predictor x is linear
- The model errors are statistically independent
- The errors are normally distributed with a 0 mean and constant standard deviation
- The predictor x is non-stochastic and is measured error-free
A. 1,2 and 3.
B. 1,3 and 4.
C. 1 and 3.
D. All of above.
Solution: D
When deriving regression parameters, we make all the four assumptions mentioned above. If any of the assumptions is violated, the model would be misleading.
Q10. To test linear relationship of y(dependent) and x(independent) continuous variables, which of the following plot best suited?
A. Scatter plot
B. Barchart
C. Histograms
D. None of these
Solution: A
To test the linear relationship between continuous variables Scatter plot is a good option. We can find out how one variable is changing w.r.t. another variable. A scatter plot displays the relationship between two quantitative variables.
Q11. Generally, which of the following method(s) is used for predicting continuous dependent variable?
- Linear Regression
- Logistic Regression
A. 1 and 2
B. only 1
C. only 2
D. None of these.
Solution: B
Logistic Regression is used for classification problems. Regression term is misleading here.
Q12. A correlation between age and health of a person found to be -1.09. On the basis of this you would tell the doctors that:
A. The age is good predictor of health
B. The age is poor predictor of health
C. None of these
Solution: C
Correlation coefficient range is between [-1 ,1]. So -1.09 is not possible.
Q13. Which of the following offsets, do we use in case of least square line fit? Suppose horizontal axis is independent variable and vertical axis is dependent variable.
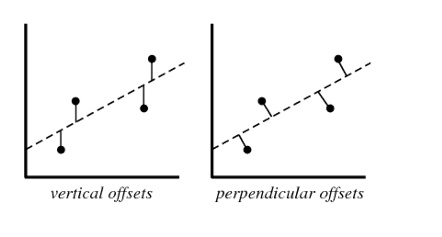
A. Vertical offset
B. Perpendicular offset
C. Both but depend on situation
D. None of above
Solution: A
We always consider residual as vertical offsets. Perpendicular offset are useful in case of PCA.
Q14. Suppose we have generated the data with help of polynomial regression of degree 3 (degree 3 will perfectly fit this data). Now consider below points and choose the option based on these points.
- Simple Linear regression will have high bias and low variance
- Simple Linear regression will have low bias and high variance
- polynomial of degree 3 will have low bias and high variance
- Polynomial of degree 3 will have low bias and Low variance
A. Only 1
B. 1 and 3
C. 1 and 4
D. 2 and 4
Solution: C
If we fit higher degree polynomial greater than 3, it will overfit the data because model will become more complex. If we fit the lower degree polynomial less than 3 which means that we have less complex model so in this case high bias and low variance. But in case of degree 3 polynomial it will have low bias and low variance.
Q15. Suppose you are training a linear regression model. Now consider these points.
- Overfitting is more likely if we have less data
- Overfitting is more likely when the hypothesis space is small
Which of the above statement(s) are correct?
A. Both are False
B. 1 is False and 2 is True
C. 1 is True and 2 is False
D. Both are True
Solution: C
1.With small training dataset, it’s easier to find a hypothesis to fit the training data exactly i.e. overfitting.
2. We can see this from the bias-variance trade-off. When hypothesis space is small, it has higher bias and lower variance. So with a small hypothesis space, it’s less likely to find a hypothesis to fit the data exactly i.e. underfitting.
Q16. Suppose we fit “Lasso Regression” to a data set, which has 100 features (X1,X2…X100). Now, we rescale one of these feature by multiplying with 10 (say that feature is X1), and then refit Lasso regression with the same regularization parameter.
Now, which of the following option will be correct?
A. It is more likely for X1 to be excluded from the modelB. It is more likely for X1 to be included in the model
C. Can’t say
D. None of these
Solution: B
Big feature values =⇒ smaller coefficients =⇒ less lasso penalty =⇒ more likely to have be kept
Q17. Which of the following is true about “Ridge” or “Lasso” regression methods in case of feature selection?
A. Ridge regression uses subset selection of features
B. Lasso regression uses subset selection of features
C. Both use subset selection of features
D. None of above
Solution: B
“Ridge regression” will use all predictors in final model whereas “Lasso regression” can be used for feature selection because coefficient values can be zero. For more detail click here.
Q18. Which of the following statement(s) can be true post adding a variable in a linear regression model?
- R-Squared and Adjusted R-squared both increase
- R-Squared increases and Adjusted R-squared decreases
- R-Squared decreases and Adjusted R-squared decreases
- R-Squared decreases and Adjusted R-squared increases
A. 1 and 2
B. 1 and 3
C. 2 and 4
D. None of the above
Solution: A
Each time when you add a feature, R squared always either increase or stays constant, but it is not true in case of Adjusted R squared. If it increases, the feature would be significant.
Q19. The following visualization shows the fit of three different models (in blue line) on same training data. What can you conclude from these visualizations?
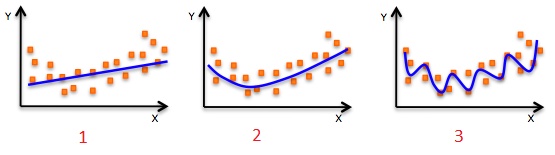
- The training error in first model is higher when compared to second and third model.
- The best model for this regression problem is the last (third) model, because it has minimum training error.
- The second model is more robust than first and third because it will perform better on unseen data.
- The third model is overfitting data as compared to first and second model.
- All models will perform same because we have not seen the test data.
A. 1 and 3
B. 1 and 3
C. 1, 3 and 4
D. Only 5
Solution: C
The trend of the data looks like a quadratic trend over independent variable X. A higher degree (Right graph) polynomial might have a very high accuracy on the train population but is expected to fail badly on test dataset. But if you see in left graph we will have training error maximum because it under-fits the training data.
Q20. Which of the following metrics can be used for evaluating regression models?
- R Squared
- Adjusted R Squared
- F Statistics
- RMSE / MSE / MAE
A. 2 and 4.
B. 1 and 2.
C. 2, 3 and 4.
D. All of the above.
Solution: D
These (R Squared, Adjusted R Squared, F Statistics , RMSE / MSE / MAE ) are some metrics which you can use to evaluate your regression model.
Q21. We can also compute the coefficient of linear regression with the help of an analytical method called “Normal Equation”. Which of the following is/are true about “Normal Equation”?
- We don’t have to choose the learning rate
- It becomes slow when number of features is very large
- No need to iterate
A. 1 and 2
B. 1 and 3.
C. 2 and 3.
D. 1,2 and 3.
Solution: D
Instead of gradient descent, Normal Equation can also be used to find coefficients. Refer this article for read more about normal equation.
Q22. The expected value of Y is a linear function of the X(X1,X2….Xn) variables and regression line is defined as:
Y = β0 + β1 X1 + β2 X2……+ βn Xn
Which of the following statement(s) are true?
- If Xi changes by an amount ∆Xi, holding other variables constant, then the expected value of Y changes by a proportional amount βi ∆Xi, for some constant βi (which in general could be a positive or negative number).
- The value of βi is always the same, regardless of values of the other X’s.
- The total effect of the X’s on the expected value of Y is the sum of their separate effects.
Note: Features are independent of each others(zero interaction).
A. 1 and 2
B. 1 and 3
C. 2 and 3
D. 1,2 and 3
Solution: D
- The expected value of Y is a linear function of the X variables. This means:
- If X i changes by an amount ∆X i , holding other variables fixed, then the expected value of Y changes by a proportional amount β i ∆X i , for some constant β i (which in general could be a positive or negative number).
- The value of β i is always the same, regardless of values of the other X’s.
- The total effect of the X’s on the expected value of Y is the sum of their separate effects.
- The unexplained variations of Y are independent random variables (in particular, not “auto correlated” if the variables are time series)
- They all have the same variance (“homoscedasticity”).
- They are normally distributed.
Q23. How many coefficients do you need to estimate in a simple linear regression model (One independent variable)?
A. 1
B. 2
C. Can’t Say
Solution: B
In simple linear regression, there is one independent variable so 2 coefficients (Y=a+bx).
Q24. Below graphs show two fitted regression lines (A & B) on randomly generated data. Now, I want to find the sum of residuals in both cases A and B.
Note:
- Scale is same in both graphs for both axis.
- X axis is independent variable and Y-axis is dependent variable.
Which of the following statement is true about sum of residuals of A and B?
A) A has higher than B
B) A has lower than B
C) Both have same
D) None of these
Solution: C
Sum of residuals always zero.
Q25. If two variables are correlated, is it necessary that they have a linear relationship?
A. Yes
B. No
Solution: B
It is not necessary. They could have non linear relationship
Q26. Correlated variables can have zero correlation coeffficient. True or False?
A. True
B. False
Solution: A
Q27. Suppose I applied a logistic regression model on data and got training accuracy X and testing accuracy Y. Now I want to add few new features in data. Select option(s) which are correct in such case.
Note: Consider remaining parameters are same.
- Training accuracy always decreases.
- Training accuracy always increases or remain same.
- Testing accuracy always decreases
- Testing accuracy always increases or remain same
A. Only 2
B. Only 1
C. Only 3
D. Only 4
Solution: A
Adding more features to model will always increase the training accuracy i.e. low bias. But testing accuracy increases if feature is found to be significant.
Q28. The graph below represents a regression line predicting Y from X. The values on the graph shows the residuals for each predictions value. Use this information to compute the SSE.
A. 3.02
B. 0.75
C. 1.01
D. None of these
Solution: A
SSE is the sum of the squared errors of prediction, so SSE = (-.2)^2 + (.4)^2 + (-.8)^2 + (1.3)^2 + (-.7)^2 = 3.02
Q29. Height and weight are well known to be positively correlated. Ignoring the plot scales (the variables have been standardized), which of the two scatter plots (plot1, plot2) is more likely to be a plot showing the values of height (Var1 – X axis) and weight (Var2 – Y axis).
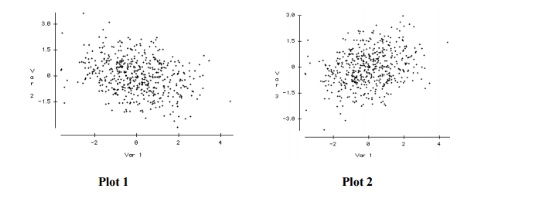
A. Plot2
B. Plot1
C. Both
D. Can’t say
Solution: A
Plot 2 is definitely a better representation of the association between height and weight. As individuals get taller, they take up more volume, which leads to an increase in height, so a positive relationship is expected. The plot on the right has this positive relationship while the plot on the left shows a negative relationship.
Q30. Suppose the distribution of salaries in a company X has median $35,000, and 25th and 75th percentiles are $21,000 and $53,000 respectively.
Would a person with Salary $1 be considered an Outlier?
A. Yes
B. No
C. More information is required
D. None of these.
Solution: C
Q31. Which of the following option is true regarding “Regression” and “Correlation” ?
Note: y is dependent variable and x is independent variable.
A. The relationship is symmetric between x and y in both.
B. The relationship is not symmetric between x and y in both.
C. The relationship is not symmetric between x and y in case of correlation but in case of regression it is symmetric.
D. The relationship is symmetric between x and y in case of correlation but in case of regression it is not symmetric.
Solution: D
- Correlation is a statistic metric that measures the linear association between two variables. It treats y and x symmetrically.
- Regression is setup to predict y from x. The relationship is not symmetric.
Q32. Can we calculate the skewness of variables based on mean and median?
A. True
B. False
Solution: B
The skewness is not directly related to the relationship between the mean and median.
Q33. Suppose you have n datasets with two continuous variables (y is dependent variable and x is independent variable). We have calculated summary statistics on these datasets. All of them give the following result:
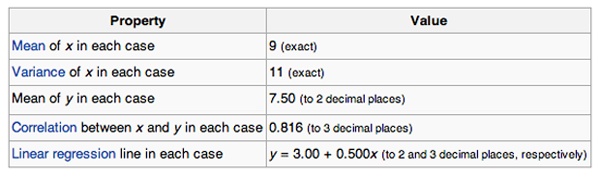
Are all the given datasets same?
A. Yes
B. No
C. Can’t Say
Solutiom: C
To answer this question, you should know about Anscombe’s quartet. Refer this link to read more about this.
Q34. How does number of observations influence overfitting? Choose the correct answer(s).
Note: Rest all parameters are same
- In case of fewer observations, it is easy to overfit the data.
- In case of fewer observations, it is hard to overfit the data.
- In case of more observations, it is easy to overfit the data.
- In case of more observations, it is hard to overfit the data.
A. 1 and 4
B. 2 and 3
C. 1 and 3
D. None of theses
Solution: A
In particular, if we have very few observations and it’s small, then our models can rapidly overfits data. Because we have only a few points and as we’re increasing in our model complexity like the order of the polynomial, it becomes very easy to hit all of our observations.
On the other hand, if we have lots and lots of observations, even with really, really complex models, it is difficult to overfit because we have dense observations across our input.
Q35. Suppose you have fitted a complex regression model on a dataset. Now, you are using Ridge regression with tuning parameter lambda to reduce its complexity. Choose the option(s) below which describes relationship of bias and variance with lambda.
A. In case of very large lambda; bias is low, variance is low
B. In case of very large lambda; bias is low, variance is high
C. In case of very large lambda; bias is high, variance is low
D. In case of very large lambda; bias is high, variance is high
Solution: C
If lambda is very large it means model is less complex. So in this case bias is high and variance in low.
Q36. Suppose you have fitted a complex regression model on a dataset. Now, you are using Ridge regression with tuning parameter lambda to reduce its complexity. Choose the option(s) below which describes relationship of bias and variance with lambda.
A. In case of very small lambda; bias is low, variance is low
B. In case of very small lambda; bias is low, variance is high
C. In case of very small lambda; bias is high, variance is low
D. In case of very small lambda; bias is high, variance is high
Solution: B
If lambda is very small it means model is complex. So in this case bias is low and variance is high because model will overfit the data.
Q37. What is/are true about ridge regression?
- When lambda is 0, model works like linear regression model
- When lambda is 0, model doesn’t work like linear regression model
- If lambda goes to infinity, we get very, very small coefficients approaching 0
- If lambda goes to infinity, we get very, very large coefficients approaching infinity
A. 1 and 3
B. 1 and 4
C. 2 and 3
D. 2 and 4
Solution: A
Specifically, we can see that when lambda is 0, we get our least square solution. When lambda goes to infinity, we get very, very small coefficients approaching 0.
Q38. Out of the three residual plots given below, which of the following represent worse model(s) compared to others?
Note:
- All residuals are standardized.
- The plots are between predicted values Vs. residuals

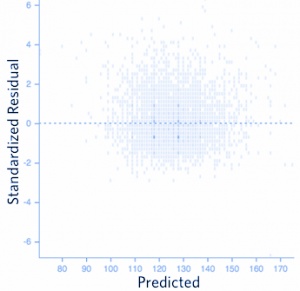
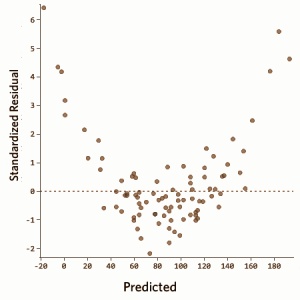
A. 1
B. 2
C. 3
D. 1 and 2
Solution: C
There should not be any relationship between predicted values and residuals. If there exist any relationship between them means model has not perfectly capture the information in data.
Q39. Which of the following method(s) does not have closed form solution for its coefficients?
A. Ridge regressionB. Lasso
C. Both Ridge and Lasso
D. None of both
Solution: B
The Lasso does not admit a closed-form solution. The L1-penalty makes the solution non-linear. So we need to approximate the solution.
If you want to read more about closed form solutions, refer this link.
Q40. Consider the following dataset
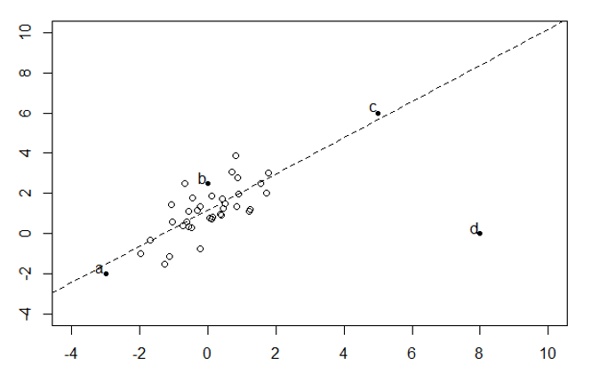
Which bold point, if removed will have the largest effect on fitted regression line as shown in above figure(dashed)?
A) a
B) b
C) c
D) d
Solution: D
Linear regression is sensitive to outliers in the data. Although c is also an outlier in given data space but it is closed to the regression line(residual is less) so it will not affect much.
Q41. In a simple linear regression model (One independent variable), If we change the input variable by 1 unit. How much output variable will change?
A: By 1
B. No change
C. By intercept
D. By its Slope
Solution: D
Equation for simple linear regression: Y=a+bx. Now if we increase the value of x by 1 then the value of y would be a+b(x+1) i.e. value of y will get incremented by b.
Q42. Logistic Regression transforms the output probability to be in a range of [0, 1]. Which of the following function is used by logistic regression to convert the probability in the range between [0,1].
A. Sigmoid
B. Mode
C. Square
D. Probit
Solution: A
Sigmoid function is used to convert output probability between [0,1] in logistic regression.
Q43: Which of the following statement is true about partial derivative of the cost functions w.r.t weights / coefficients in linear-regression and logistic-regression?
A. Both will be different
B. Both will be same
C. Can’t say
D. None of these
Solution: B
Q44. Suppose, we are using Logistic regression model for n-class classification problem. In this case, we can use One-vs-rest method. Choose which of the following option is true regarding this?
A. We need to fit n model in n-class classification problem.
B. We need to fit n-1 models to classify into n classes.
C. We need to fit only 1 model to classify into n classes.
D. None of these.
Solution: A
If there are n classes, then n separate logistic regression has to fit, where the probability of each category is predicted over the rest of the categories combined.
Take a example of 3-class(-1,0,1) classification. Then need to train 3 logistic regression classifiers.
- -1 vs 0 and 1
- 0 vs -1 and 1
- 1 vs 0 and -1
Q45. Below are two different logistic models with different values for β0 and β1.
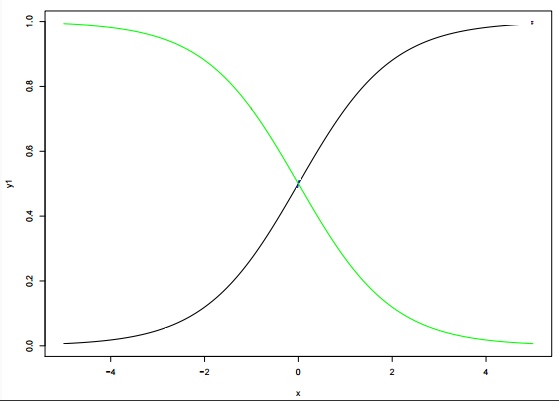
Which of the following statement(s) is true about β0 and β1 values of two logistics models (Green, Black)?
Note: consider Y = β0 + β1*X. Here, β0 is intercept and β1 is coefficient.
A. β1 for Green is greater than Black
B. β1 for Green is lower than Black
C. β1 for both models is same
D. Can’t Say.
Solution: B
β0 and β1: β0 = 0, β1 = 1 is in X1 color(black) and β0 = 0, β1 = −1 is in X4 color (green)
Conclusion
I hope you enjoyed taking the test and you found the solutions helpful. The test focused on conceptual knowledge of regression and its various techniques.
We tried to clear all your doubts through this article but if we have missed out on something then let me know in comments below. If you have any suggestions or improvements you think we should make in the next skilltest, let us know by dropping your feedback in the comments section.
You can test your skills and knowledge. Check out Live Competitions and compete with best Data Scientists from all over the world.
Ankit is currently working as a data scientist at UBS who has solved complex data mining problems in many domains. He is eager to learn more about data science and machine learning algorithms.


Can you explain Q26 please.
Hi Rishabh, Thank you for asking the question. Think about Pearson correlation between two continuous variables. Pearson correlation will measure only linear relationships between variables. Refer this link to get more sense of it. https://www.analyticsvidhya.com/blog/2015/06/correlation-common-questions/ Hope above answer will help you to understand the concepts. Best! Ankit Gupta
What is difference between continuous variable and Discrete( Categorical) variable? How Logistic Regression used for predicting continuous variable? (Que 11)
Hi Krishna, If a variable can take any value between its minimum and maximum value, then it is called a continuous variable. By nature, a lot of things we deal with fall in this category: age, weight, height being some of them. But in case of categorical variable it can take only few values. For example, a gender can be male or female. Coming to the point. How can you use logistic regression for continuous variable prediction? Convert the continuous variables into bin(say 10). By creating the bin of this variable; you actually created some categories. So now you can use logistic regression. Hope this answer will help you to understand. Best! Ankit Gupta
For Q18, Isn't Adjusted R Square also supposed to increase or remain constant (though fairly more robust than R Square)? Haven't come across Adjusted R Square decrease on adding a new variable. Please explain the theory behind it.
Hi Kenneth, Thank you for reaching out. Please read this discussion which will give answer to your question. Link = https://discuss.analyticsvidhya.com/t/difference-between-r-square-and-adjusted-r-square/264/2 Best! Ankit Gupta