Everything you Should Know about p-value from Scratch for Data Science
Overview
- What is p-value? Where is it used in data science? And how can we calculate it?
- We answer all these questions and more in this article on learning p-value from scratch
- This article looks at p-value from the statistics as well as the data science perspective
Introduction
Does the below scenario look familiar when you talk about p-value to aspiring data scientists?

I cannot tell you the number of times data scientists, even established ones, flounder when it comes to explaining how to interpret a p-value. In fact, take a moment to answer these questions:
- How do you interpret a p-value?
- How much importance should we place in the p-value?
- How will you explain the significance of p-value to a non-data science person (a stakeholder for example)?
These are crucial questions that every data science professional should be able to answer. And in my experience, most struggle to get past the first question. We cannot expect to convince our clients about the result of a machine learning model if we can’t break it down for them, right?
The Wikipedia definition of p-value is daunting to anyone who is new to the world of statistics and data science. This is how a typical conversation about p-value goes:
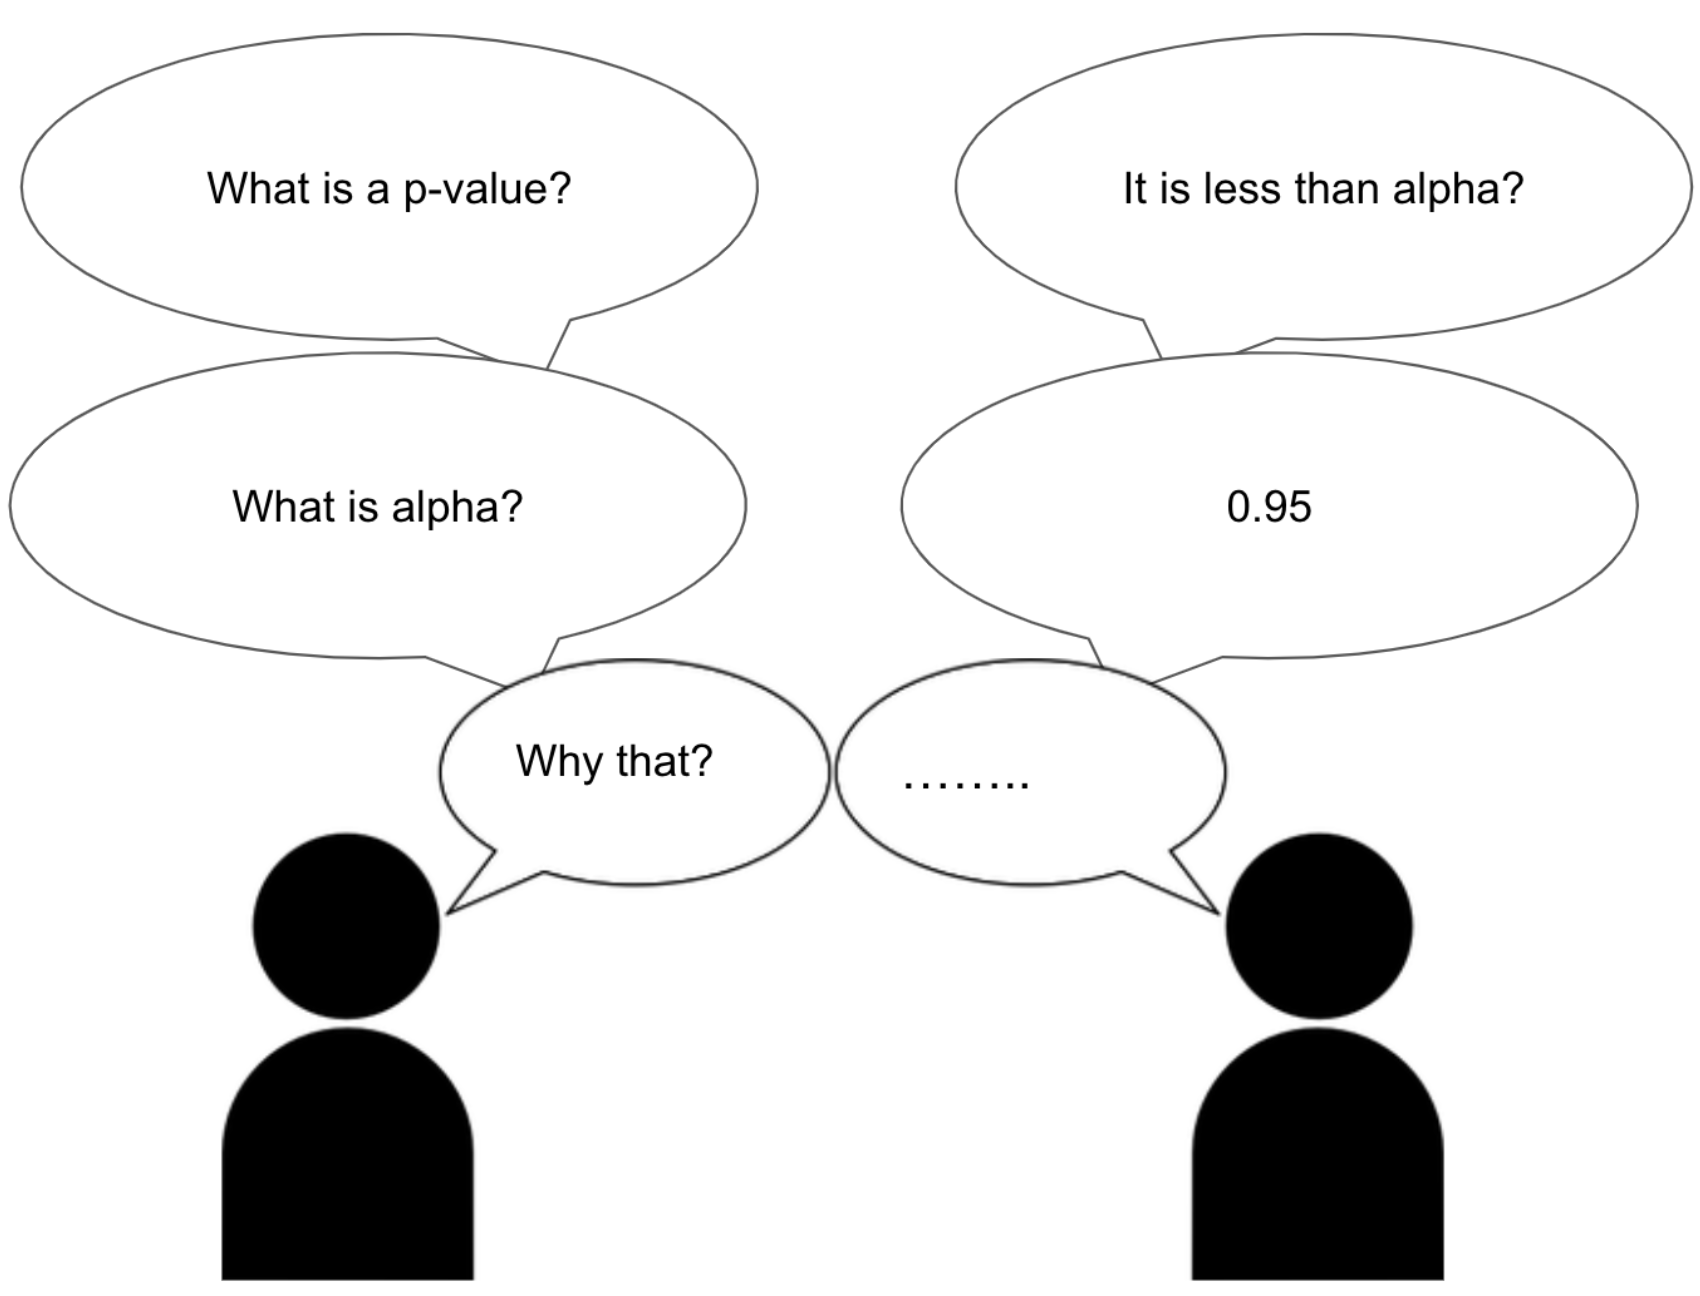
And you are left hanging with formulae and conventions about what to do but no clue on how to interpret the p-value. So how do we learn p-value once and for all and indelibly ingrain it in our mind?
How we will Understand p-value from Scratch
In this article, we will start building the intuition for the p-value step-by-step from scratch and will also debunk the traditional (mis)interpretations of the p-value. This is what we will cover:
- What is p-value?
- Statistical Significance
- Example of p-value in Statistics
- Example of p-value in Data Science
- Some traditional (mis)interpretations of the p-value
So, let’s dive right into it.
What is p-value?
Let’s start with the absolute basics. What is p-value? To understand this question, we will pick up the normal distribution:
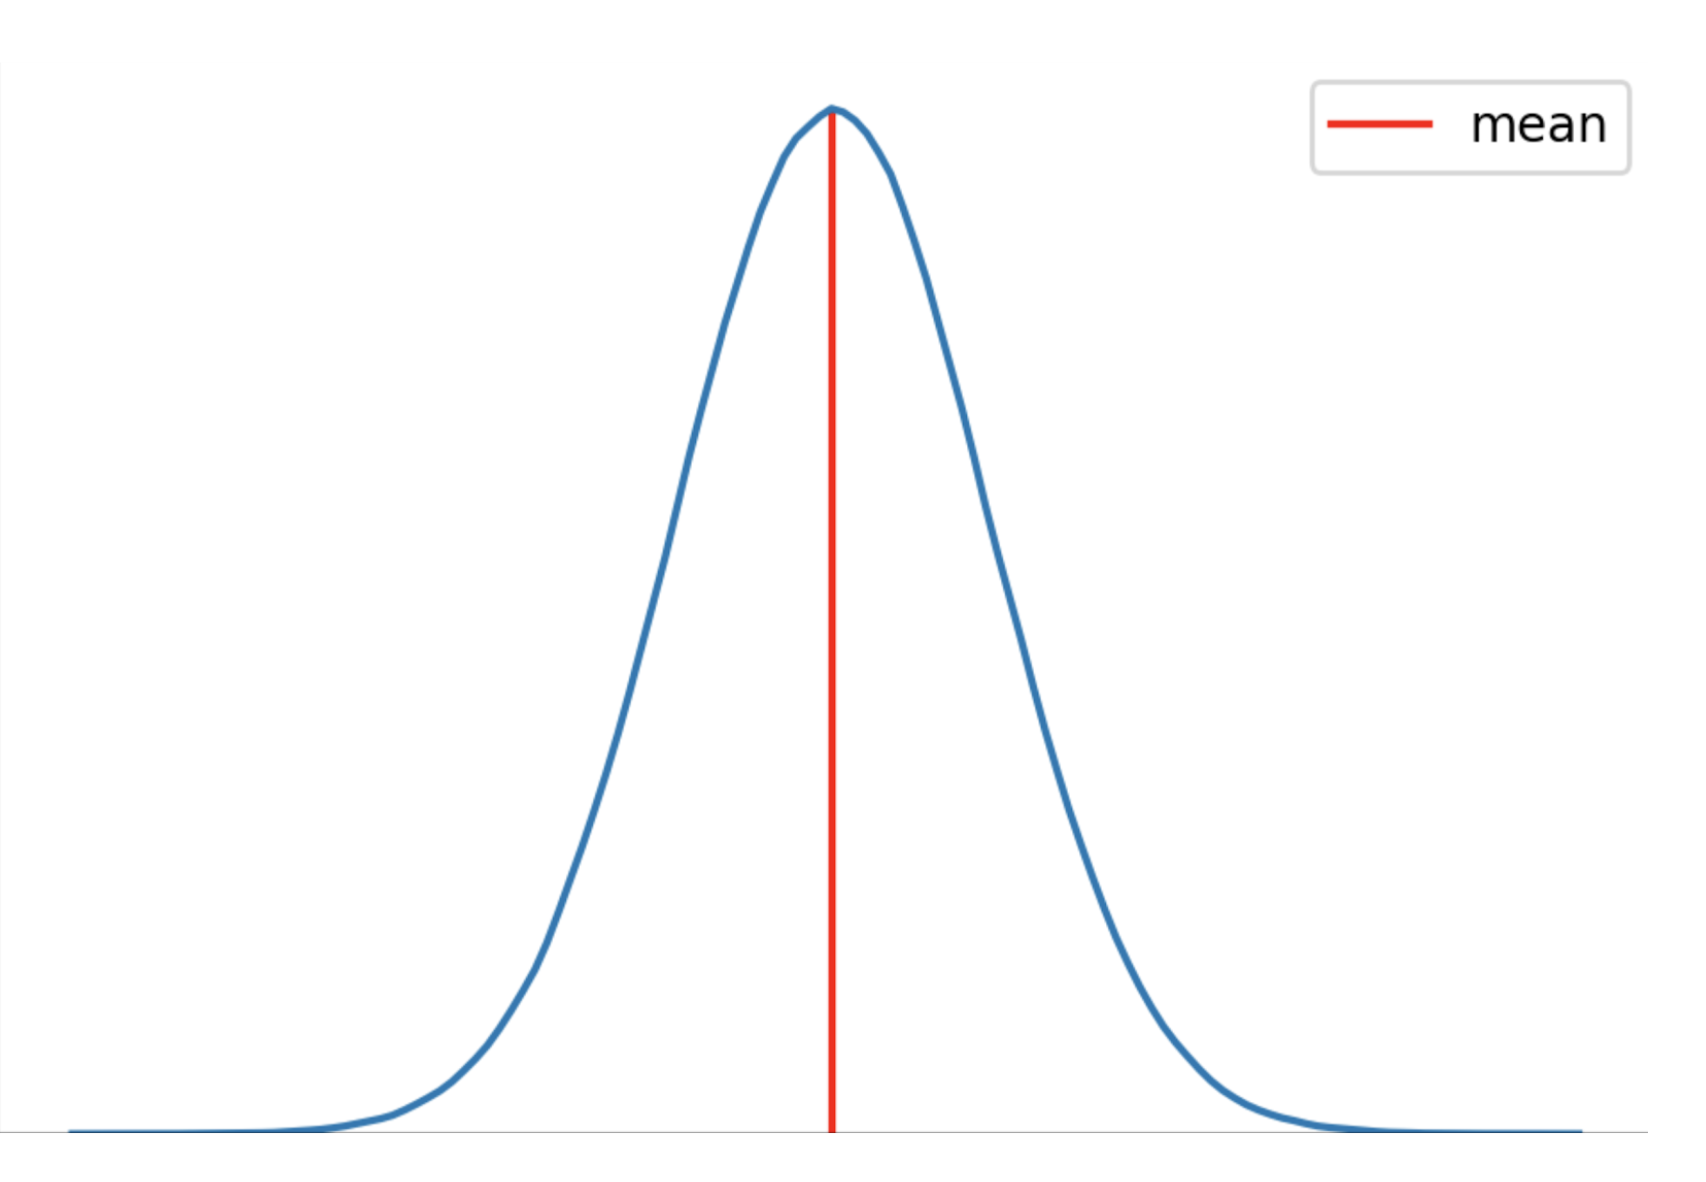
We have the range of values on the x-axis and the frequency of occurrences of different values on the y-axis. If you need a quick refresher on the concept of normal distributions, check out this article.
Now, let’s say we pick any random value from this distribution. The probability that we will pick values close to the mean is highest as it has the highest peak (due to high occurrence values in that region). We can clearly see that if we move away from the peak, the occurrence of the values decreases rapidly and so does the corresponding probability, towards a very small value close to zero.
But this article is about p-values – so why are we looking at a normal distribution? Well, with respect to the normal distribution we discussed above, consider the way we define the p-value.
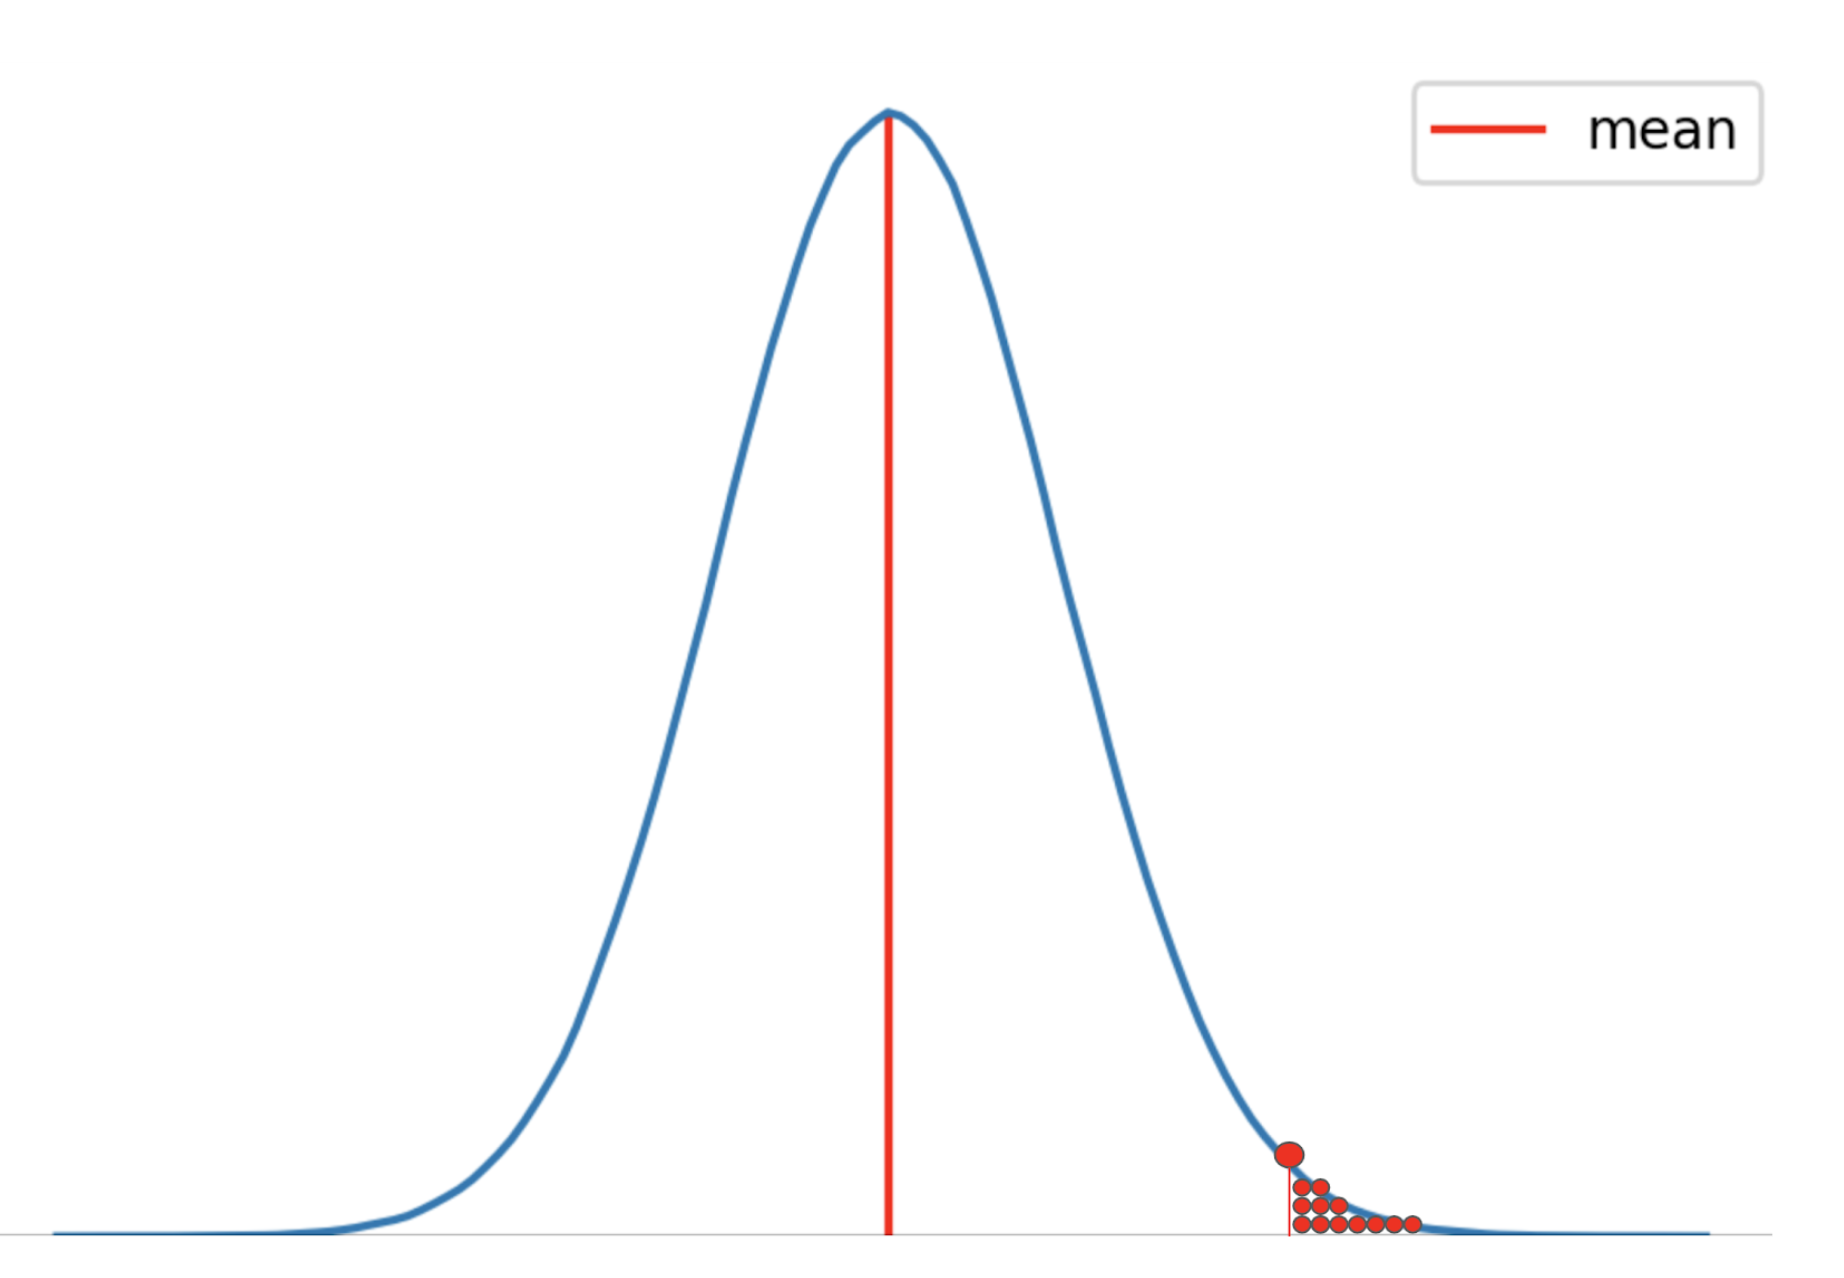
p-value is the cumulative probability (area under the curve) of the values to the right of the red point in the figure above.
Or,
p-value corresponding to the red point tells us about the ‘total probability’ of getting any value to the right hand side of the red point, when the values are picked randomly from the population distribution.
Now, this might look like a very naive definition, but we will build on it as we go along.
P-value does not hold any value by itself. A large p-value implies that sample scores are more aligned or similar to the population score. It is as simple as that.
Now, you might have come across the thumb rule of comparing the p-value with the alpha value to draw conclusions. So let’s look into the alpha value.
Statistical Significance of the p-value: Enter – Alpha value

I’ve mentioned the alpha value, also known as the significance level, a few times so far. This is a value that we know to be 0.05 or 5% for some unknown reason.
We are also taught in statistics classes the convention that p-value being less than alpha means that the results obtained are statistically significant. But what in the world is the alpha value?
So, let’s spend a moment to look at what the alpha value signifies.
Alpha value is nothing but a threshold p-value, which the group conducting the test/experiment decides upon before conducting a test of similarity or significance ( Z-test or a T-test).
This means that if the likeliness of getting the sample score is less than alpha or the threshold p-value, we consider it significantly different from the population, or even belonging to some new sample distribution.
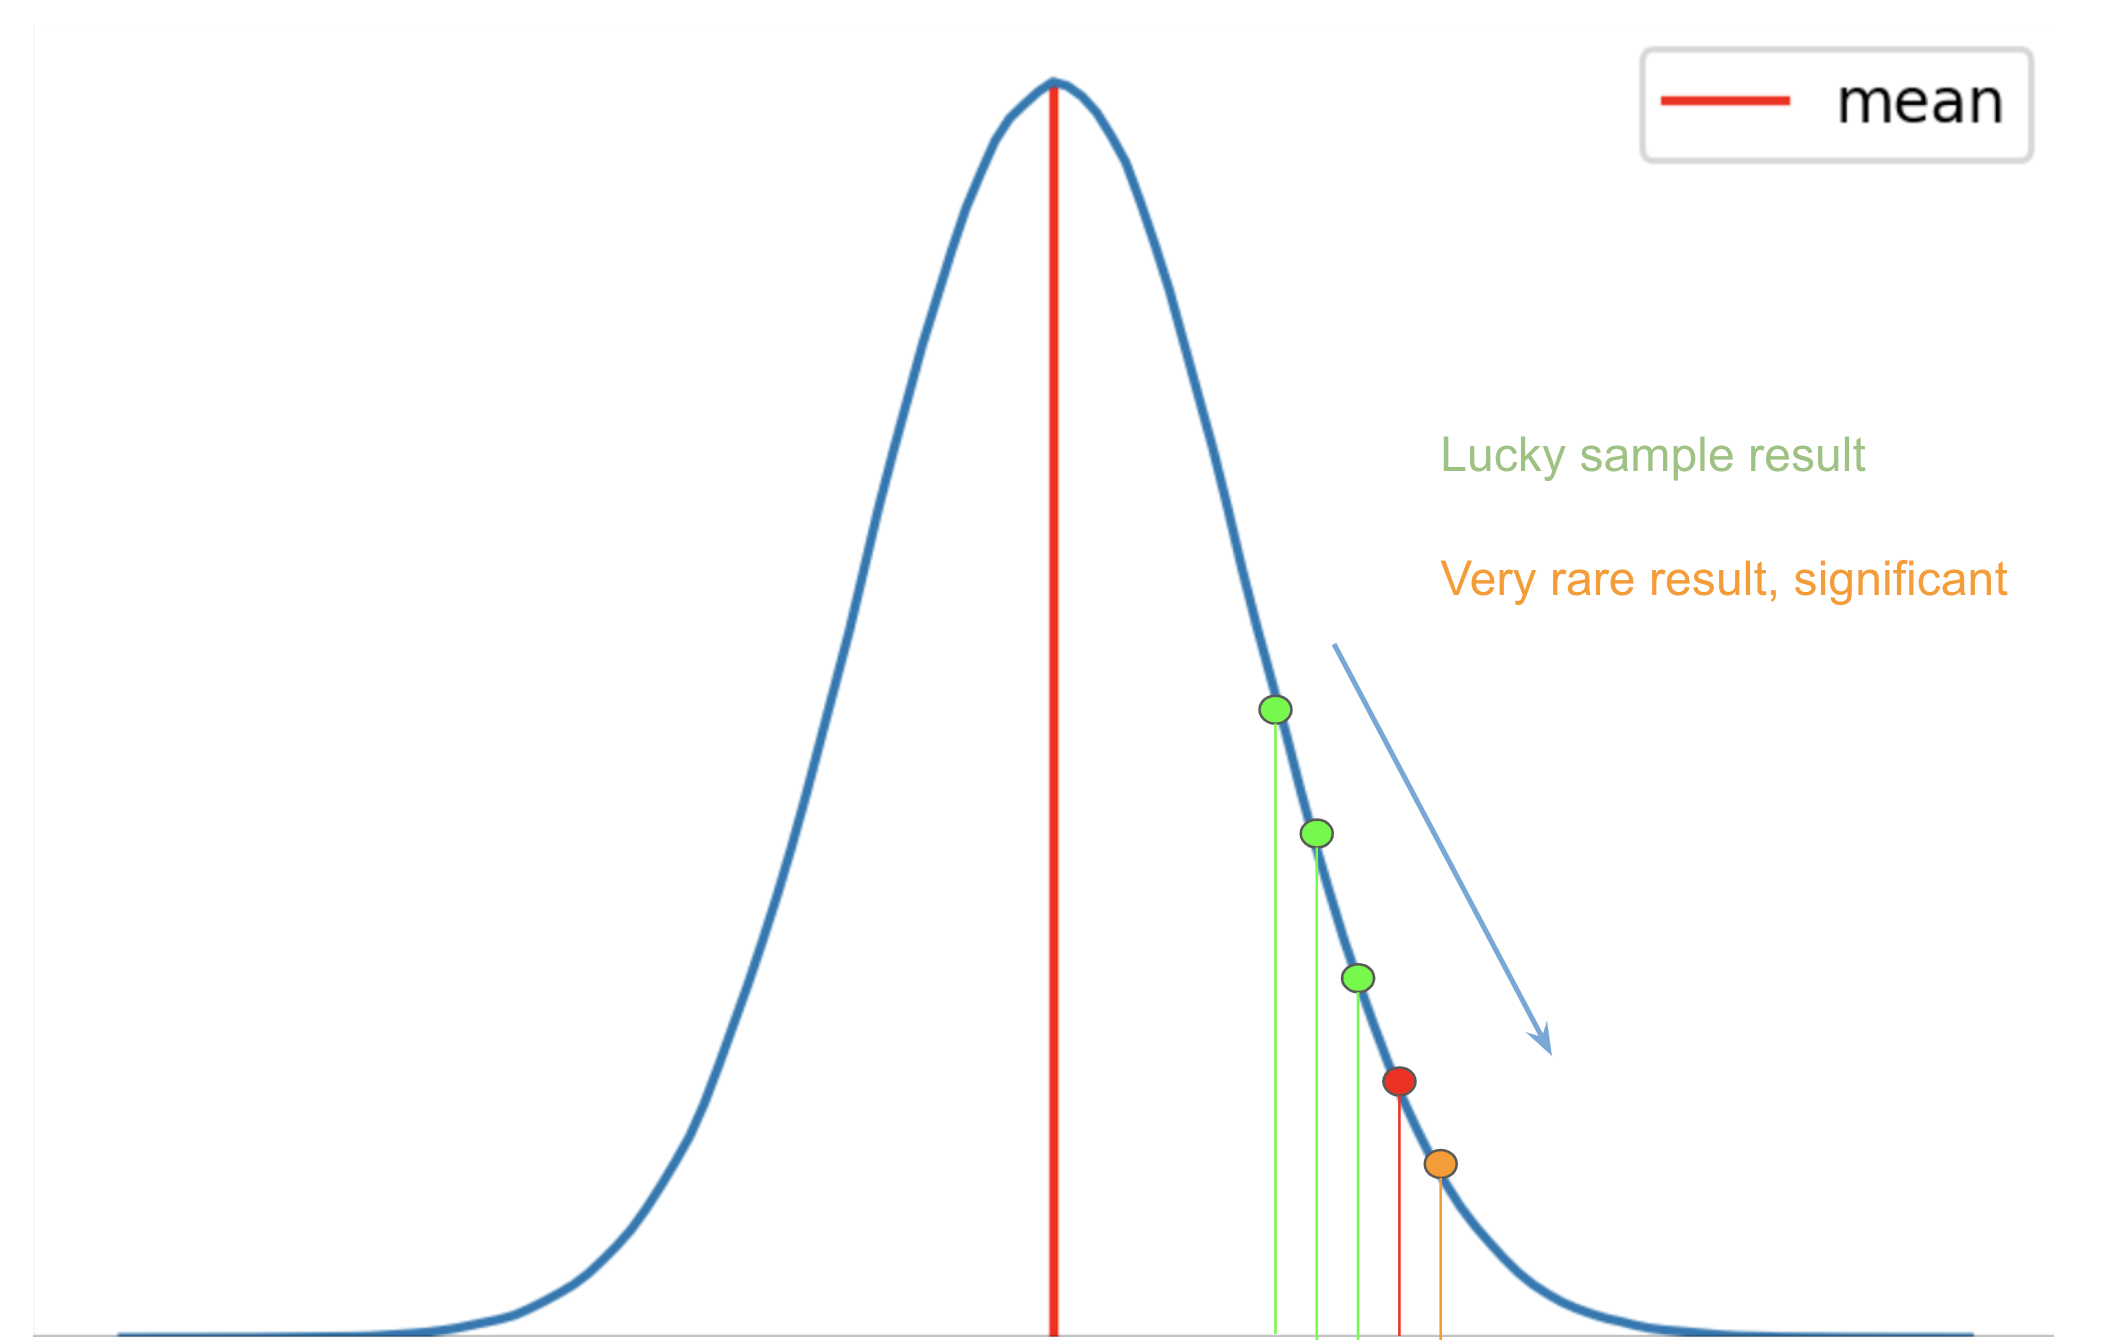
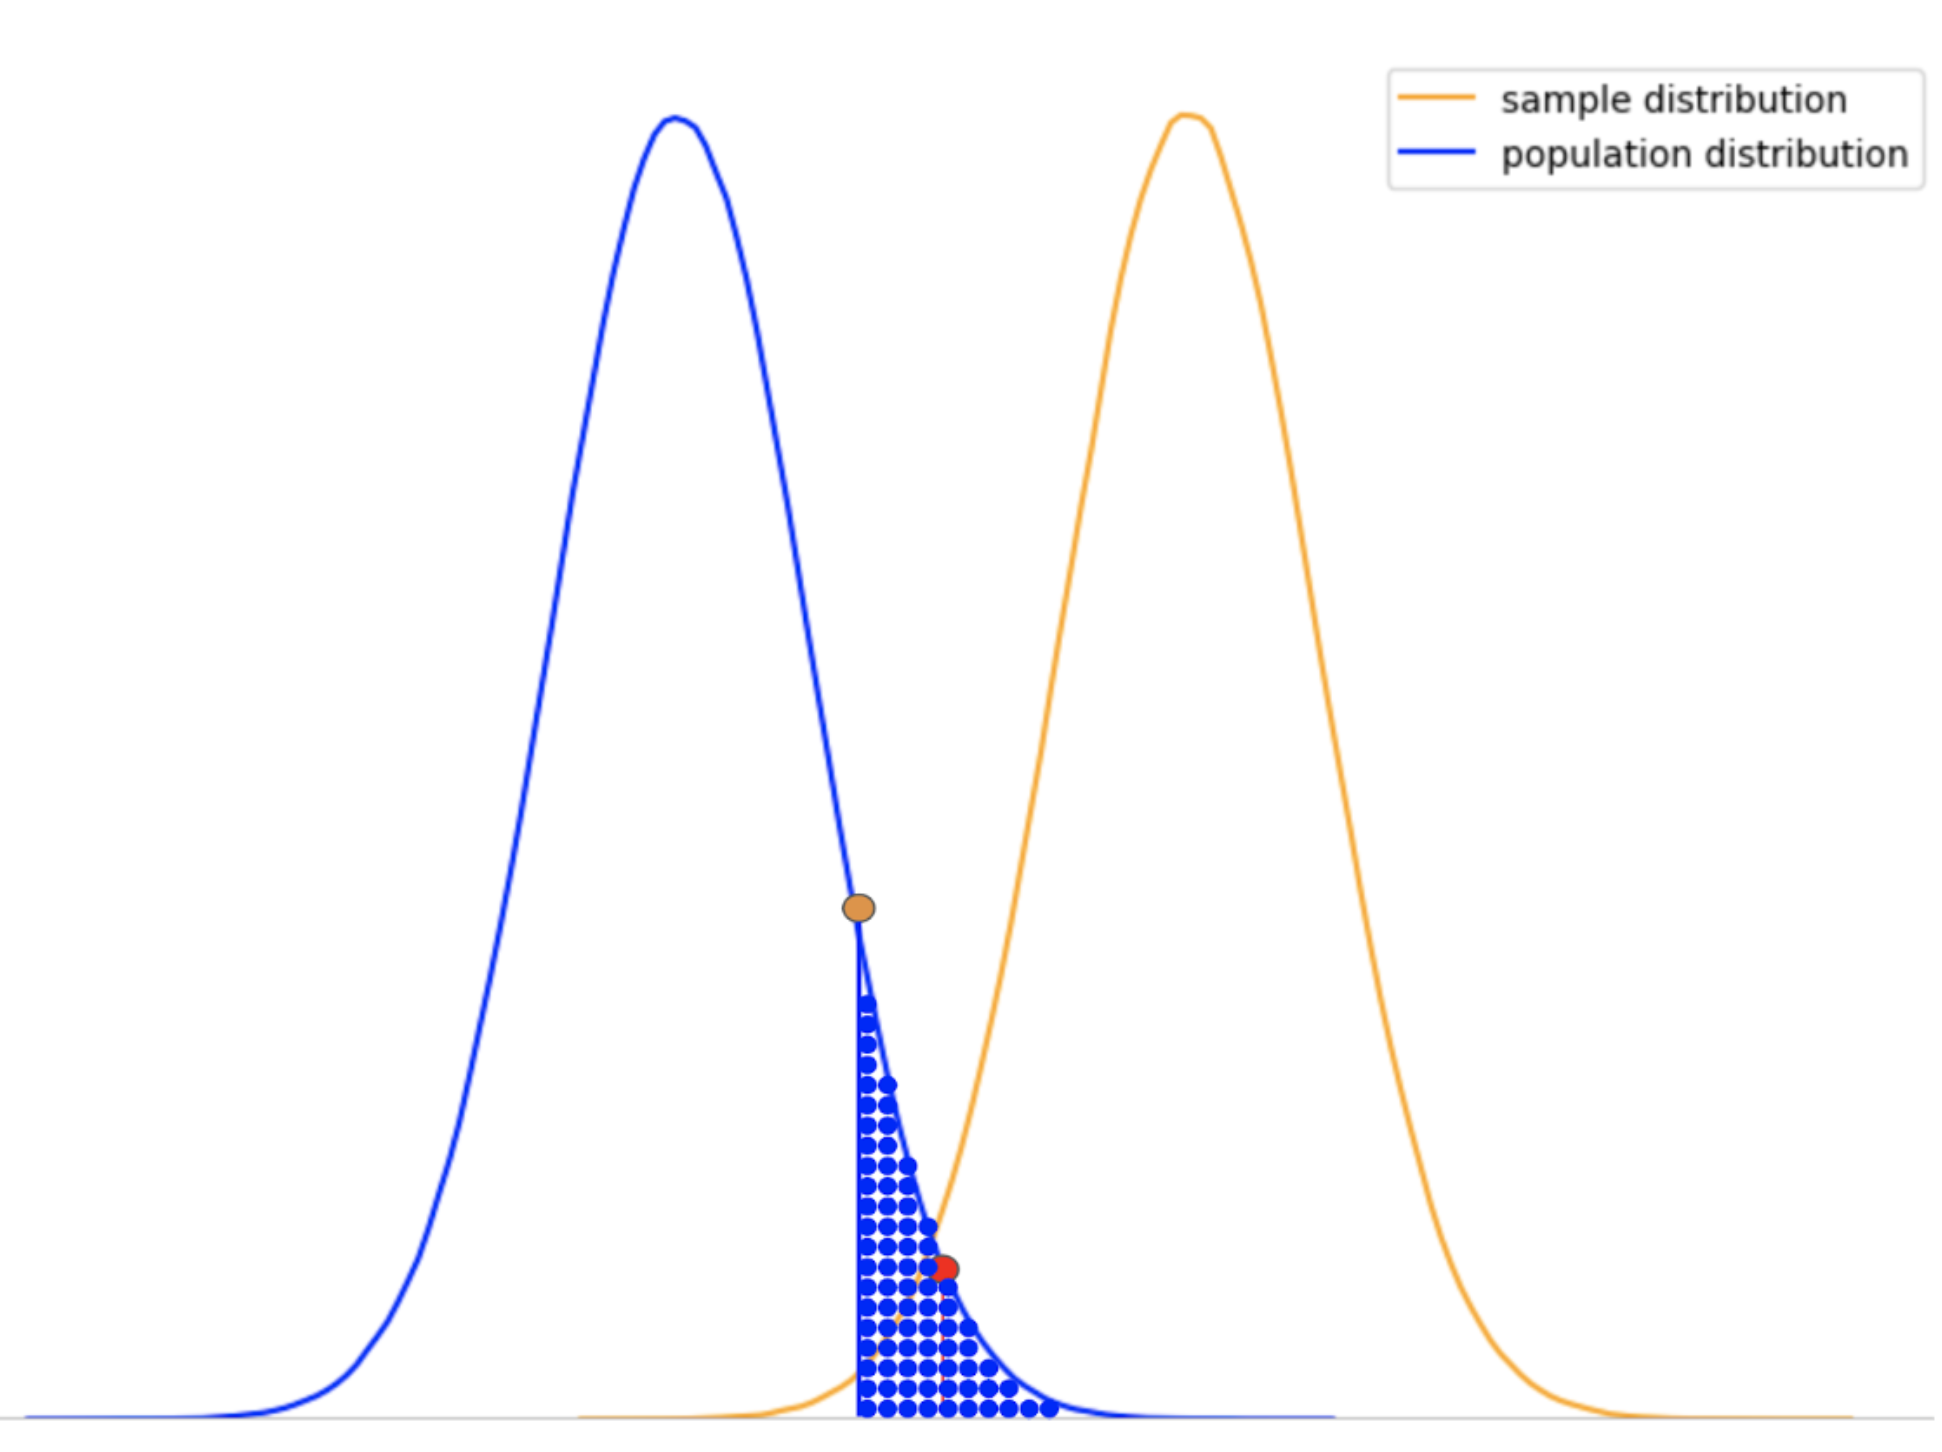
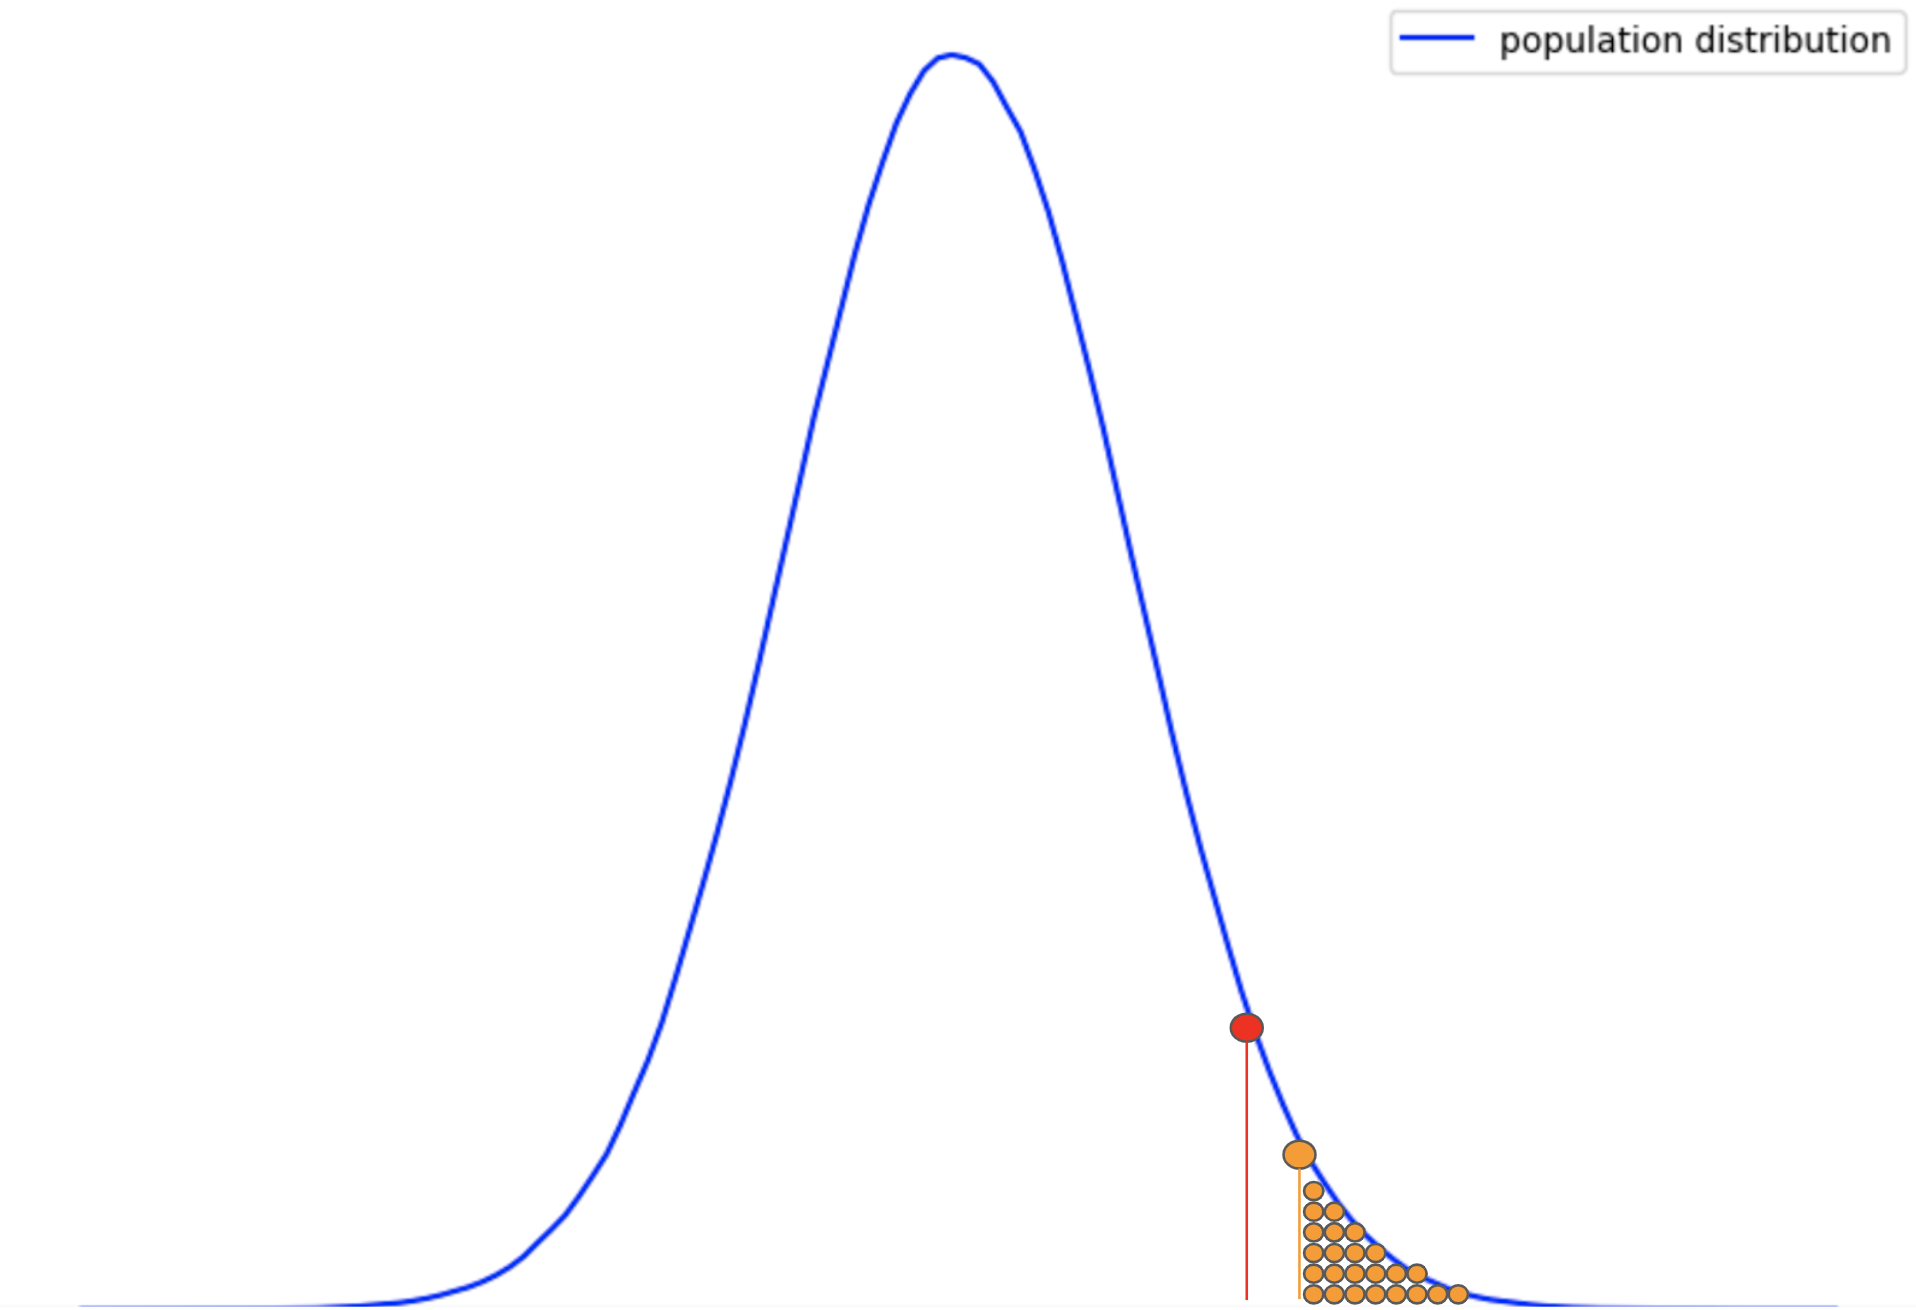
Consider the above normal distribution again. The red point in this distribution represents the alpha value or the threshold p-value. Now, let’s say that the green and orange points represent different sample results obtained after an experiment.
We can see in the plot that the leftmost green point has a p-value greater than the alpha. As a result, these values can be obtained with fairly high probability and the sample results are regarded as lucky.
The point on the rightmost side (orange) has a p-value less than the alpha value (red). As a result, the sample results are a rare outcome and very unlikely to be lucky. Therefore, they are significantly different from the population.
The alpha value is decided depending on the test being performed. An alpha value of 0.05 is considered a good convention if we are not sure of what value to consider.
But this comes with an asterisk – the smaller the value of alpha we consider, the harder it is to consider the results as significant. Keep in mind that the alpha value will vary from experiment to experiment and there is no alpha value which can be considered as a thumb rule.
Let’s look at the relationship between the alpha value and the p-value closely.
p-value < alpha
Consider the following population distribution:
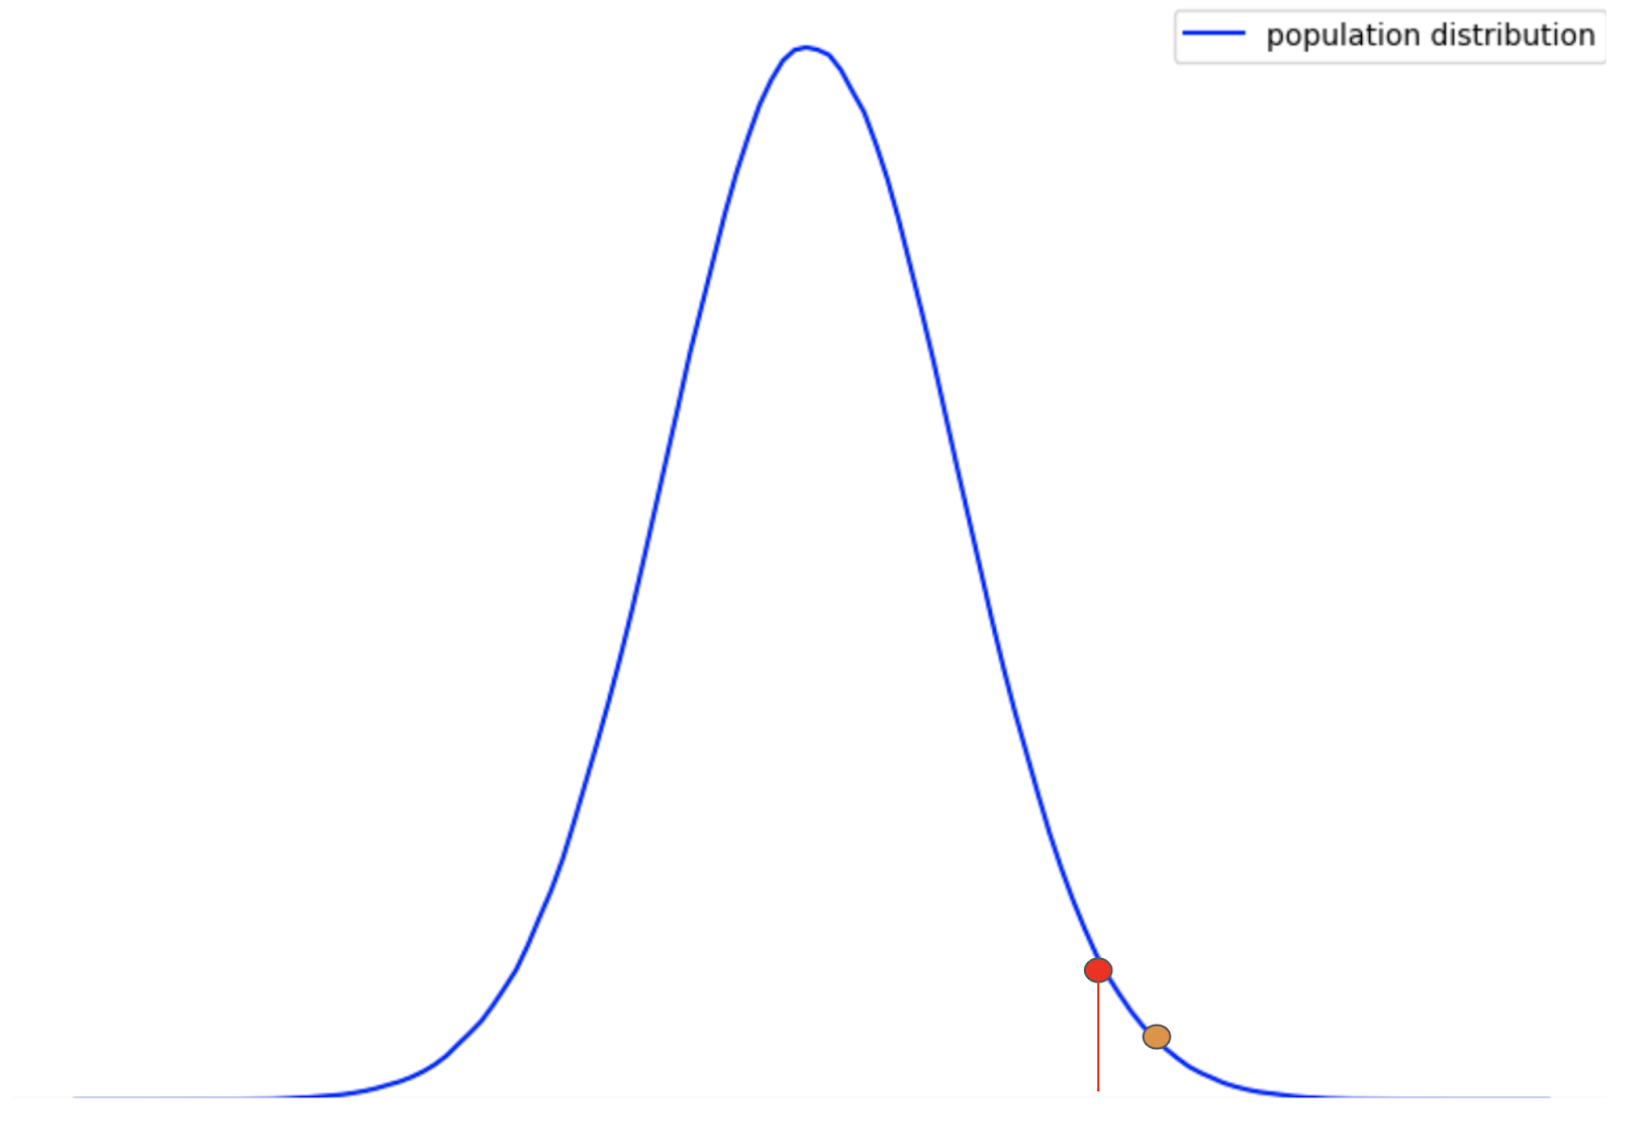
Here, the red point represents the alpha value. This is basically the threshold p-value. We can clearly see that the area under the curve to the right of the threshold is very low.
The orange point represents the p-value using the sample population. In this case, we can clearly see that the p-value is less than the alpha value (the area to the right of the red point is larger than the area to the right of the orange point). This can be interpreted as:
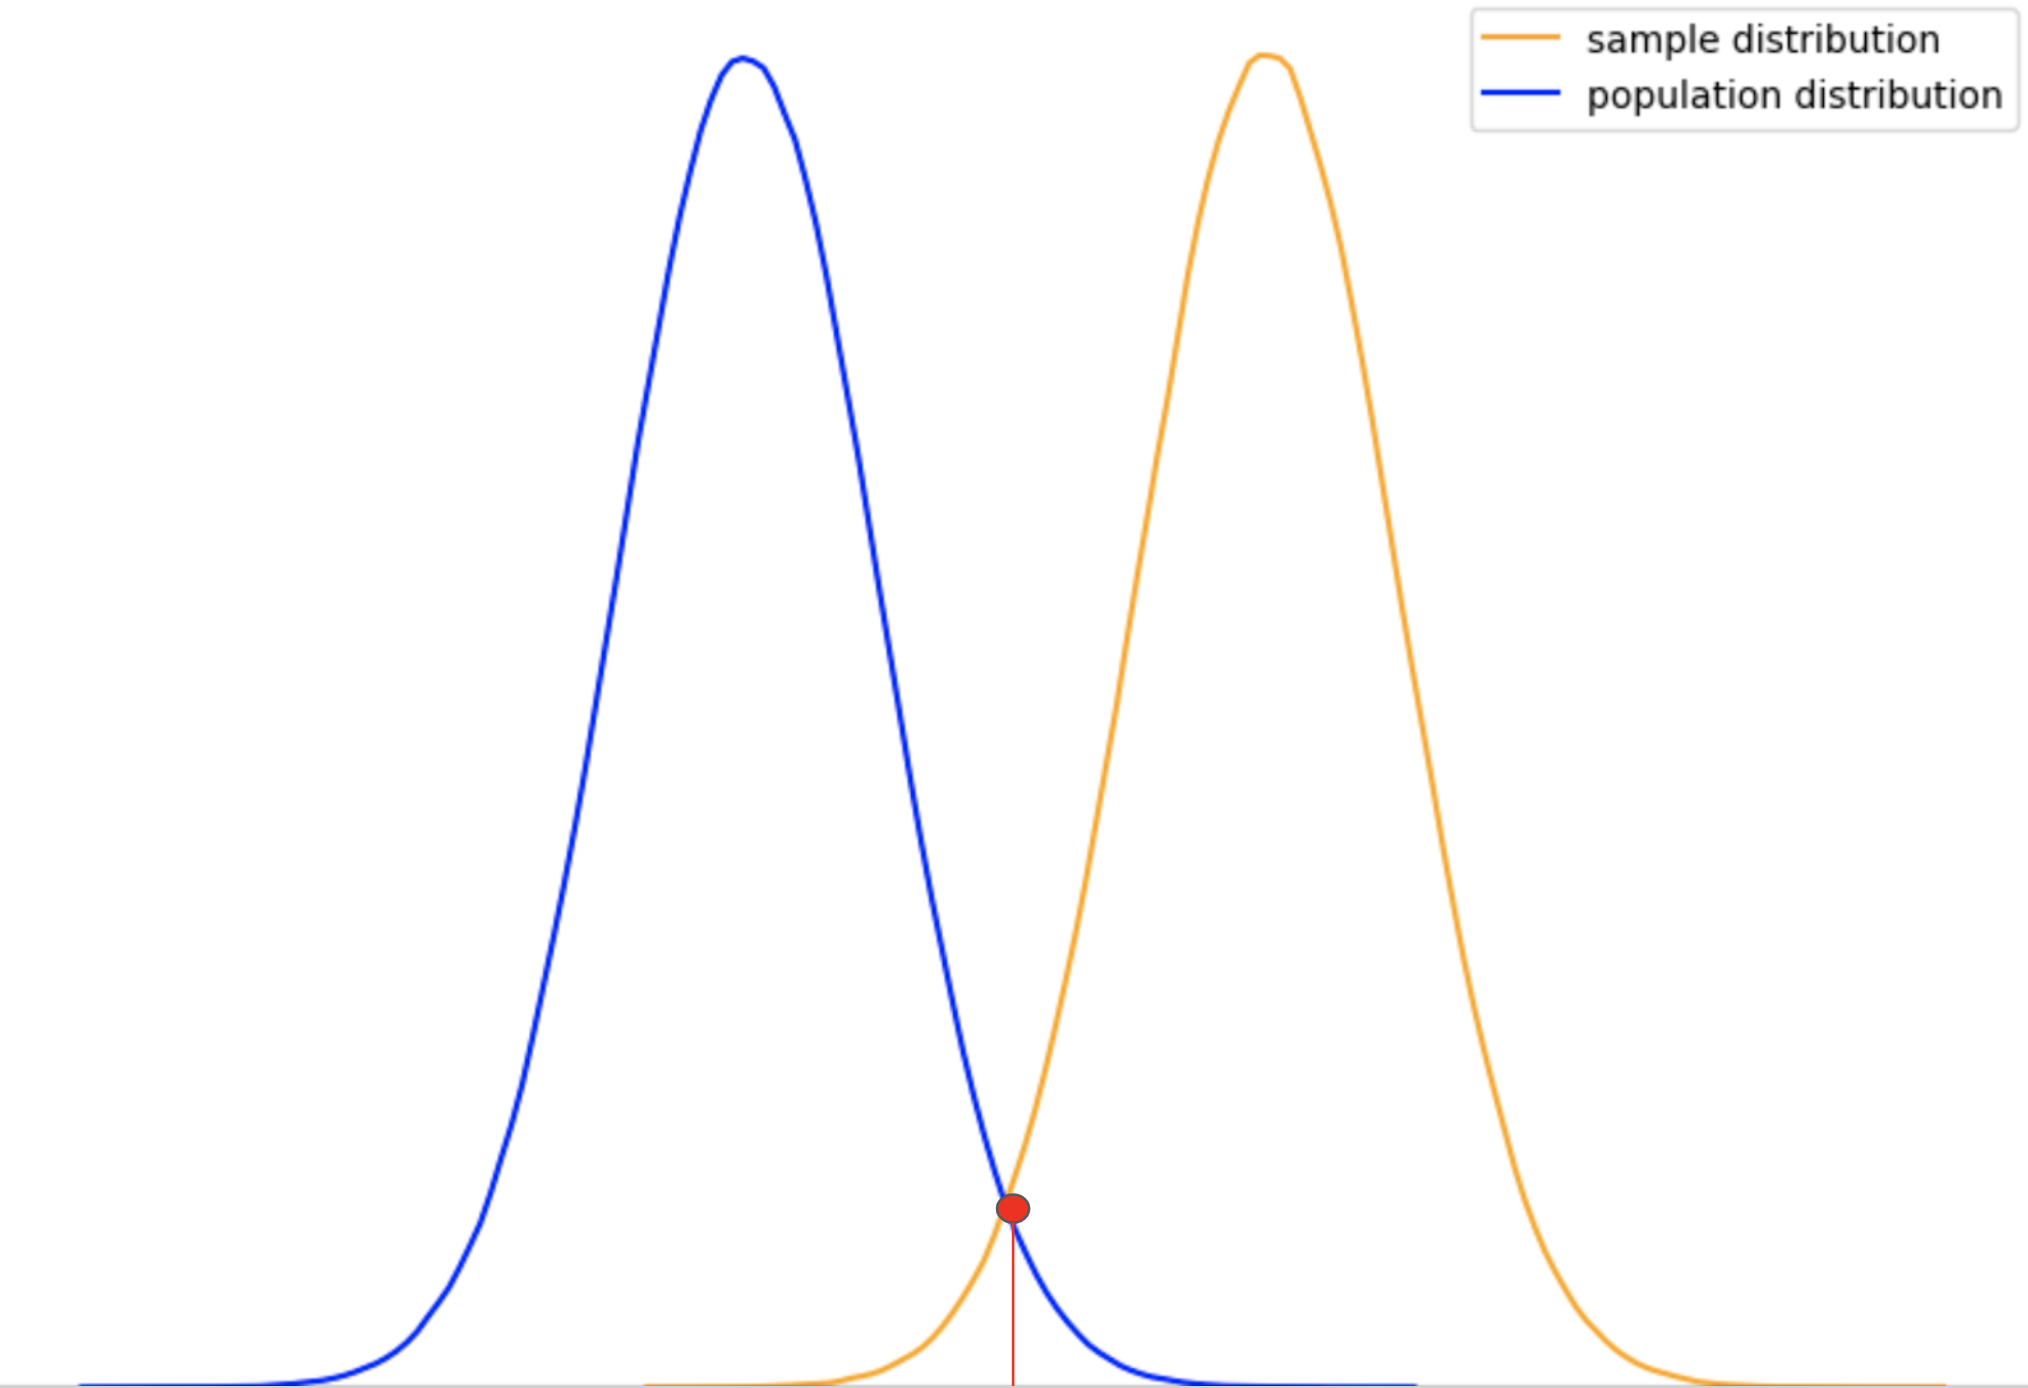
The results obtained from the sample is an extremity of the population distribution (an extremely rare event), and hence there is a good chance it may belong to some other distribution (as shown below).
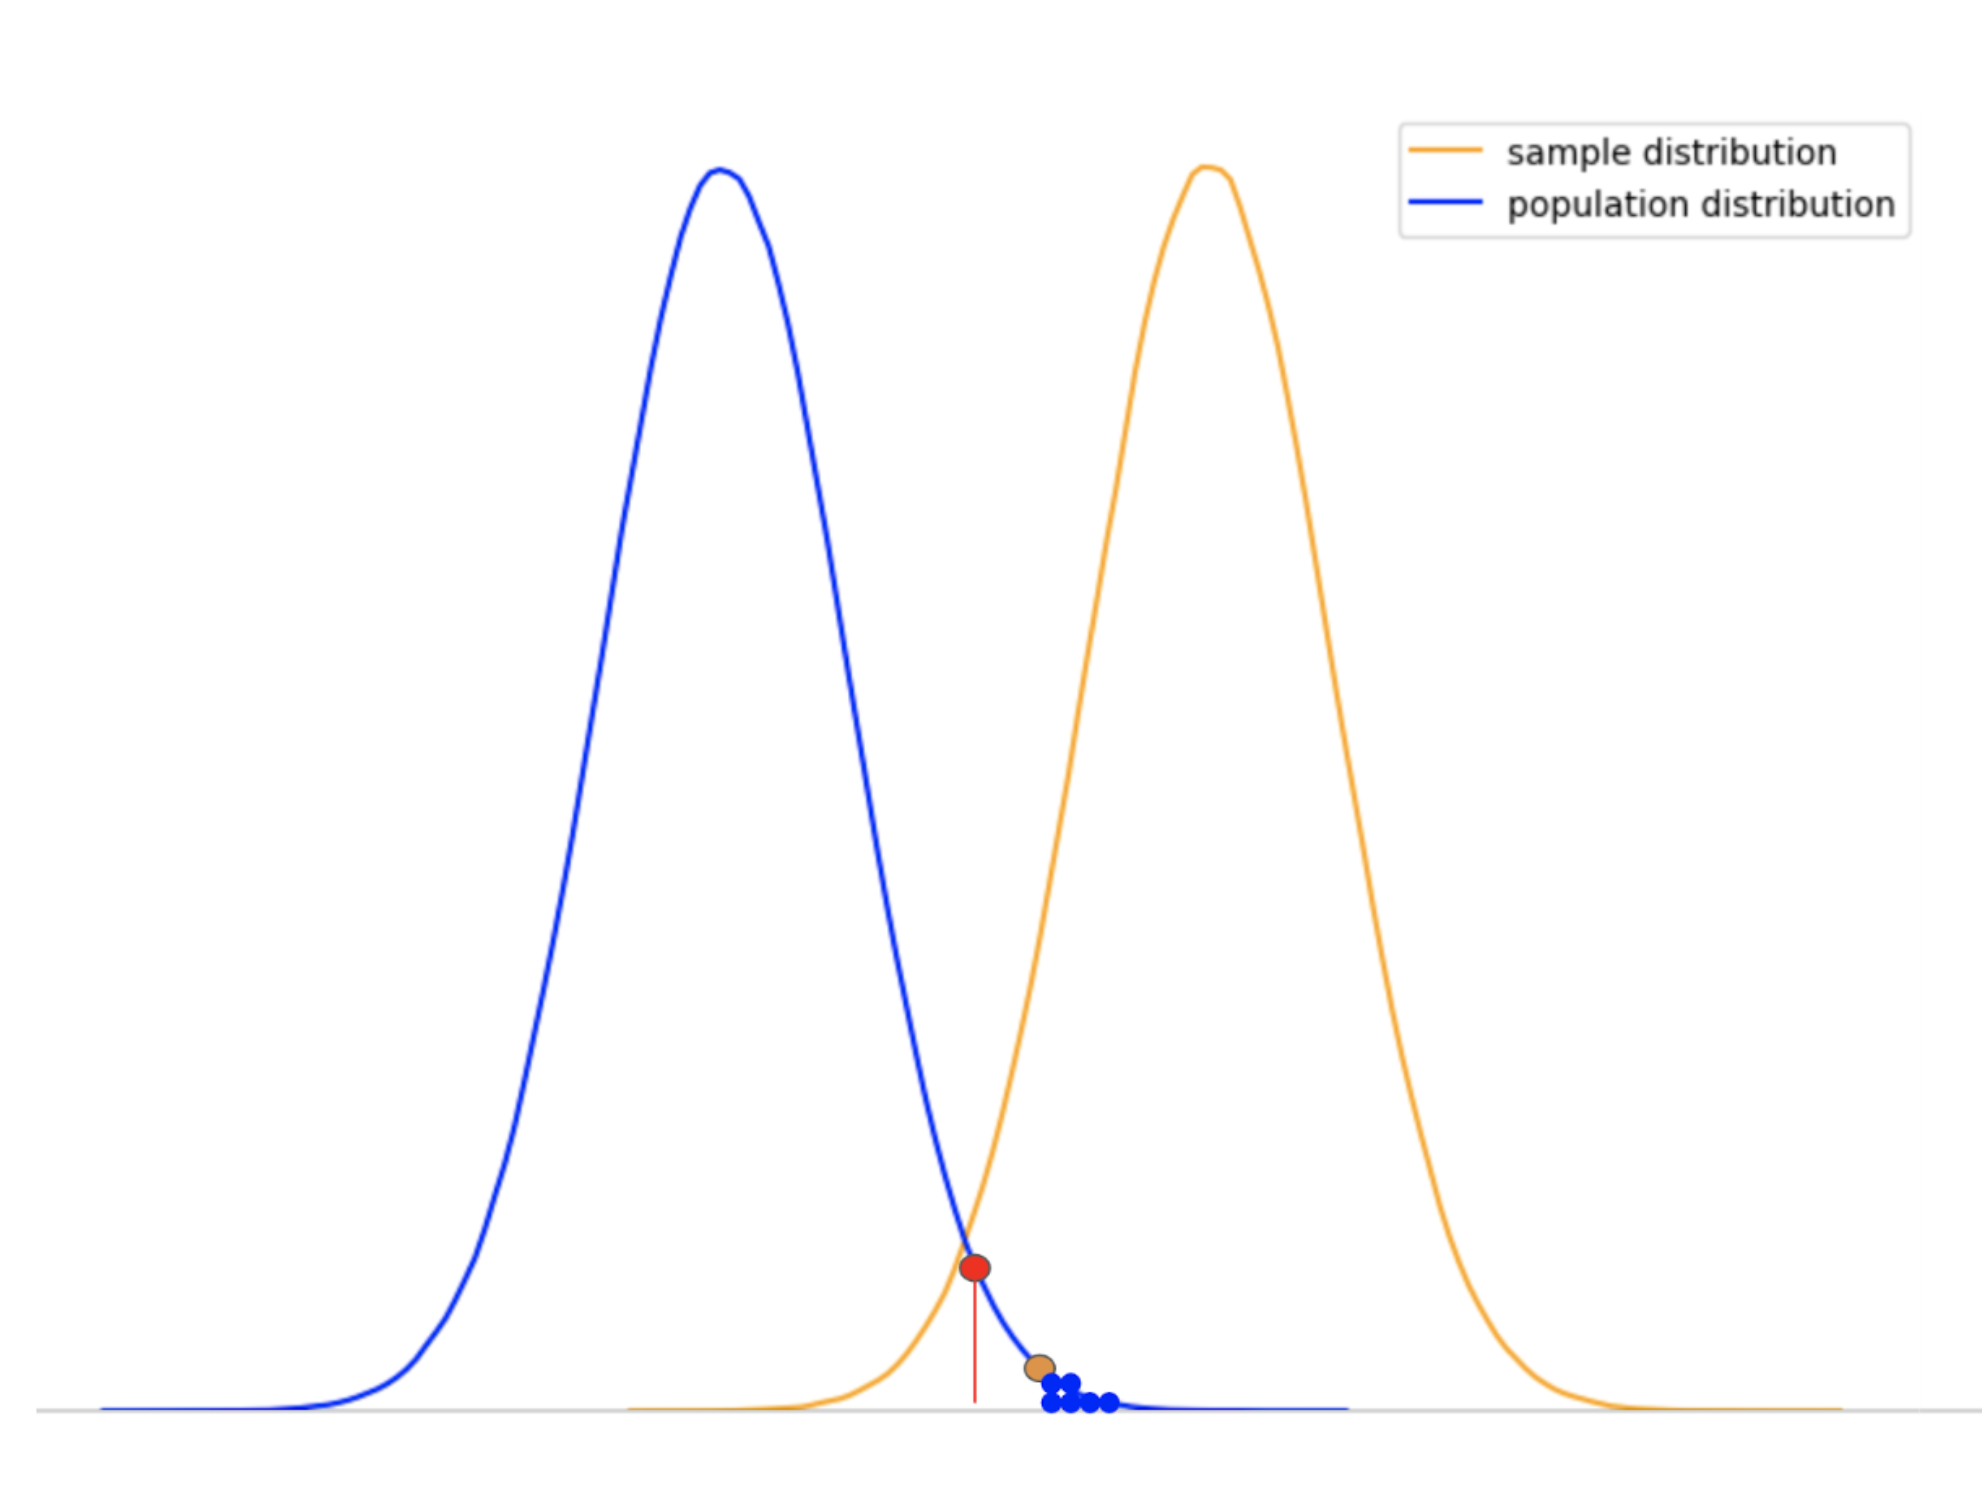
Considering our definitions of alpha and the p-value, we consider the sample results obtained as significantly different. We can clearly see that the p-value is far less than the alpha value.
p-value > alpha:
Right – I feel you should answer this question before reading further. Now that you know the other side of this coin, you will be able to think of the outcome of this scenario.
p-value greater than the alpha means that the results are in favor of the null hypothesis and therefore we fail to reject it. This result is often against the alternate hypothesis (obtained results are from another distribution) and the results obtained are not significant and simply a matter of chance or luck.
Again, consider the same population distribution curve with the red point as alpha and the orange point as the calculated p-value from the sample:
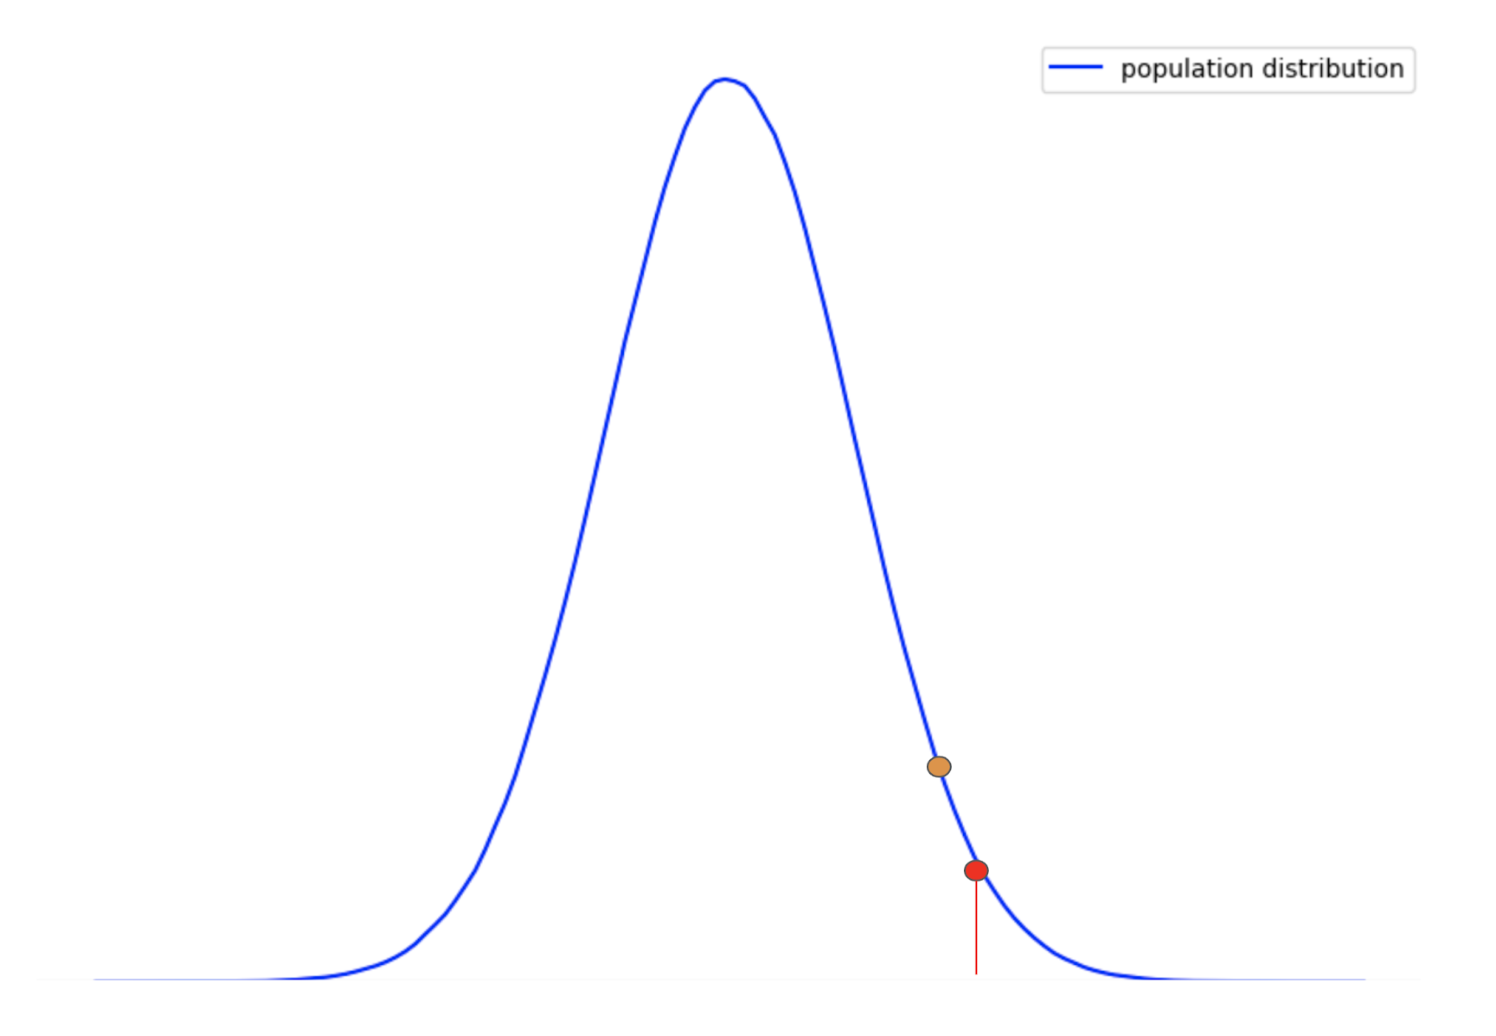
So, p-value > alpha (considering the area under the curve to the right-hand side of the red and the orange points) can be interpreted as follows:
The sample results are just a low probable event of the population distribution and are very likely to be obtained by luck.
We can clearly see that the area under the population curve to the right of the orange point is much larger than the alpha value. This means that the obtained results are more likely to be part of the same population distribution than being a part of some other distribution.
Now that we have understood the interpretation of the p-value and the alpha value, let’s look at a classic example from the world of statistics.
Example of p-value in Statistics
In the National Academy of Archery, the head coach intends to improve the performance of the archers ahead of an upcoming competition. What do you think is a good way to improve the performance of the archers?
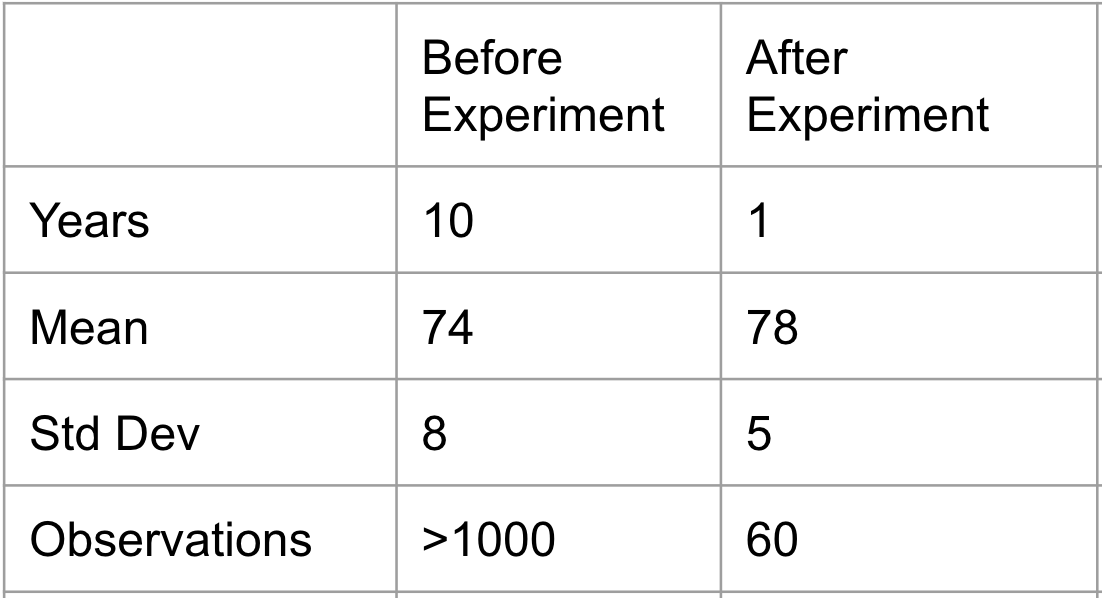
He proposed and implemented the idea that breathing exercises and meditation before the competition could help. The statistics before and after experiments are below:
Interesting. The results favor the assumption that the overall score of the archers improved. But the coach wants to make sure that these results are because of the improved ability of the archers and not by luck or chance. So what do you think we should do?

This is a classic example of a similarity test (Z-test in this case) where we want to check whether the sample is similar to the population or not. I will not go deep into the similarity test since that is out of the scope of this article.
In order to solve this, we will follow a step-by-step approach:
- Understand the information given and form the alternate and null hypothesis
- Calculate the Z-score and find the area under the curve
- Calculate the corresponding p-value
- Compare the p-value and the alpha value
- Interpret the final results
A solution to this Problem
Step 1: Understand the given information
- Population Mean = 74
- Population Standard Deviation = 8 (Historical data of the last 10 years is associated to the population)
- Sample Mean = 78
- Sample Size = 60 (Here, the sample is associated with the archers who practiced breathing exercises and meditation)
We have the population mean and standard deviation with us and the sample size is over 30, which means we will be using the Z-test.
According to the problem above, there can be two possible conditions:
- The after-experiment results are a matter of luck, i.e. mean before and after experiment are similar. This will be our “Null Hypothesis”
- The after-experiment results are indeed very different from the pre-experiment ones. This will be our “Alternate Hypothesis”
Step 2: Calculating the Z-Score
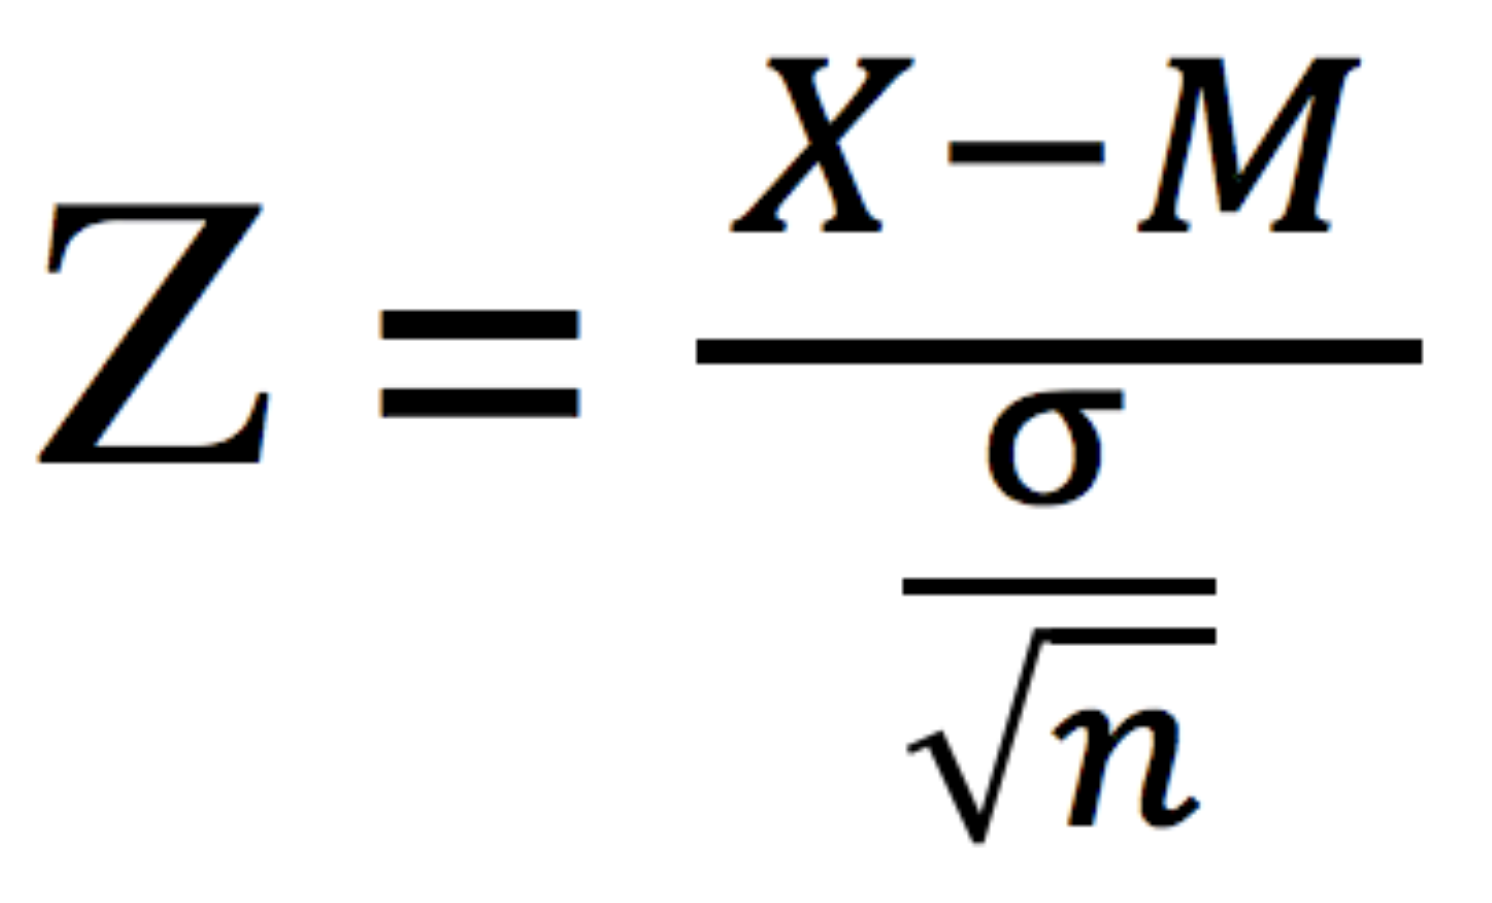
We will now calculate the Z-Score using the above formula. What do the symbols stand for, you ask? Well, here you go:
- X = Population Mean
- M = Sample Mean
- Sigma = Population Standard Deviation
- n = number of sample instances
On plugging in the corresponding values, Z-Score comes out to be – 3.87.
Step 3: Referring to the Z-table and finding the p-value:
If we look up the Z-table for 3.87, we get a value of ~0.999. This is the area under the curve or probability under the population distribution. But this is the probability of what?
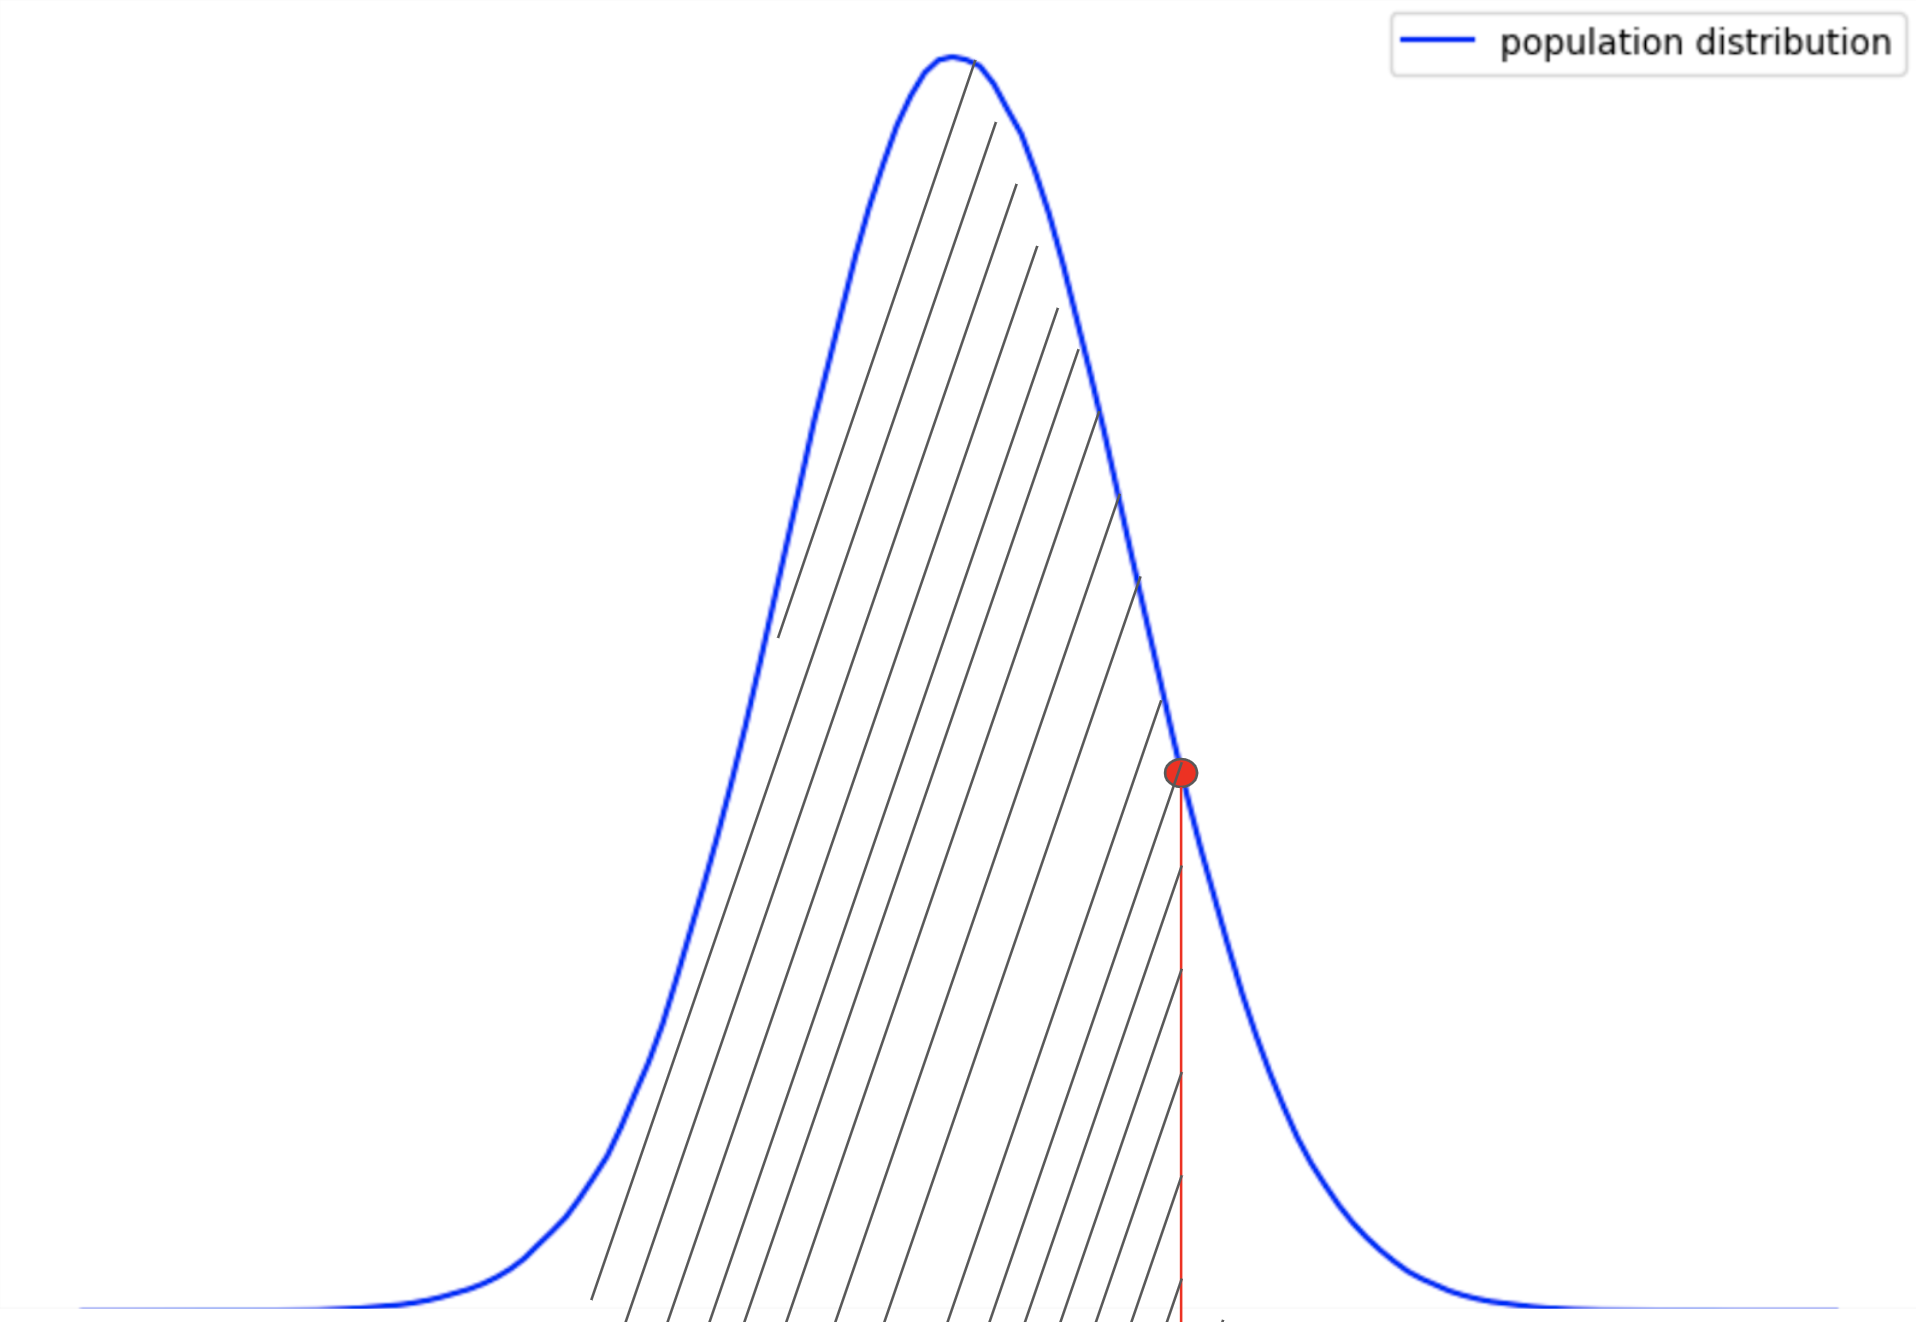
The probability that we obtained is to the left of the Z-score (Red Point) which we calculated. The value 0.999 represents the “total probability” of getting a result “less than the sample score 78”, with respect to the population.
Here, the red point signifies where the sample mean lies with respect to the population distribution. But we have studied earlier that p value is to the right-hand side of the red point, so what do we do?
For this, we will use the fact that the total area under the normal Z distribution is 1. Therefore the area to the right of Z-score (or p-value represented by the unshaded region) can be calculated as:
p-value = 1 – 0.999
p-value = 0.001
0.001 (p-value) is the unshaded area to the right of the red point. The value 0.001 represents the “total probability” of getting a result “greater than the sample score 78”, with respect to the population.
Step 4: Comparing p-value and alpha value:
We were not given any value for alpha, therefore we can consider alpha = 0.05. According to our understanding, if the likeliness of obtaining the sample (p-value) result is less than the alpha value, we consider the sample results obtained as significantly different.
We can clearly see that the p-value is far less than the alpha value:
0.001 (red region) << 0.5 (orange region)
This says that the likeliness of obtaining the mean as 78 is a rare event with respect to the population distribution. Therefore, it is convenient to say that the increase in the performance of the archers in the sample population is not the result of luck. The sample population belongs to some other (better in this case) distribution of itself.
Example of p-value in Data Science
Now, this is the section I’m sure you’ve been waiting for. Using p-value in statistics is understandable and we’ve even heard of it plenty of times. But where does p-value fit in the data science spectrum?
Even though many aspiring data scientists understand what the p-value means, they do not know how to use this knowledge in Data Science. As a result, they miss out on a significantly powerful method of improving their models.
P-value is an important metric in the process of feature selection. In feature selection, we try to find out the best subset of the independent variables to build the model.
Now you might ask, “Why not just throw in all the independent variables?”
Actually, throwing in redundant and non-contributing variables adds complexity to the model. Moreover, they can reduce the model performance in terms of accuracy, runtime and even memory footprint.
Note: If you need a refresher on feature selection, refer to the below tutorial:
Let’s look at an example. Consider that I have a dataset that contains information about different startups. We have the below variables:

Our aim is to predict the profits earned by the startups based on the rest of the independent variables. Now, your intuition might say – use all the independent variables available to build a linear regression model.
After preprocessing and OneHotEncoding, the dependent variables have the following mapping:

Next, we will build an OLS (ordinary least squares) model using the statsmodels library. Here’s what we get:
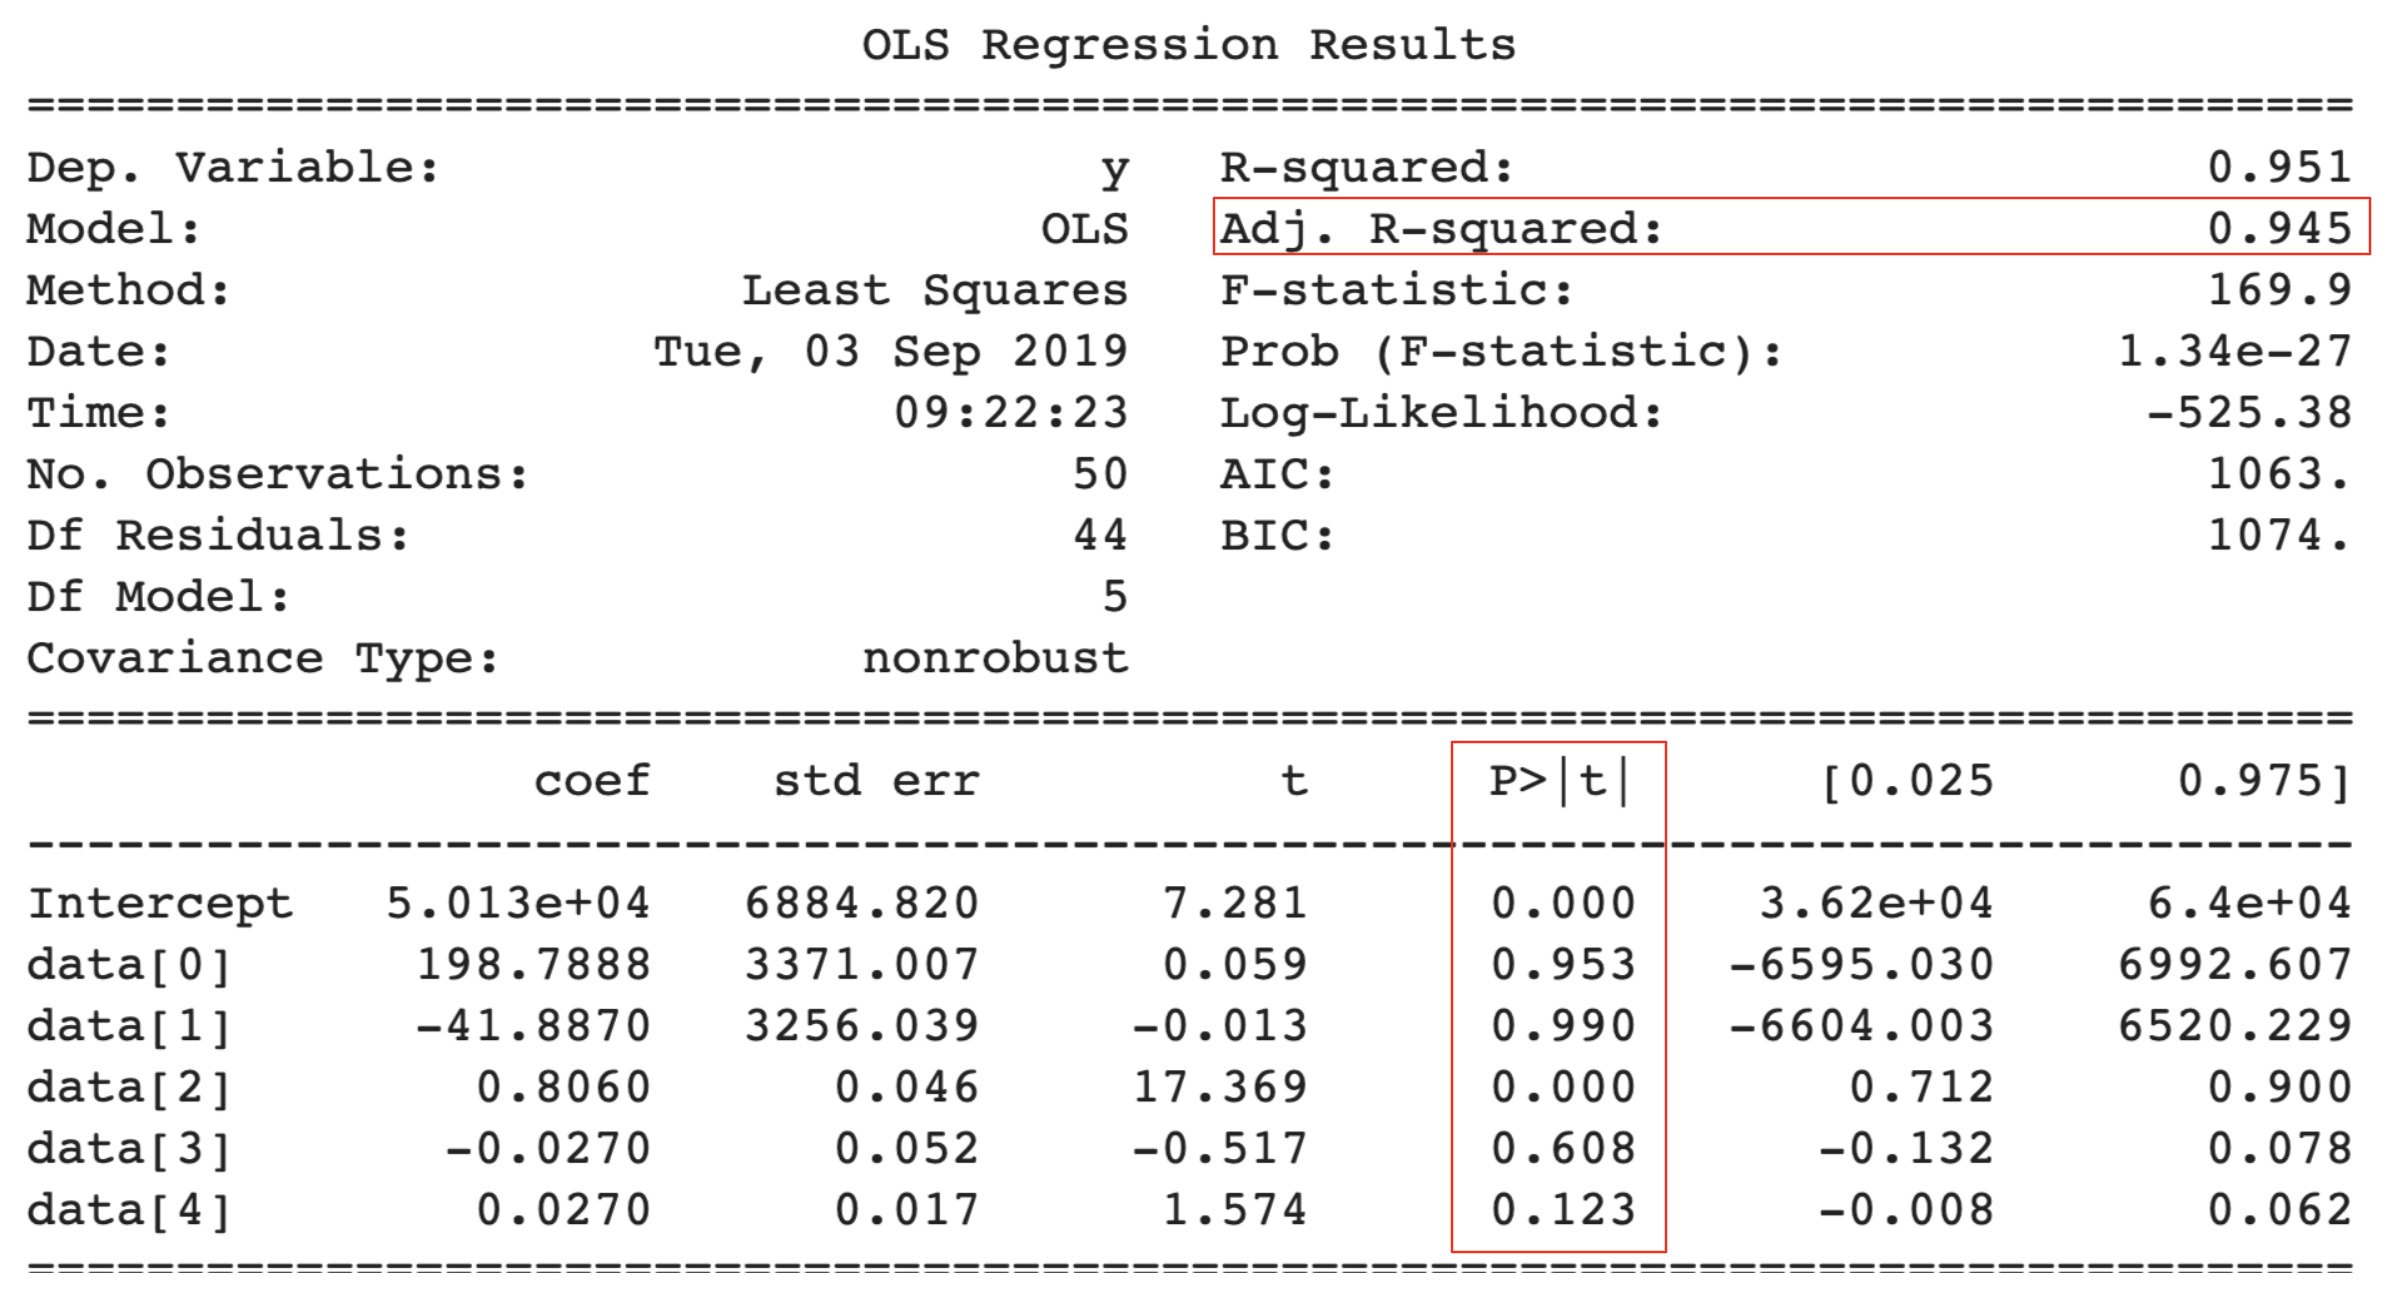
This table displays all the statistics regarding the independent variables. But right now, we are only interested in looking at the column with the p-values in it. We can clearly see that the “R&S Spend” , “Administration” and “State_California” have a p-value over 0.50!
But the question is, what does this p-value mean in a regression model? For that, let’s understand what’s the hypothesis for which these p-values are calculated:
- Null Hypothesis: The independent variable has no significant effect over the target variable
- Alternate Hypothesis: The independent variables have a significant effect on the target variable
Now, the above results show that “R&S Spend”, “Administration” and “State_California” have no significant effect over the “Profit” earned by the startups. So let’s start by removing these three variables from the model.
The resultant mapping after removing those two variables is:

On again building the OLS model using the statsmodels library, this is what we get:
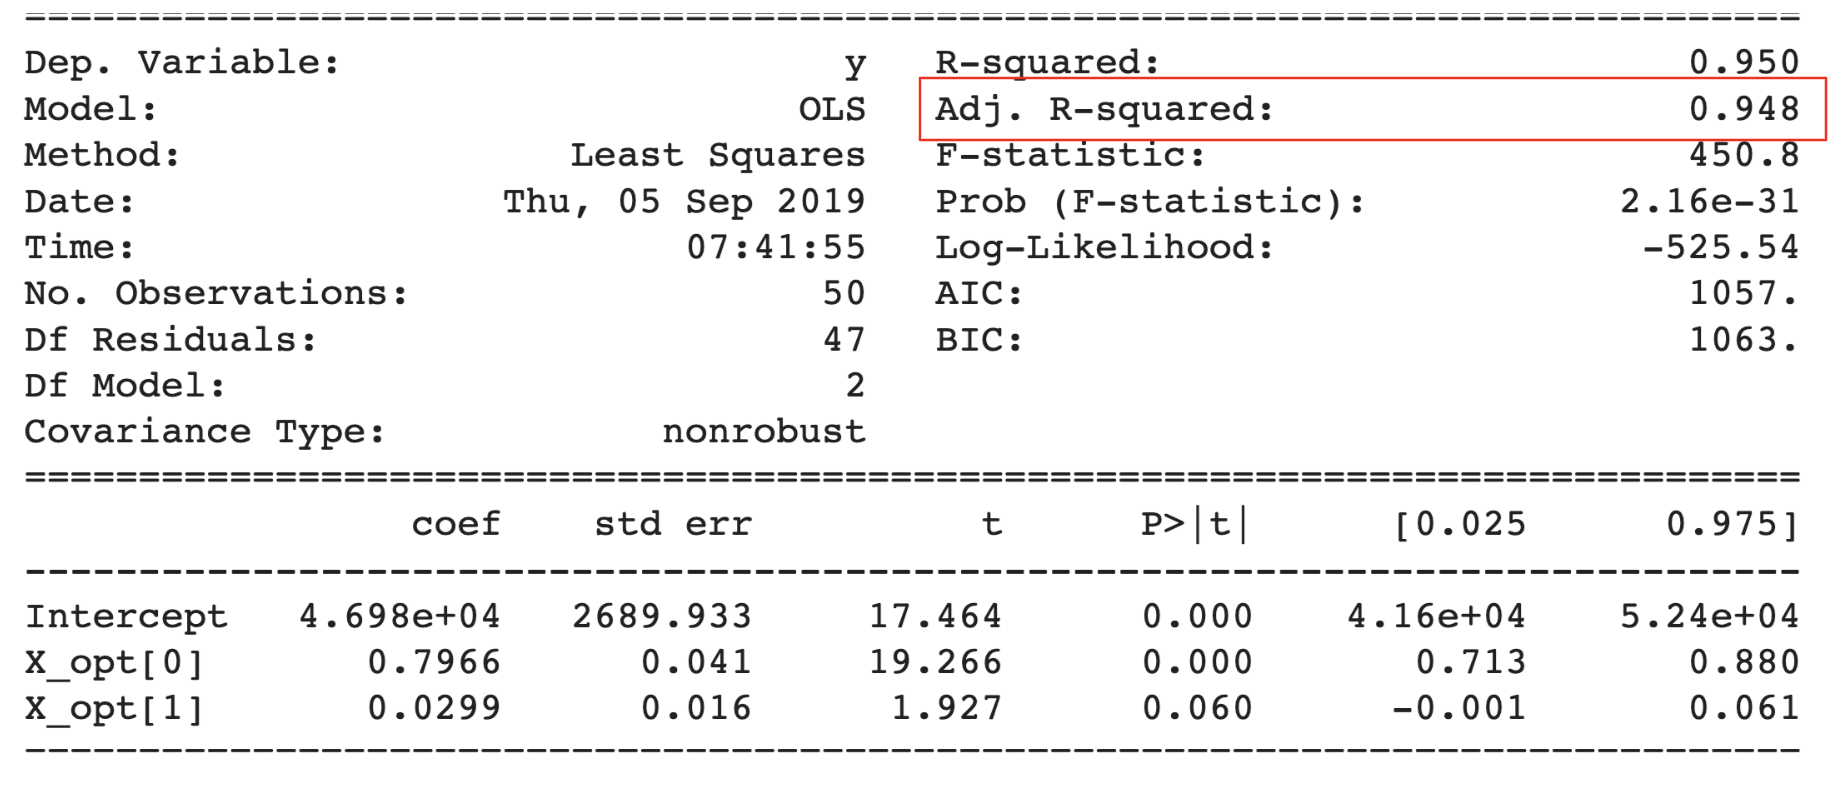
We can see that there is now only one variable left over the value of 0.05 – “State_Florida”. So should we remove it?
For starters, we never decided any alpha value. If we were to take the alpha value 0.05, the variable “State_Florida” would have been eliminated. If I would have selected the alpha as 0.10, the variable would have survived the filtration process.
In this case, I will let it stay considering that 0.05 is not a thumb rule to choose for the alpha value.
The most important thing to note in this model summary is that although we have reduced two independent variables, the value of the adjusted R-Square value went up.
This is a two-fold effect as we discussed previously. With the help of p-value, we not only made a simpler model with fewer variables, but we also improved the model’s performance.
Before wrapping up this article, let’s look at different ways p-values are misinterpreted by a lot of data science professionals and statisticians.
Some traditional (mis)interpretations of the p-value

There are many ways I have seen people misinterpreting the p-value. Here are just a few of the most common mistakes:
- The probability that we would reject the null hypothesis incorrectly: Although a low p-value promotes the rejection of the null hypothesis, it addresses nothing about the probability of rejecting it
- The level of statistical significance: We choose the significance level before we perform the experiment. If the p-value satisfies our level of significance (p < alpha), only then can we make conclusions
- The magnitude of the effect of intervention: p-value by no means signifies the magnitude of the intervention in the sample which was introduced during the experimentation
- The probability that the null hypothesis is true: This comes close and might not cause much harm, but it will still be a source of confusion. To talk about a null hypothesis being true using a frequentist statistic is impossible. A high p-value means that our data is highly consistent with our null hypothesis, nothing more
And there are many more! Keep these in mind and you’ll do well the next time you encounter p-value in your work.
End Notes
In this article, we followed a step by step procedure to understand p-value thoroughly by introducing one parameter at a time. P-value can be very intriguing to a new statistician or a data scientist, but the way we understood it above with example in statistics and an example in data science, I believe we can now explain p-value confidently to anyone without having to depend upon the complex definitions or conventions set in stone just because no one ever explained it to us.
If you want to learn more, check out the following courses:


A very concise and well written article. Something I was looking for a long time. I look forward to read more of your articles. Excellent. Keep up the good work.
Well Written. crisp clear and to the point. Enjoyed reading the article. I have seen many people struggling with the concept of a p-value. I hope this article will help many. Hope to see more articles from you.
Thank You. I am looking forward to writing more content.
Great explanation. So clear for newbies. Thanks for writing. Hope many more articles of yours in future.
Enjoyed reading basic concept of p-value. Very well written and supplemented by appropriate figures. Hoping to see more articles!!
Good Article ! I just want to ask about : The magnitude of the effect of intervention. What this means. Thanks.
"The magnitude of the effect of intervention" intervention is the experiment we conducted, in case of archery we introduced breathing and meditation. This interpretation would say that, p value signifies the degree of improvement/ potency/ effect of the breathing exercises or meditation. P values just answers one question "Are the samples results SIGNIFICANTLY different?" It does not tell us about the degree or strength of the experiment's success.
Great article.
I think there's a small typo on the formula for the X value. The sigma should be the population standard deviation instead of the mean. Great article btw! It was very easy to follow through to the end.
Thank you for pointing that out!
This is amazing bro . I just love it . I was so confused before reading this article but now it seems that i am able to understand things .
Happy to help, Arpit!
Just Amazing - Good example taken to explain , Simple and Understandable and interpretable
+1, Very well explained.
Hi Sharoon, Really liked your article. Just curious to know the factors that determine the selection of significance value.