Multicollinearity | Causes, Effects and Detection Using VIF (Updated 2024)
Introduction
Multicollinearity might be a handful to pronounce, but it’s a topic you should be aware of in the field of data science and machine learning, especially if you’re sitting for data scientist interviews! In this article, we will understand what multicollinearity is and how it is caused. We will also try to understand why it is a problem and how we can detect and fix it.

Before diving further, it is imperative to have a basic understanding of regression and some statistical terms. For this, I highly recommend going through the below resources:
- Fundamentals of Regression Analysis (Free Course!)
- Beginner’s Guide to Linear Regression
Learning Objective
- Understand what multicollinearity is and why it is a problem in a regression model.
- Learn the causes of multicollinearity.
- Understand how to detect multicollinearity using the variance inflation factor (VIF).
- Learn about the methods used to fix multicollinearity, including dropping correlated features.
Table of contents
What Is Multicollinearity?
Multicollinearity is a statistical phenomenon that occurs when two or more independent variables in a regression model are highly correlated with each other. In other words, multicollinearity indicates a strong linear relationship among the predictor variables. This can create challenges in the regression analysis because it becomes difficult to determine the individual effects of each independent variable on the dependent variable accurately.
Multicollinearity can lead to unstable and unreliable coefficient estimates, making it harder to interpret the results and draw meaningful conclusions from the model. It is essential to detect and address multicollinearity to ensure the validity and robustness of regression models.
Multicollinearity occurs when two or more independent variables in a data frame have a high correlation with one another in a regression model.
This means that one independent variable can be predicted from another in a regression model. For example, sets like height and weight, household income and water consumption, mileage and the price of a car, study time and leisure time, etc.
Let me take a simple example from our everyday life to explain this. Colin loves watching television while munching on chips. The more television he watches, the more chips he eats, and the happier he gets!
Now, if we could quantify happiness and measure Colin’s happiness while he’s busy doing his favorite activity, which do you think would have a greater impact on his happiness? Having chips or watching television? That’s difficult to determine because the moment we try to measure Colin’s happiness from eating chips, he starts watching television. And the moment we try to measure his happiness from watching television, he starts eating chips.
Eating chips and watching television are highly correlated in the case of Colin, and we cannot individually determine the impact of individual activities on his happiness. This is the multicollinearity problem!
So why should you worry about multicollinearity in the machine learning context? Let’s answer that question next.
KEY TAKEAWAYS
- Multicollinearity is a statistical term that describes the correlation between multiple independent variables in a model.
- When two variables have a correlation coefficient of either +1.0 or -1.0, they are considered perfectly collinear.
- The presence of multicollinearity among independent variables can lead to less dependable statistical conclusions.
The Problem With Having Multicollinearity
Multicollinearity can be a problem in a regression model when using algorithms such as OLS (ordinary least squares) in statsmodels. This is because the estimated regression coefficients become unstable and difficult to interpret in the presence of multicollinearity. Statsmodels is a Python library that provides a range of tools for statistical analysis, including regression analysis.
When multicollinearity is present, the estimated regression coefficients may become large and unpredictable, leading to unreliable inferences about the effects of the predictor variables on the response variable. Therefore, it is important to check for multicollinearity and consider using other regression techniques that can handle this problem, such as ridge regression or principal component regression. For example, let’s assume that in the following linear equation:
Y = W0+W1*X1+W2*X2
Coefficient W1 is the increase in Y for a unit increase in X1 while keeping X2 constant. But since X1 and X2 are highly correlated, changes in X1 would also cause changes in X2, and we would not be able to see their individual effect on Y.
The regression coefficient, also known as the beta coefficient, measures the strength and direction of the relationship between a predictor variable (X) and the response variable (Y). In the presence of multicollinearity, the regression coefficients become unstable and difficult to interpret because the variance of the coefficients becomes large. This results in wide confidence intervals and increased variability in the predicted values of Y for a given value of X. As a result, it becomes challenging to determine the individual contribution of each predictor variable to the response variable and make reliable inferences about their effects on Y.
“ This makes the effects of X1 on Y difficult to distinguish from the effects of X2 on Y. ”
Multicollinearity may not affect the accuracy of the machine-learning model as much. But we might lose reliability in determining the effects of individual features in your model – and that can be a problem when it comes to interpretability.
What Causes Multicollinearity?
Multicollinearity could occur due to the following problems:
- Multicollinearity could exist because of the problems in the dataset at the time of creation. These problems could be because of poorly designed experiments, highly observational data, or the inability to manipulate the data.
For example, determining the electricity consumption of a household from the household income and the number of electrical appliances. Here, we know that the number of electrical appliances in a household will increase with household income. However, this cannot be removed from the dataset. - Multicollinearity could also occur when new variables are created which are dependent on other variables.
For example, creating a variable for BMI from the height and weight variables would include redundant information in the model, and the new variable will be a highly correlated variable. - Including identical variables in the dataset.
For example, including variables for temperature in Fahrenheit and temperature in Celsius. - Inaccurate use of dummy variables can also cause a multicollinearity problem. This is called the Dummy variable trap.
For example, in a dataset containing the status of marriage variable with two unique values: ‘married’, and ’single’. Creating dummy variables for both of them would include redundant information. We can make do with only one variable containing 0/1 for ‘married’/’single’ status. - Insufficient data, in some cases, can also cause multicollinearity problems.
Detecting Multicollinearity Using a Variance Inflation Factor (VIF)
Let’s try detecting multicollinearity in a dataset to give you a flavor of what can go wrong.
I have created a dataset determining the salary of a person in a company based on the following features:
- Gender (0 – female, 1- male)
- Age
- Years of service (Years spent working in the company)
- Education level (0 – no formal education, 1 – under-graduation, 2 – post-graduation)

In Python, there are several ways to detect multicollinearity in a dataset, such as using the Variance Inflation Factor (VIF) or calculating the correlation matrix of the independent variables. To address multicollinearity, techniques such as regularization or feature selection can be applied to select a subset of independent variables that are not highly correlated with each other. In this article, we will focus on the most common one – VIF (Variance Inflation Factors).
” VIF determines the strength of the correlation between the independent variables. It is predicted by taking a variable and regressing it against every other variable. “
or
VIF score of an independent variable represents how well the variable is explained by other independent variables.
R^2 value is determined to find out how well an independent variable is described by the other independent variables. A high value of R^2 means that the variable is highly correlated with the other variables. This is captured by the VIF, which is denoted below:
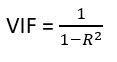
So, the closer the R^2 value to 1, the higher the value of VIF and the higher the multicollinearity with the particular independent variable.
- VIF starts at 1 and has no upper limit
- VIF = 1, no correlation between the independent variable and the other variables
- VIF exceeding 5 or 10 indicates high multicollinearity between this independent variable and the others
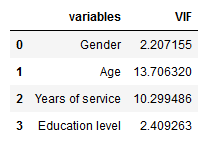
We can see here that the ‘Age’ and ‘Years of service’ have a high VIF value, meaning they can be predicted by other independent variables in the dataset.
Although correlation matrix and scatter plots can also be used to find multicollinearity, their findings only show the bivariate relationship between the independent variables. VIF is preferred as it can show the correlation of a variable with a group of other variables.
Fixing Multicollinearity
Dropping one of the correlated features will help in bringing down the multicollinearity between correlated features:

The image on the left contains the original VIF value for variables, and the one on the right is after dropping the ‘Age’ variable. We were able to drop the variable ‘Age’ from the dataset because its information was being captured by the ‘Years of service’ variable. This has reduced the redundancy in our dataset. Dropping variables should be an iterative process starting with the variable having the largest VIF value because other variables highly capture its trend. If you do this, you will notice that VIF values for other variables would have reduced, too, although to a varying extent.
In our example, after dropping the ‘Age’ variable, VIF values for all variables have decreased to varying degrees.
Next, combine the correlated variables into one and drop the others. This will reduce the multicollinearity.
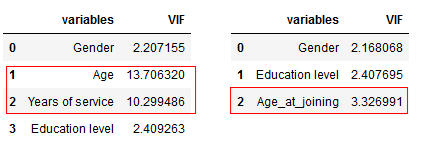
The image on the left contains the original VIF value for variables, and the one on the right is after combining the ‘Age’ and ‘Years of service’ variables. Combining ‘Age’ and ‘Years of experience’ into a single variable, ‘Age_at_joining’ allows us to capture the information in both variables.
However, multicollinearity may not be a problem every time. The need to fix multicollinearity depends primarily on the following reasons:
- When you care more about how much each individual feature rather than a group of features affects the target variable, then removing multicollinearity may be a good option
- If multicollinearity is not present in the features you are interested in, then multicollinearity may not be a problem.
Conclusion
We learned how the problem of multicollinearity could occur in regression models when two or more independent variables in a data frame have a high correlation with one another. Its presence can cause the regression coefficients to become unstable and difficult to interpret, which can lead to wide confidence intervals and increased variability in the predicted values of the dependent variable. Understanding what causes it and how to detect and fix it can help us to overcome these problems.
In this article, we explored how the Variance Inflation Factor (VIF) can be used to detect the existence of multicollinearity in our dataset and how to fix the problem by identifying and dropping the correlated variables. Remember, when assessing the statistical significance of predictor variables in a regression model, it is important to consider their individual coefficients and their standard errors, p-values, and confidence intervals. Predictor variables with high multicollinearity may have inflated standard errors and p-values, which can lead to incorrect conclusions about their statistical significance.
If you want to understand other regression models or want to understand model interpretation, I highly recommend going through the following wonderfully written articles:
- Regression Modeling
- Machine Learning Model Interpretability
As a next step, you should also check out the Fundamentals of Regression (free) course.
Key Takeaways
- Multicollinearity occurs when two or more independent variables have a high correlation with one another in a regression model, which makes it difficult to determine the individual effect of each independent variable on the dependent variable.
- Multicollinearity can occur due to poorly designed experiments, highly observational data, creating new variables that are dependent on other variables, including identical variables in the dataset, inaccurate use of dummy variables, or insufficient data.
- One method to detect multicollinearity is to calculate the variance inflation factor (VIF) for each independent variable, and a VIF value greater than 1.5 indicates multicollinearity.
- To fix multicollinearity, one can remove one of the highly correlated variables, combine them into a single variable, or use a dimensionality reduction technique such as principal component analysis to reduce the number of variables while retaining most of the information.
Frequently Asked Questions
A. To identify the linearity of correlation, one can use scatter plots, correlation coefficients, or linear regression models. A scatter plot can visually display the relationship between two variables. A correlation coefficient can provide a numerical value indicating the strength and direction of the relationship, with values close to +1 or -1 indicating high linearity. A linear regression model can help predict the value of one variable based on the value of the other variable, with a high R-squared value indicating a strong linear relationship.
A. To identify the linearity and collinearity of correlation, one can use scatter plots, correlation coefficients, or linear regression models. A scatter plot can visually display the relationship between two variables. A correlation coefficient can provide a numerical value indicating the strength and direction of the relationship, with values close to +1 or -1 indicating high linearity. VIF can be used to detect multicollinearity among the predictor variables, and a linear regression model can help predict the value of one variable based on the value of the other variable, with a high R-squared value indicating a strong linear relationship.
A. Variance Inflation Factor (VIF) can be used in solving multicollinearity in a regression analysis. If multicollinearity is detected among predictor variables, VIF can help identify which variables are contributing to the multicollinearity. The higher the VIF value for a variable, the more it contributes to multicollinearity. Removing variables with high VIF values can help reduce multicollinearity and improve the accuracy and stability of the regression model. A rule of thumb is to remove variables with VIF values greater than 5 or 10, depending on the specific context. VIF values have standard errors, and the confidence intervals for the VIF can be calculated and used to assess the significance of the collinearity.


How does non linear algo handle multi colinearity
For tree-based algorithms, multicollinearity wouldn't matter much as they split on the feature that gives higher information gain. However, for other algorithms like polynomial regression and SVM, regularization can be used.
Hi Aniruddha, when you wrote "Coefficient W1 is the increase in Y for a unit increase in W1 while keeping X2 constant." didn't you mean "Coefficient W1 is the increase in Y for a unit increase in X1 while keeping X2 constant."? Cheers, Chris.
Hey Chris, thanks for pointing out the mistake.
Hi Aniruddha I found this article very useful, could you share dataset so that readers may implement code at their end to get maximum out of this article
Hi Parvesh Glad you liked the article. I created a dummy dataset for this article. You can access it at this link. Thanks
Thank you for explaining this in such fashion, it helped me understand what is and how to deal with VIF.
Thanks for the article. When you talked categorical data being hot encoded, do we still need to perform the VIF on the encoded variable to see if it is highly correlated to other variables?
Yes, you can check the multicollinearity.
My every doubt regarding Reduction of Multivariate correlation is cleared by this article. Thank You very much.
Glad you found it useful!
Hi ANIRUDDHA, excellent post straight to the point. I might add the level of when VIF might become problematic. In general, if the VIF value exceeds 5 - 10 indicates a problem (source: Introduction to Statistical Learning, page 101). Cheerio, Franco
Thanks, Franco!
great article. thanks.
very informative .Thanks for such a clear explanation
Hi Aniruddha, Great post, very informative and easy to understand! There is only one thing I would change: you are not taking into consideration the intercept, which is something you really want to do. Try your method with the Boston data set and then compare it to the results shown in page 114 of the book ISLR, you will see the difference. The problem is that the stastsmodels library is the one ignoring the intercept, so you should add it. I added this to your code: from statsmodels.tools.tools import add_constant def calc_vif(df): X = df.copy() X = add_constant(X) # Calculating VIF vif = pd.DataFrame() vif["variables"] = X.columns vif["VIF"] = [variance_inflation_factor(X.values, i) for i in range(X.shape[1])] return vif X = boston.iloc[:,:-1] calc_vif(X).T Hope it helps! Jesus Inciarte.
Just a corrections ,its Variance inflation factor not Variable inflation factor. Please change it
Thank you for this very informative article sir. May I ask, if independent variables are perfectly correlated, could the f ratio be defined?
Dear Aniruddha, Thank you for your comprehensive and insightful article on multicollinearity, its causes, effects and detection using VIF. I appreciate the time and effort you put into explaining this concept so thoroughly, especially the section on Variance Inflation Factor (VIF). Your clear and practical explanation of how to use VIF to identify multicollinearity in a dataset is especially useful. Thanks again for this valuable resource!
I satisfied with your note.So,go ahead provide such a smart note.
you described R^2 as R^2 value is determined to find out how well an independent variable is described by the other independent variables. here you made mistake by placing independent instead of dependent variable The correct would be R^2 value is determined to find out how well an dependent variable is described by the other independent variables.