The Importance of Exploratory Data Analysis (EDA)
There are no shortcuts in a machine learning project lifecycle. We can’t simply skip to the model building stage after gathering the data. We need to plan our approach in a structured manner and the exploratory data analytics (EDA) stage plays a huge part in that.
I can say this with the benefit of hindsight having personally gone through this situation plenty of times.
In my early days in this field, I couldn’t wait to dive into machine learning algorithms but that often left my end result hanging in the balance. I discovered, through personal experience and the advice of my mentors, the importance of spending time exploring and understanding my data.

I found this to be true even for text data in Natural Language Processing (NLP) projects. We need to perform investigative and detective analysis of our data to see if we can unearth any insights. Trust me, you will appreciate the EDA stage the more you work on text data.
And there’s no shortage of text data, is there? We have data being generated from tweets, digital media platforms, blogs, and a whole host of other sources. As a data scientist and an NLP enthusiast, it’s important to analyze all this text data to help your organization make data-driven decisions.
And exploratory data analysis ties all of this together. I would venture to say it’s a critical cog in your NLP project – a stage you simply cannot afford to skip.
Exploratory Data Analysis is the process of exploring data, generating insights, testing hypotheses, checking assumptions and revealing underlying hidden patterns in the data.
Therefore, in this article, we will discuss how to perform exploratory data analysis on text data using Python through a real-world example. And if you’re new to the brilliant but vast world of NLP or data visualization, you can browse through the below resources:
Table of Contents
- Understanding the Problem Statement
- Basic Text Data Pre-processing
- Cleaning Text Data
- Preparing Data for Exploratory Data Analysis (EDA)
- Exploratory Data Analysis of Text Data (Amazon’s Products)
Understanding the Problem Statement
The first step in any machine learning project is understanding the problem. So that’s what we’ll aim to do here.
I’m a big fan of Amazon’s product lineup. Here, I have taken a dataset containing reviews of various products manufactured by Amazon, like Kindle, Fire TV, Echo, etc. You can download the dataset here.

The dataset has about 34,000+ rows, each containing review text, username, product name, rating, and other information for each product. Our objective is to use this data, explore it, and generate insights from it.

Let’s get the ball rolling and explore this dataset using different techniques and generate insights from it.
Basic Text Data Pre-processing
Before jumping to the exploration stage, we need to perform basic data pre-processing steps like null value imputation and removal of unwanted data. So, let’s start by importing libraries and reading our dataset:
![]()
The dataset contains 34,660 rows and 21 columns. But we only need information such as product name, review text, user recommendation (binary), and the number of people that found a review helpful. Therefore, I am dropping other columns and reducing the dataset to only four columns, i.e., ‘name’, ‘reviews.text’, ‘reviews.doRecommend’, and ‘reviews.numHelpful’:

Let’s see if there are any null values present in our dataset:
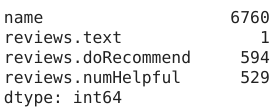
There are a few null values in the dataset. So, let’s drop these null values and proceed further:

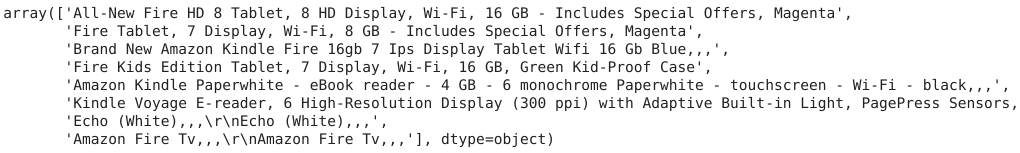
I am only considering those products that have at least 500 reviews. I am doing this to make sure that I have a sufficient number of reviews for each product. Here, we will use lambda functions with filter() to filter our dataset.
If you want to know more about lambda functions, then you can read this article: What are Lambda Functions? A Quick Guide to Lambda Functions in Python. I highly recommend doing that because I’ll be using lambda functions quite a bit later in this article.
![]()
Now, we are left with eight products. Also, the ‘reviews.doRecommend’ column contains values in the form of True-False and’ reviews.numHelpful’ contains floating-point numbers, which is not possible. Therefore, I am converting these columns into integers:
That’s it! We are finished with the basic data-preprocessing part. Let’s move to the next section – cleaning text data.
Cleaning Text Data in Python
Generally, text data contains a lot of noise either in the form of symbols or in the form of punctuations and stopwords. Therefore, it becomes necessary to clean the text, not just for making it more understandable but also for getting better insights.
In this section, we’ll perform text cleaning on the columns containing textual data. If you want to learn in-depth about text cleaning in Python, you can read this fantastic article: Steps for effective text data cleaning (with a case study using Python). It explains various techniques of text cleaning with implementation in python.
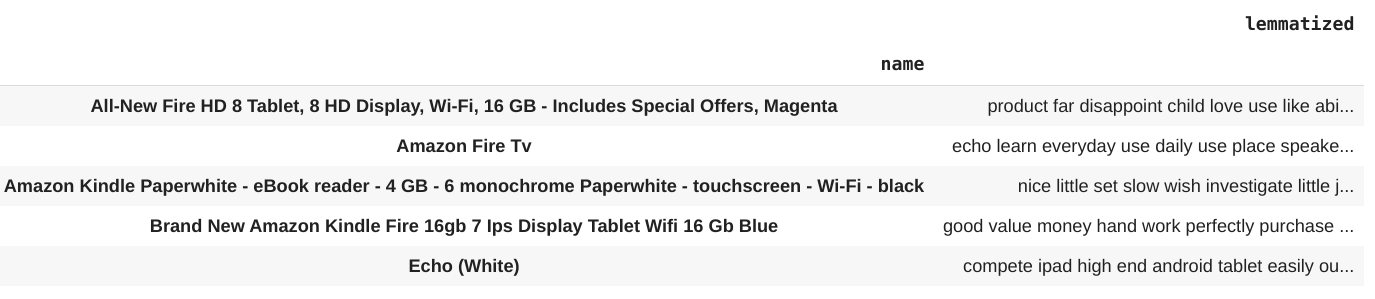
Here, we have four columns in our dataset out of which two columns (‘name’, ‘reviews.text’) contain textual data. So, let’s start with the ‘name’ column first and take a look at the text present in this column:
Take a close look at the title of products. Some product names contain repeating names separated by three consecutive commas (,,,). So, let’s clean the name of the products:
Now, it’s time to move on to the second column – reviews.text’. This column contains product reviews from different users, which are longer in length, and our complete analysis will be based on this data. Therefore, it becomes necessary to clean this thoroughly. The best way of determining data cleaning steps is by taking a look at some product reviews from the dataset:

Here, you can see that we have some contractions like “It’s”, numbers like “3” and punctuations like “,”, “!” and “.” present in the reviews. We’ll handle these by performing the below operations:
- Expand contractions
- Lowercase the reviews
- Remove digits and words containing digits
- Remove punctuations
So, let’s start by expanding contractions.
Expand Contractions
Contractions are the shortened versions of words like don’t for do not and how’ll for how will. These are used to reduce the speaking and writing time of words. We need to expand these contractions for a better analysis of the reviews.
Here, I have created a dictionary of common English contractions that I will use for mapping the contractions to their expanded forms:
Here, the expand_contractions function uses regular expressions to map the contractions in the text to their expanded forms from the dictionary. I will be using regular expressions a lot in the upcoming sections. Therefore, I highly recommend you to read the following articles on regular expressions:
- Beginner’s Tutorial for Regular Expressions in Python
- Extracting information from reports using Regular Expressions Library in Python
- 4 Applications of Regular Expressions that every Data Scientist should know (with Python code)!
Now that we have expanded the contractions, it’s time to lowercase the words.
Lowercase the reviews
In NLP, models treat words like Goat and goat differently, even if they are the same. Therefore, to overcome this problem, we lowercase the words. Here, I am using the lower() function available in Python for converting text to lowercase:
Remove digits and words containing digits
Next, we need to remove numbers and words containing digits from the reviews. I am doing this because digits and words containing digits do not give much importance to the main words. To do this, I am using regular expressions with lambda functions.
Remove Punctuations
Punctuations are the marks in English like commas, hyphens, full stops, etc. These are important for English grammar but not for text analysis. Therefore, they need to be removed:
Here, string.punctuations function contains all the punctuations and we use regular expressions to search them in the text and remove them. Finally, we still have some extra spaces present in the data. Let’s remove them:
Let’s how our text looks after cleaning:

Great! We have cleaned the text data and are just one section away from the EDA stage!
Preparing Text Data for Exploratory Data Analysis (EDA)
We have already cleaned our data and have our corpus ready, but there are still some steps left to be done before EDA. In this section, we’ll create a Document Term Matrix that we’ll later use in our analysis.
Now, you might be wondering what is a Document Term Matrix and why do we have to create one?
A Document Term Matrix provides the frequency of a word in a corpus (collection of documents), which in this case are reviews. It helps in analyzing the occurrence of words in different documents in a corpus. The following figure is an example of a document term matrix:

In this section, we’ll do the following things:
- Stopwords Removal
- Lemmatization
- Create Document Term Matrix
Stopwords are the most common words of a language like ‘I’, ‘this’, ‘is’, ‘in’ which do not add much value to the meaning of a document. These values are removed to decrease the dataset size and increase focus on meaningful words.
Lemmatization is a systematic process of reducing a token to its lemma. It uses vocabulary, word structure, part of speech tags, and grammar relations to convert a word to its base form. You can read more about stopwords removal and lemmatization in this article: NLP Essentials: Removing Stopwords and Performing Text Normalization using NLTK and spaCy in Python.
We’ll use SpaCy for the removal of stopwords and lemmatization. It is a library for advanced Natural Language Processing in Python and Cython.
We have removed stopwords and lemmatized our reviews successfully. Let’s group them according to the products:
It’s time to create a Document Term Matrix. You can read more about the document term matrix here.

Finally, we have completed all the procedures required before starting our analysis, and we have our dataset present in the exact format needed for the exploration stage.
Exploratory Data Analysis on Amazon Product Reviews using Python
Yes – it’s finally time for Exploratory Data Analysis! It is a crucial part of any data science project because that’s where you get to know more about the data. In this phase, you can reveal hidden patterns in the data and generate insights from it.
So, let’s start by looking at the common words present in the reviews for each product. For this, I will use the document term matrix created earlier with word clouds for plotting these words. Word clouds are the visual representations of the frequency of different words present in a document. It gives importance to the more frequent words which are bigger in size compared to other less frequent words.
Word clouds can be generated using the wordcloud library. So, let’s plot word clouds for each product:

Here, we can see that LOVE, USE, BUY, GREAT, and EASY are the most frequently occurring words for almost every product. This means that users are loving products from Amazon and found purchasing them a great decision. They also found them easy to use.
That’s a quick way to generate insights from text data, isn’t it?
Now, let’s say Amazon wants to dig deeper into this and wants to know which products they should improve. We can find the answer to this question by doing a sentiment analysis of the reviews for each product. Sentiment analysis is the analysis of how much a piece of text is positive and opinionated. If you want to know more about sentiment analysis, here you go: Comprehensive Hands-on Guide to Twitter Sentiment Analysis with dataset and code.
Here, in this case, checking only the polarity, i.e., how much a text is positive or negative, is sufficient. We can check the polarity of a review using the TextBlob library in Python:
Let’s take a look at some of the most positive and negative reviews from the customers:


Let’s plot polarities of reviews for each product and compare them. A bar graph is best suited for this purpose:
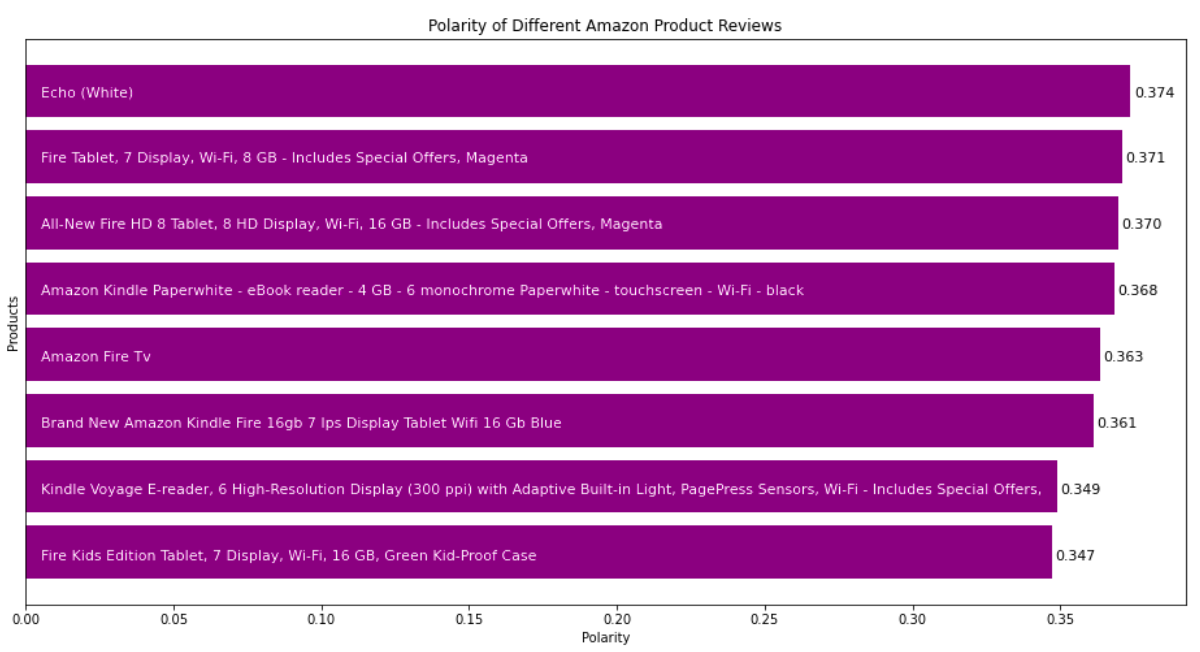
You can see that according to the polarity of reviews, Amazon needs to improve Fire Kids Edition Tablet and Kindle Voyage E-reader. Let’s also take a look at the number of reviewers who recommended a particular product. For this, we can take the percentage of reviewers and plot that:

Here, we can see that the Fire Kids Edition Tablet has the lowest recommendation percentage. It’s reviews also have the lowest polarity. So, we can say that the polarity of reviews affects the chances of a product getting recommended.
Another thing that we can look at is the readability of reviews upvoted as helpful by others. The readability of a text document can be checked using various readability indices like Flesch Reading Ease, Dale Chall Readability Score, and Gunning Fog Index.
For this, we can use the textstat library in Python. Textstat is typically used for determining readability, complexity, and grade level of a particular corpus. Each of these indices works on a different methodology for determining the readability level of a document.

There is very little difference in the Dale Chall Score and the Flesch Reading Score for helpful and not helpful reviews. But there is a considerable amount of variation in the Gunning Fog Index.
Still, we cannot tell the difference in the readability of the two. The textstat library has a solution for this as well. It provides the text_standard() function. that uses various readability checking formulas, combines the result and returns the grade of education required to understand a particular document completely.
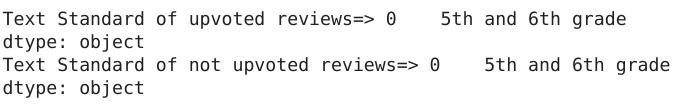
Interesting. Both upvoted and not upvoted reviews are easily understandable by anyone who has completed the 5th or 6th grade in school.
Let’s take a look at the reading time of reviews upvoted as helpful and non-helpful. An average adult reads about 250 words per minute. We can also calculate the reading time of a document using the textstat library. It provides the reading_time() function, which takes a piece of text as an argument and returns the reading time for it in seconds.

Surprisingly, the reading time of upvoted reviews is twice that of not upvoted reviews. It means that people usually find longer reviews helpful.
What’s the Conclusion from the EDA on Text Data?
Let’s take a look at the inferences drawn from the above analysis:
- Customers love products from Amazon. They find them a great purchase and easy to use
- Amazon needs to work on the Fire Kids Edition Tablet because it has the most negative reviews. It is also the least recommended product
- The majority of reviews are written in simple English and are easily understandable by anyone who has 5th or 6th grade of school
- The reading time of helpful reviews is twice that of non-helpful reviews which means people find longer reviews helpful
What’s Next?
You need to understand that there is no fixed way of doing exploratory data analysis. It is entirely dependent on the data you have, the problem statement that you have to solve, and domain knowledge. One set of procedures that work flawlessly on one data might not work on another data. The only way to master this aspect is by analyzing different datasets from various domains.
If you found this article informative, then please share it with your network and comment below with your queries and feedback. I have listed some insightful and comprehensive articles and courses related to Natural Language Processing below.
Courses:
- Introduction to Natural Language Processing
- Natural Language Processing (NLP) Using Python
- Certified Program: NLP for Beginners
Articles:
- A Comprehensive Learning Path to Understand and Master NLP in 2020
- Quick Introduction to Bag-of-Words (BoW) and TF-IDF for Creating Features from Text
- An Essential Guide to Pretrained Word Embeddings for NLP Practitioners
- A Complete List of Important Natural Language Processing Frameworks you should Know (NLP Infographic)
He is a data science aficionado, who loves diving into data and generating insights from it. He is always ready for making machines to learn through code and writing technical blogs. His areas of interest include Machine Learning and Natural Language Processing still open for something new and exciting.


Great article, I am a data analyst and trying to get hands on Python. Loved the simplicity and direct approach to a problem. Thank you
You're welcome, Viquar Syed. I am glad you liked it.
variables like product_polarity_sorted, recommend_percentage, etc. are not defined, so it's giving error while running
Hi Prasun Neogy, thank you for reading the article and bringing this to my attention. I have updated the code.
Thank you for a great article with example code. The provided code appears to use some variables that are not defined (i.e. "product_polarity_sorted" and "recommend_percentage"). Unless these have been deliberately left out as exercises for the reader, it would be nice to see the missing code too :-) Thanks again!
Please ignore this comment. My browser appears to be hiding the first line in both the code panels that define those variables. Apologies for the confusion, and thanks for the article again!