KNNImputer: A robust way to impute missing values (using Scikit-Learn)
Overview
- Learn to use KNNimputer to impute missing values in data
- Understand the missing value and its types
Introduction
KNNImputer by scikit-learn is a widely used method to impute missing values. It is widely being observed as a replacement for traditional imputation techniques.
In today’s world, data is being collected from a number of sources and is used for analyzing, generating insights, validating theories, and whatnot. This data collected from different resources may often have some information missing. This may be due to a problem in the data collection or extraction process that could be a human error.
Dealing with these missing values, thus becomes an important step in data preprocessing. The choice of method of imputation is crucial since it can significantly impact one’s work.

Most statistical and machine learning algorithms work on complete observations of a dataset. As a result, it becomes essential to deal with missing information. A handful of literature in statistics deals with the source of missing values and ways to overcome the issue. The best way is to impute these missing observations with an estimated value.
In this article, we introduce a guide to impute missing values in a dataset using values of observations for neighboring data points. For this, we use the very popular KNNImputer by scikit-learn k-Nearest Neighbors Algorithm.
Note: This article briefly discusses the concept of kNN and the major focus will be on missing values imputation using kNN. If you want to understand how the kNN algorithm works, you can check out our free course:
Table of Contents
- The problem of degrees of freedom
- Missing Value Patterns
- A shared sense of identity (Essence of kNN algorithm)
- Distance calculation in the presence of missing values
- Imputation Approach with KNNImputer
The Problem of Degrees of Freedom
Missing values in a dataset can be a hornet’s nest for any data scientist. Variables with missing values can be a non-trivial problem as there is no easy way out to deal with them.
Generally, if the proportion of missing observations in data is small relative to the total number of observations, we can simply remove those observations. However, this is not the most often case. Deleting the rows containing missing values may lead to parting away with useful information or patterns.
In statistical terms, this leads to reduced degrees of freedom as the number of independent pieces of information goes down.
Missing Value Patterns
The absence of values is a cause of concern for real-life datasets. When collecting observations about a variable, missing values can occur due to reasons as diverse as –
- an error in machinery/equipment
- error on part of the researcher
- unavailable respondents
- accidental deletion of observations
- forgetfulness on part of the respondents
- error in accounting, etc.
Frameworks for reasons and patterns of missing values have been developed (Little & Rubin (2002), Salgado et. al. (2016)) that can aid the type of imputation approach followed. Types of missing values can generally be classified as:
-
Missing Completely at Random (MCAR)
This happens when the missing values have no hidden dependency on any other variable or any characteristic of observations. If a doctor forgets to record the age of every tenth patient entering an ICU, the presence of missing value would not depend on the characteristic of the patients.
-
Missing at Random (MAR)
In this case, the probability of missing value depends on the characteristics of observable data. In survey data, high-income respondents are less likely to inform the researcher about the number of properties owned. The missing value for the variable number of properties owned will depend on the income variable.
-
Missing Not at Random (MNAR)
This happens when the missing values depend on both characteristics of the data and also on missing values. In this case, determining the mechanism of the generation of missing value is difficult. For example, missing values for a variable like blood pressure may partially depend on the values of blood pressure as patients who have low blood pressure are less likely to get their blood pressure checked at frequently.
A shared sense of identity (Essence of kNN algorithm)
Univariate methods used for missing value imputation are simplistic ways of estimating the value and may not provide an accurate picture always. For example, let us say we have variables related to the density of cars on road and levels of pollutants in the air and there are few observations that are missing for the level of pollutants, imputing the level of pollutants by mean/median level of pollutants may not necessarily be an appropriate strategy.
In such scenarios, algorithms like k-Nearest Neighbors (kNN) can help to impute the values of missing data. Sociologists and community researchers suggest that human beings live in a community because neighbors generate a feeling of security and safety, attachment to community, and relationships that bring out a community identity through participation in various activities.
A similar imputation methodology that works on data is k-Nearest Neighbours (kNN) that identifies the neighboring points through a measure of distance and the missing values can be estimated using completed values of neighboring observations.
Example-
Suppose, you run out of stock of necessary food items in your house, and due to the lockdown none of the nearby stores are open. Therefore, you ask your neighbors for help and you will end up cooking whatever they supply to you. This is an example of imputation from a 1-nearest neighbor (taking the help of your closest neighbor).
Instead, if you identify 3 neighbors from whom you ask for help and choose to combine the items supplied by 3 of your nearest neighbors, that is an example of imputation from 3-nearest neighbors. Similarly, missing values in datasets can be imputed with the help of values of observations from the k-Nearest Neighbours in your dataset. Neighboring points for a dataset are identified by certain distance metrics, generally euclidean distance.
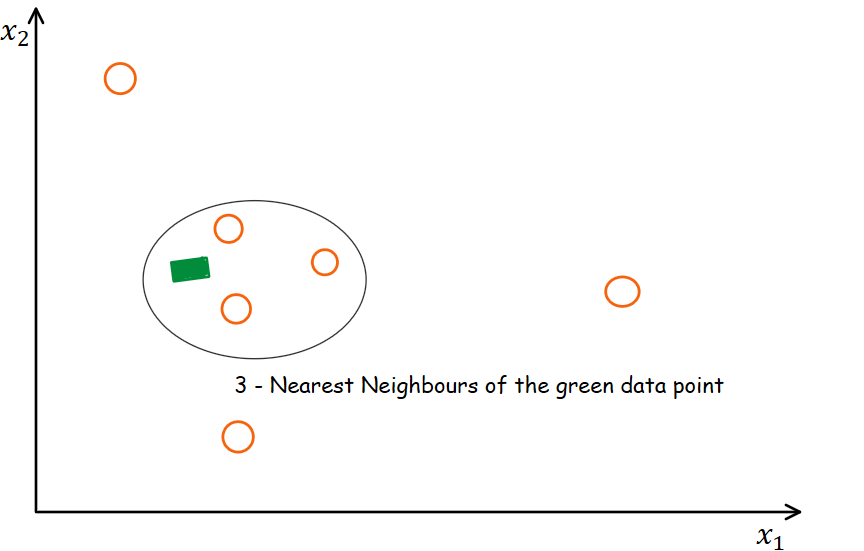
Consider the above diagram that represents the working of kNN. In this case, the oval area represents the neighboring points of the green squared data point. We use a measure of distance to identify the neighbors. For a detailed introduction to kNN and distance measure calculations, you can go through the following blog-
The idea in kNN methods is to identify ‘k’ samples in the dataset that are similar or close in the space. Then we use these ‘k’ samples to estimate the value of the missing data points. Each sample’s missing values are imputed using the mean value of the ‘k’-neighbors found in the dataset.
Distance calculation in the presence of missing values
Let’s look at an example to understand this. Consider a pair of observations in a two-dimensional space (2,0), (2,2), (3,3). The graphical representation of these points are shown below:
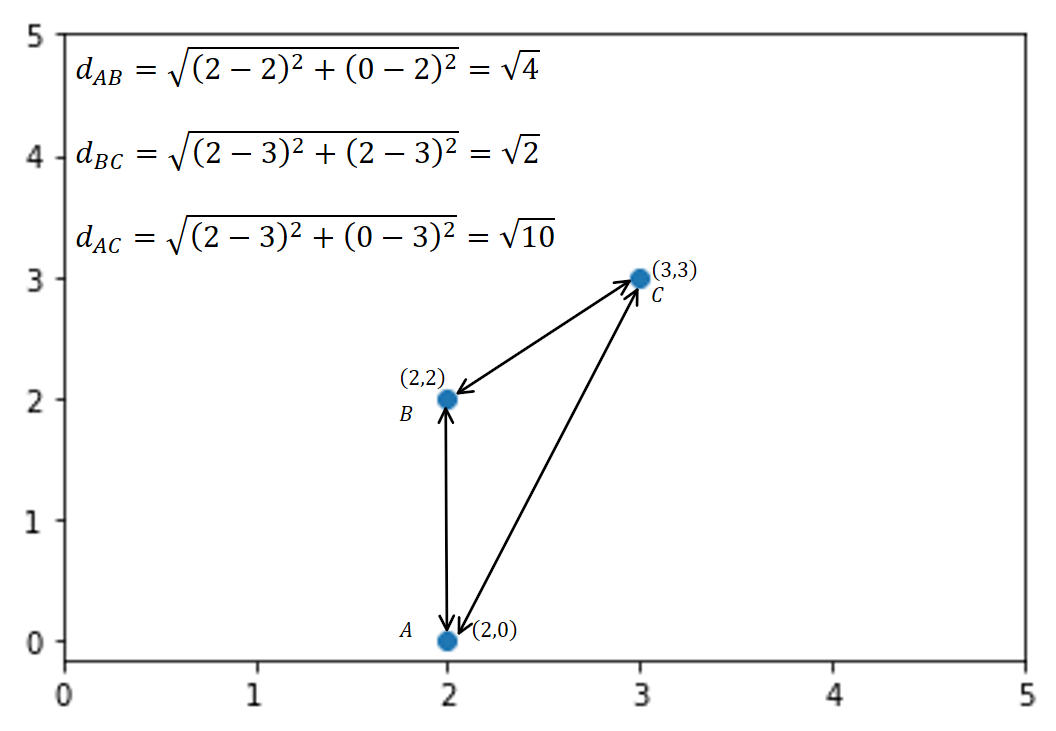
The points with the shortest distance based on Euclidean distances are considered to be the nearest neighbors. For example, 1-nearest neighbor to Point A is point B. For point B, the 1-nearest neighbor is point C.
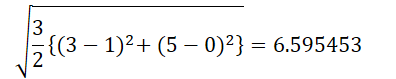
In the presence of missing coordinates, the Euclidean distance is calculated by ignoring the missing values and scaling up the weight of the non-missing coordinates.
where,
For example, the Euclidean distances between two points (3, NA, 5) and (1, 0, 0) is:
Now we use the sklearn nan_euclidean_distances function from the sklearn package pairwise metric module to calculate the distances between two points with missing values.
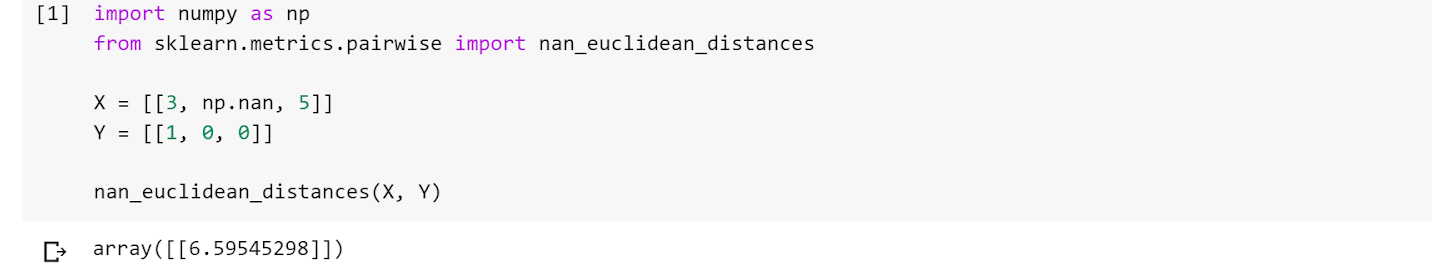
Even though nan_euclidean_distances works on two 1-dimensional arrays supplied by X and Y arguments but it can also work on a single array having multiple dimensions.
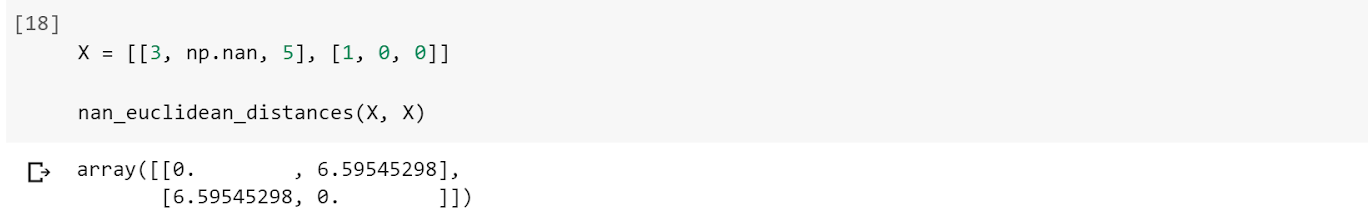
As a result, the distance matrix is a 2 X 2 – matrix which represents the Euclidean distance between pairs of observations. Further, The diagonal elements of the resultant matrix are 0 as it represents the distance between individual observations with themselves.
You can read about other distance metrics in this article.
Try this code out in the live coding window below:
Imputation Approach with KNNImputer
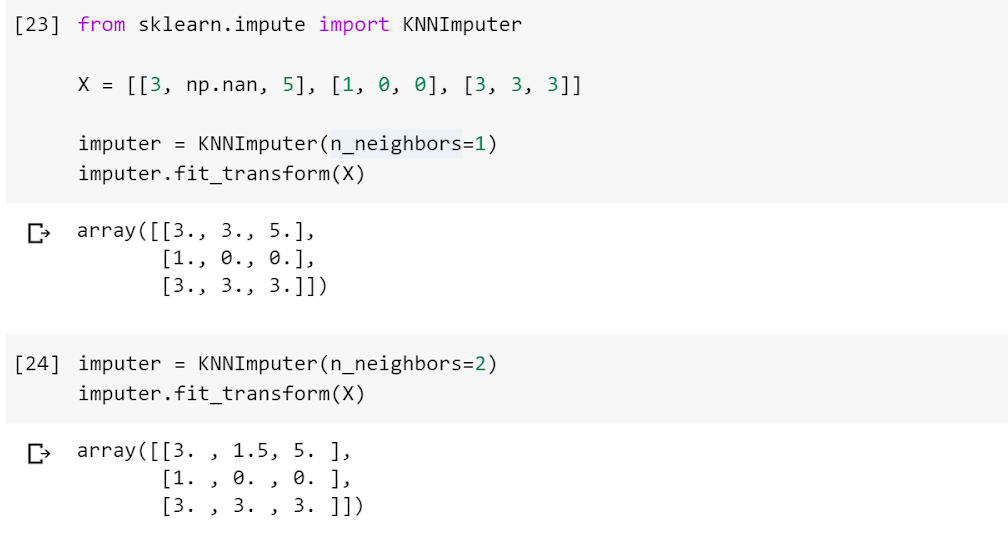
We will use the KNNImputer function from the impute module of the sklearn. KNNImputer helps to impute missing values present in the observations by finding the nearest neighbors with the Euclidean distance matrix.
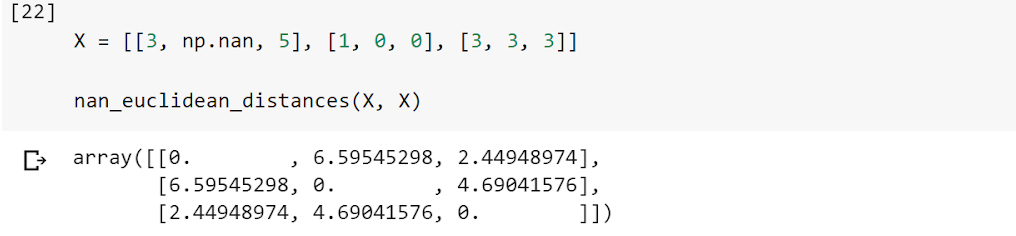
In this case, the code above shows that observation 1 (3, NA, 5) and observation 3 (3, 3, 3) are closest in terms of distances (~2.45). Therefore, imputing the missing value in observation 1 (3, NA, 5) with a 1-nearest neighbor will give an estimate of 3 which is the same as that of the second dimension of observation 3 (3, 3, 3).
Further, imputing the missing value in observation 1 (3, NA, 5) with a 2-nearest neighbor will give an estimate of 1.5 which is the same as the mean value of the second dimension of observations 2 and 3, i.e. (1, 0, 0) and (3, 3, 3), respectively.
Till now, we discussed missing value treatment using kNNImputer for continuous variables. Below, we create a data frame with missing values in categorical variables. For imputing missing values in categorical variables, we have to encode the categorical values into numeric values as kNNImputer works only for numeric variables. We can perform this using a mapping of categories to numeric variables.


End Notes
In this article, we learned about the missing value, its reasons, patterns, and how you can use KNNImputer to impute missing values. Additionally, you may go through these resources to understand the concept of KNN better-
- A Practical Introduction to K-Nearest Neighbors Algorithm for Regression (with Python code).
- K-Nearest Neighbors (KNN) Algorithm in Python and R
To summarize, the choice of k to impute the missing values using the kNN algorithm can be a bone of contention. Furthermore, research suggests that it is imperative to test the model using cross-validation after performing imputation with different values of k. Although the imputation of missing values is a continuously evolving field of study, kNN act as a simple and effective strategy.
Let us know if you have any queries in the comments below.
Kaushik is a data science professional and a trainer with more than 7 years of experience working in the consulting domain and around 3 years of teaching experience.


This makes a lot more intuitive sense for imputation, thanks for sharing! Would it be better to normalize each parameter with its average before computing the distance? PS: Loved the analogy of human being living in a community :)
Thanks, Nikhar. Yes, it is always a good strategy to normalize/standardize each parameter if they belong to different measurement scales or different data types.
One of the best blogs that i have read till now. Thanks for your contribution in sharing such a useful information. Waiting for your further updates.
If we have more than 2 categories label in a categorical columns , we shall encode it in form of 0,1,2,3 . Will this not effect our imputation Also how can we convert back the numerical values to string values after imputation
Best explaination and the best example for KNN imputer.