The data science lifecycle is designed for big data issues and data science projects. Generally, the data science project consists of seven steps which are problem definition, data collection, data preparation, data exploration, data modeling, model evaluation and model deployment. This article goes through the data science lifecycle in order to build a web application for heart disease classification.
If you would like to look at a specific step in the lifecycle, you can read it without looking deeply at the other steps.
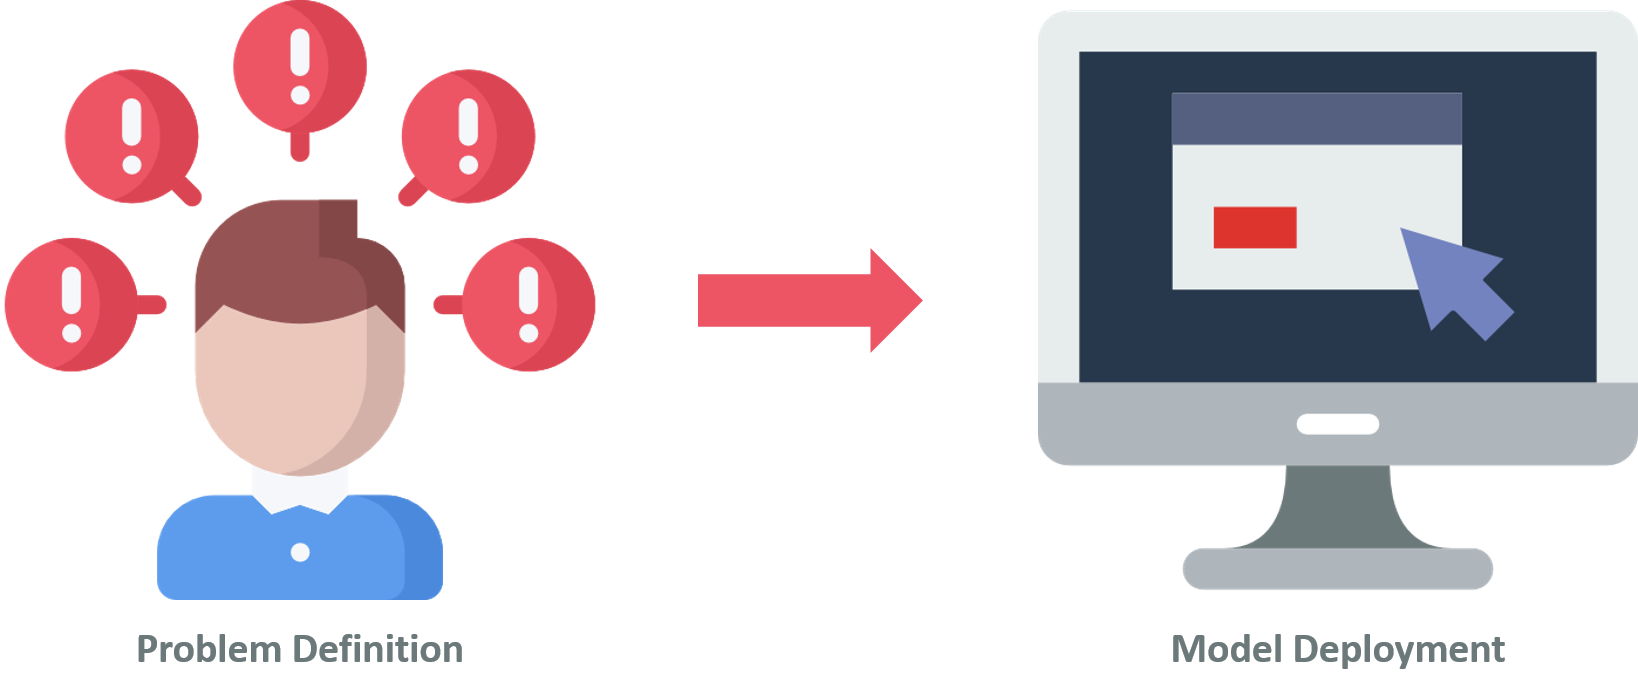
Problem Definition
Clinical decisions are often made based on doctors’ experience and intuition rather than on the knowledge-rich hidden in the data. This leads to errors and many costs that affect the quality of medical services. Using analytic tools and data modeling can help in enhancing the clinical decisions. Thus, the goal here is to build a web application to help doctors in diagnosing heart diseases. The full code of is available in my GitHub repository.
Data Collection
I collected the heart disease dataset from UCI ML. The dataset has the following 14 attributes:
- age: age in years.
- sex: sex (1=male; 0=female).
- cp: chest pain type (0 = typical angina; 1 = atypical angina; 2 = non-anginal pain; 3: asymptomatic).
- trestbps: resting blood pressure in mm Hg on admission to the hospital.
- chol: serum cholesterol in mg/dl.
- fbs: fasting blood sugar > 120 mg/dl (1=true; 0=false).
- restecg: resting electrocardiographic results ( 0=normal; 1=having ST-T wave abnormality; 2=probable or definite left ventricular hypertrophy).
- thalach: maximum heart rate achieved.
- exang: exercise-induced angina (1=yes; 0=no).
- oldpeak: ST depression induced by exercise relative to rest.
- slope: the slope of the peak exercise ST segment (0=upsloping; 1=flat; 2=downsloping).
- ca: number of major vessels (0–3) colored by fluorosopy.
- thal: thalassemia (3=normal; 6=fixed defect; 7=reversable defect).
- target: heart disease (1=no, 2=yes).
Data Preparation and Exploration
Here are the top 5rows of the dataset
Python Code:
import pandas as pd

df = pd.read_csv('heart.csv')

print(df.head())
The header of the heart disease datase
From the first look, the dataset contains 14 columns, 5 of them contain numerical values and 9 of them contain categorical values.
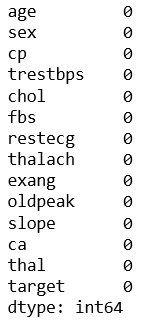
The dataset is clean and contains all the information needed for each variable. By using info(), describe(), isnull() functions, no errors, missing values, and inconsistencies values are detected.
#Check null values
df.isnull().sum()
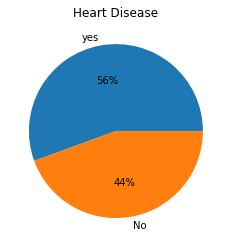
By checking the percentage of the persons with and without heart diseases, it was found that 56% of the persons in the dataset have heart disease. So, the dataset is relatively balanced.
Attributes Correlation
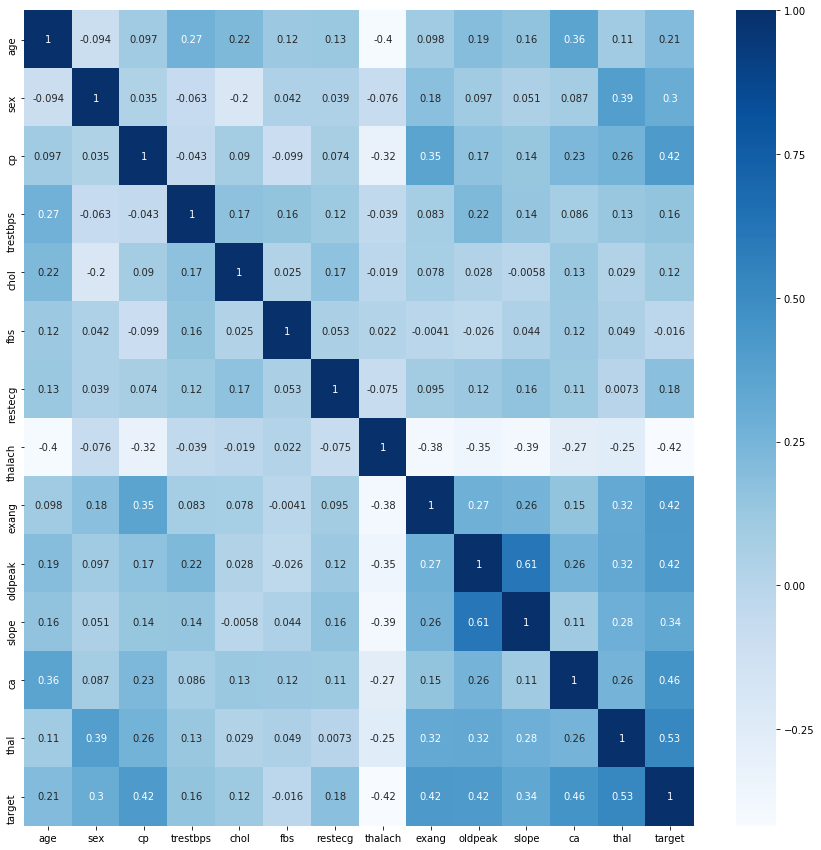
This heatmap shows the correlations between the dataset attributes, and how the attributes interact with each other. From the heatmap, we can observe that the chest pain type (cp), exercise-induced angina (exang), ST depression induced by exercise relative to rest (oldpeak), the slope of the peak exercise ST segment (slope), number of major vessels (0–3) colored by flourosopy (ca) and thalassemia (thal) are highly correlated with the heart disease (target). We observe also that there is an inverse proportion between heart disease and maximum heart rate (thalch).
Moreover, we can see that the age is correlated with number of major vessels (0–3) colored by flourosopy (ca) and maximum heart rate (thalch). There is also a relation between ST depression induced by exercise relative to rest (oldpeak) and the slope of the peak exercise ST segment (slope). Moreover, there is a relation between chest pain type (cp) and exercise-induced angina (exang).
Next, we will analyze these correlations between these features further.
1. Age and Maximum Heart Rate
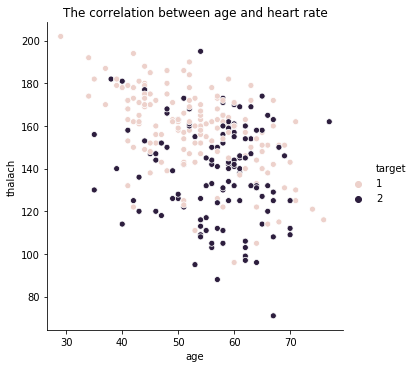
Heart disease is arising frequently in older people, and the max heart rates are lower for old people with heart disease.
2. Chest Pain
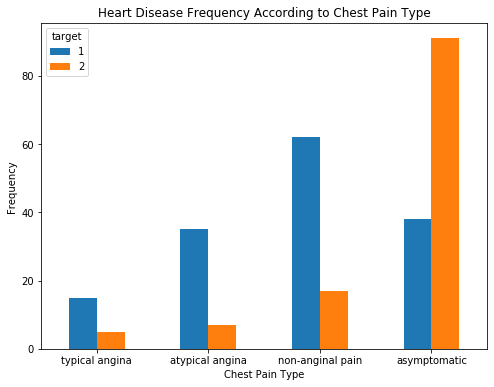
There are four types of chest pain: typical angina, atypical angina, non-anginal pain, and asymptomatic. Most of the heart disease patients are found to have asymptomatic chest pain.
2. Chest Pain and Exercise-Induced Angina
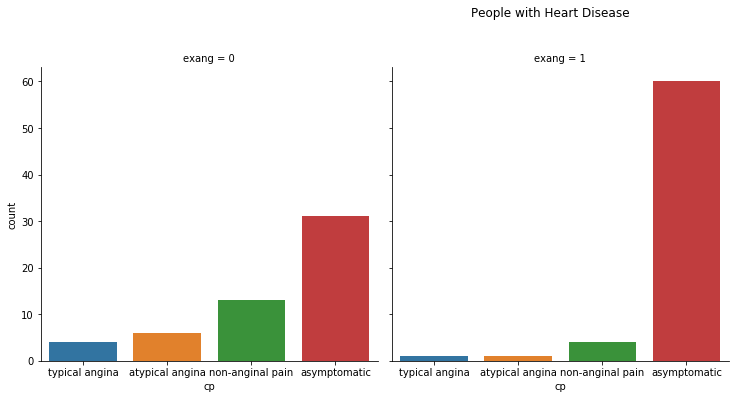
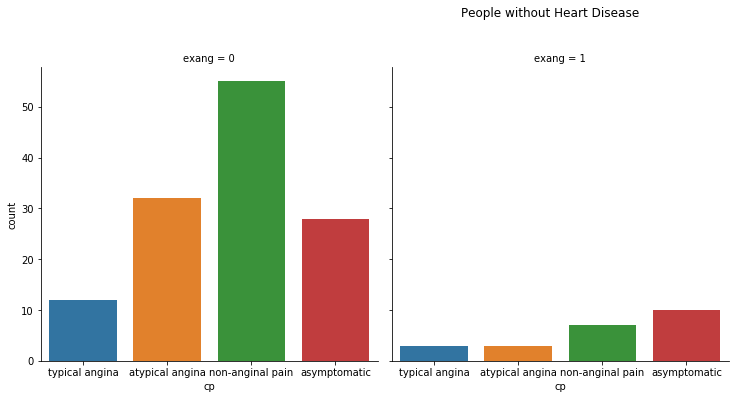
The people who have exercise-induced angina; they usually suffer from asymptomatic chest pain, and they are more likely to have heart disease.
3. Thalassemia
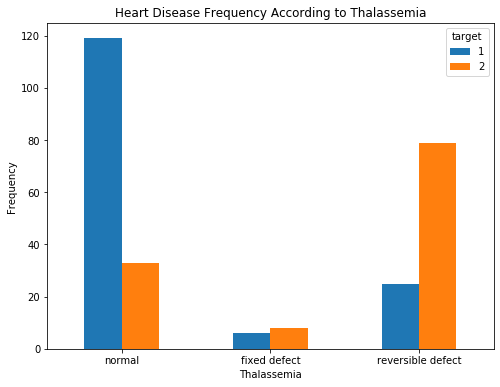
People with reversible defects are likely to have heart disease.
4. ST depression and the Slope of the Peak Exercise ST Segment.
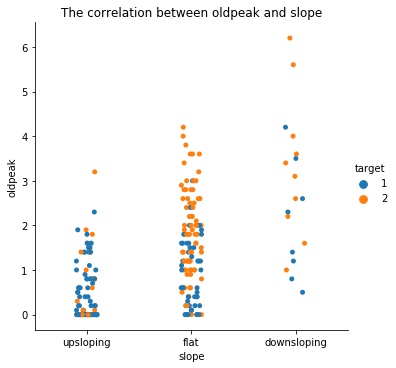
The people who have downsloping ST segment have higher values of ST depression and more chance to be infected with heart disease. The greater the ST depression, the greater the chance of disease.
5. Age and Number of Major Vessels (0–3) Colored by Flourosopy.
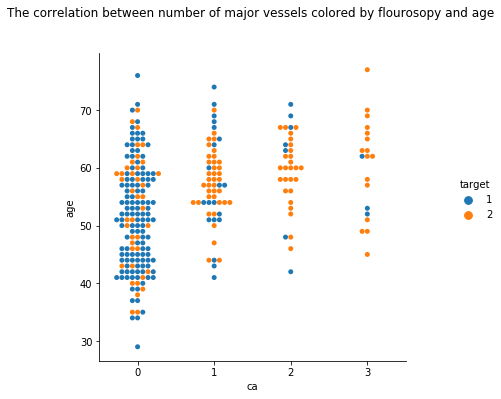
Most of the heart disease patients are old and they have one or more major vessels colored by Flourosopy.
Data Modeling
Let’s create the machine learning model. We are trying to predict whether a person has heart disease. We will use the ‘target’ column as the class, and all the other columns as features for the model.
# Initialize data and target
target = df[‘target’]
features = df.drop([‘target’], axis = 1)
– Data Splitting
We will divide the data into a training set and test set. 80% of the data will be for training and 20% for testing.
# Split the data into training set and testing set
X_train, X_test, y_train, y_test = train_test_split(features, target, test_size = 0.2, random_state = 0)
– Machine Learning Model
Here, we will try the below machine learning algorithms then we will select the best one based on its classification report.
- Support Vector Machine
- Random Forest
- Ada Boost
- Gradient Boosting
The following function for training and evaluating the classifiers.
def fit_eval_model(model, train_features, y_train, test_features, y_test):    results = {}    # Train the model
    model.fit(train_features, y_train)    # Test the model
    train_predicted = model.predict(train_features)
    test_predicted = model.predict(test_features)    # Classification report and Confusion Matrix
    results[‘classification_report’] = classification_report(y_test,    test_predicted)
    results[‘confusion_matrix’] = confusion_matrix(y_test, test_predicted)    return results
Initialize models, train and evaluate.
# Initialize the models
sv = SVC(random_state = 1)
rf = RandomForestClassifier(random_state = 1)
ab = AdaBoostClassifier(random_state = 1)
gb = GradientBoostingClassifier(random_state = 1)# Fit and evaluate models
results = {}
for cls in [sv, rf, ab, gb]:
    cls_name = cls.__class__.__name__
    results[cls_name] = {}
    results[cls_name] = fit_eval_model(cls, X_train, y_train, X_test, y_test)
Now, we will print the evaluation results.
# Print classifiers results
for result in results:
    print (result)
    print()for i in results[result]:
    print (i, ‘:’)
    print(results[result][i])
    print()
    print (‘ — — -’)
    print()
The results are below:
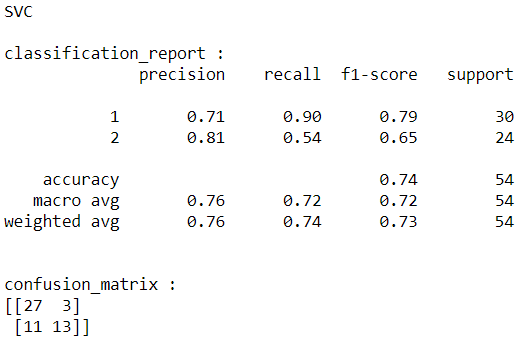
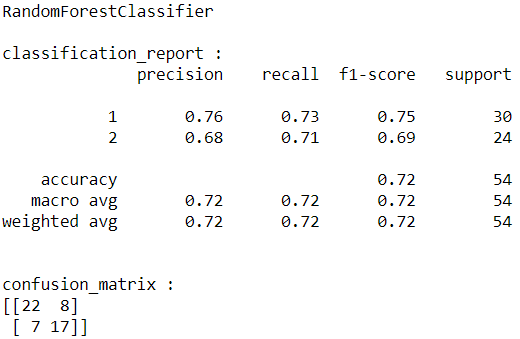
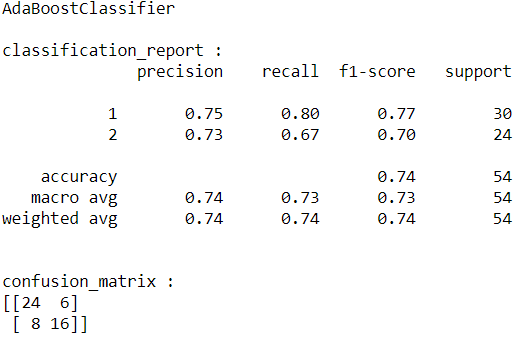
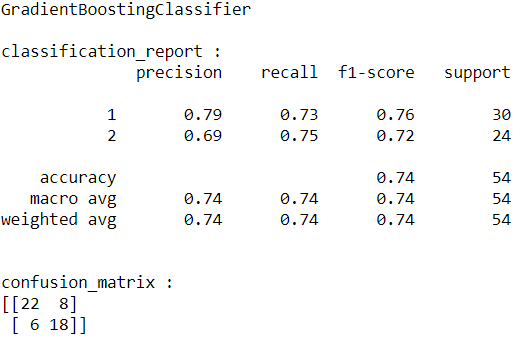
From the above results, the best model is Gradient Boosting. So, I will save this model to use it for web applications.
– Save the Prediction Model
Now, we will pickle the model so that it can be saved on disk.
# Save the model as serialized object pickle
with open(‘model.pkl’, ‘wb’) as file:
pickle.dump(gb, file)
Model Deployment
It is time to start deploying and building the web application using Flask web application framework. For the web app, we have to create:
1. Web app python code (API) to load the model, get user input from the HTML template, make the prediction, and return the result.
2. An HTML template for the front end to allow the user to input heart disease symptoms of the patient and display if the patient has heart disease or not.
The structure of the files is like the following:
/
├── model.pkl
├── heart_disease_app.py
├── templates/
 └── Heart Disease Classifier.html
Web App Python Code
You can find the full code of the web app here.
As a first step, we have to import the necessary libraries.
import numpy as np
import pickle
from flask import Flask, request, render_template
Then, we create app object.
# Create application
app = Flask(__name__)
After that, we need to load the saved model model.pkl in the app.
# Load machine learning model
model = pickle.load(open(‘model.pkl’, ‘rb’))
After that home() function is called when the root endpoint ‘/’ is hit. The function redirects to the home page Heart Disease Classifier.html of the website.
# Bind home function to URL
@app.route(‘/’)
def home():
    return render_template(‘Heart Disease Classifier.html’)
Now, create predict() function for the endpoint ‘/predict’. The function is defined as this endpoint with POST method. When the user submits the form, the API receives a POST request, the API extracts all data from the form using flask.request.form function. Then, the API uses the model to predict the result. Finally, the function renders the Heart Disease Classifier.html template and returns the result.
# Bind predict function to URL
@app.route(‘/predict’, methods =[‘POST’])
def predict():

    # Put all form entries values in a list
    features = [float(i) for i in request.form.values()]
    # Convert features to array
    array_features = [np.array(features)]
    # Predict features
    prediction = model.predict(array_features)

    output = prediction

    # Check the output values and retrieve the result with html tag based on the value
 if output == 1:
    return render_template(‘Heart Disease Classifier.html’,
 result = ‘The patient is not likely to have heart disease!’)
 else:
    return render_template(‘Heart Disease Classifier.html’,
 result = ‘The patient is likely to have heart disease!’)
Finally, start the flask server and run our web page locally on the computer by calling app.run() and then enter http://localhost:5000 on the browser.
if __name__ == ‘__main__’:
#Run the application
app.run()
HTML Template
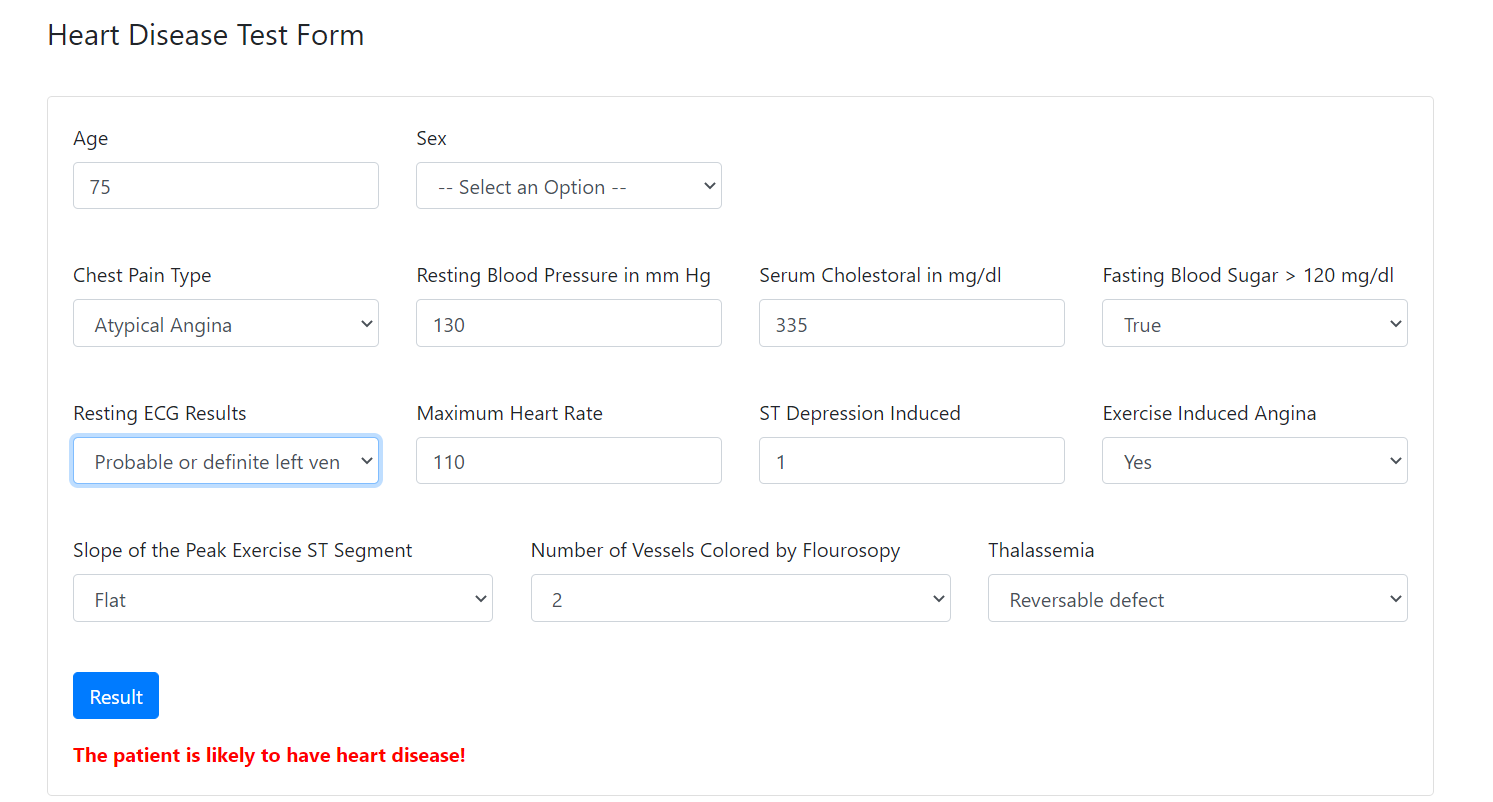
The following figure presents the HTML form. You can find the code here.
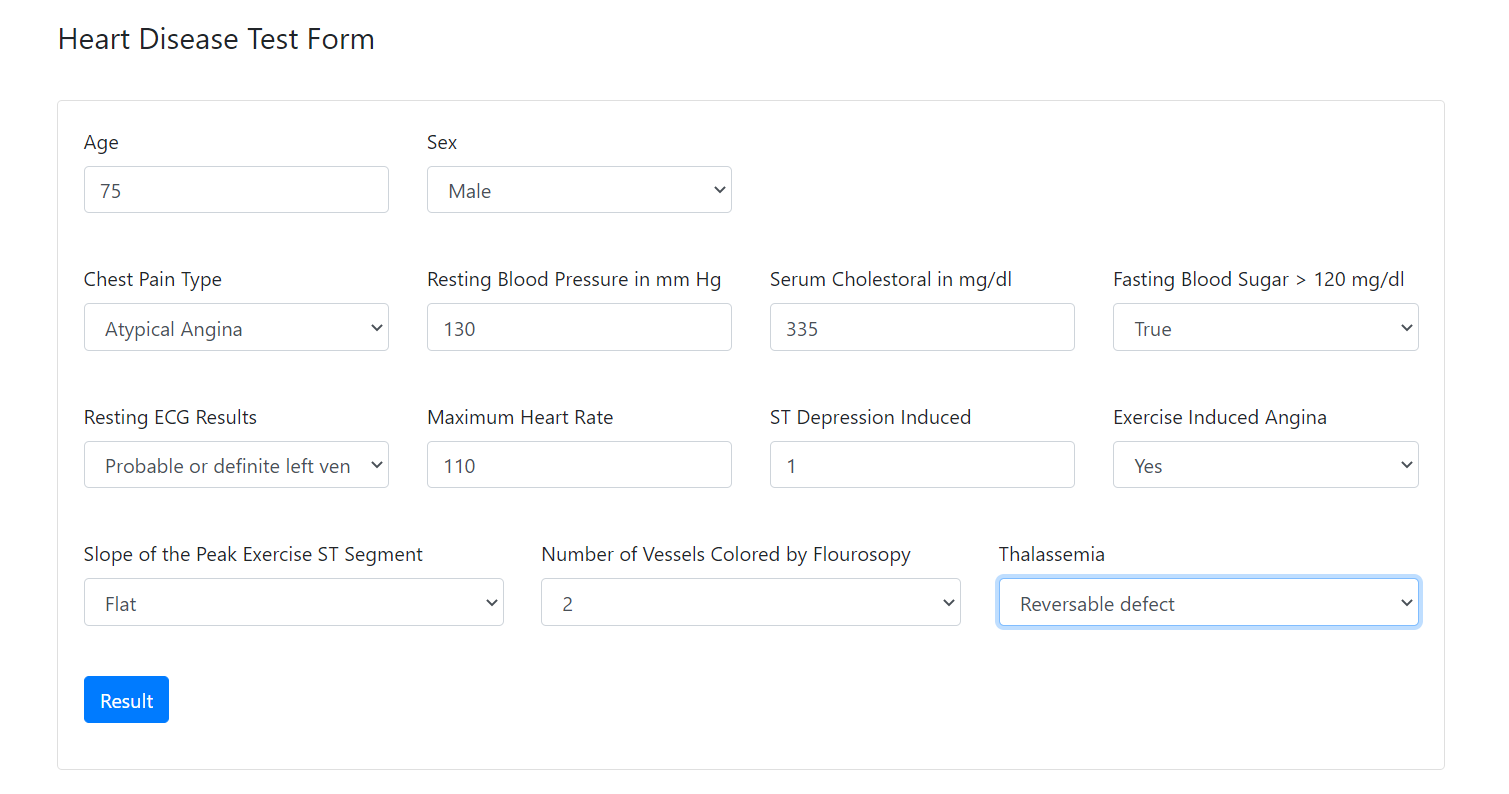
The form has 13 inputs for the 13 features and a button. The button sends POST request to the/predict endpoint with the input data. In the form tag, the action attribute calls predict function when the form is submitted.
<form action = “{{url_for(‘predict’)}}” method =”POST” >
Finally, the HTML page presents the stored result in the result parameter.
<strong style="color:red">{{result}}</strong>
Summary
In this article, you learned how to create a web application for prediction from scratch. Firstly, we started with the problem definition and data collection. Then, we worked on data preparation, data exploration, data modeling, and model evaluation. Finally, we deployed the model using a flask.
Now, it is time to practice and apply what you learn in this article. Define a problem, search for a dataset on the Internet, and then go through the other steps of the data science lifecycle.
About the Author
Nada Alay
I am working in the data analytics field and passionate about data science, machine learning, and scientific research.


