This article was published as a part of the Data Science Blogathon.
What is A/B testing?
A/B Testing(split testing) is basically the process of comparing the 2 versions of discount offers, emails, web pages and, other marketing tools and then measuring the difference in performance. In the generic sense, an improvement of existing design and measure the impact of it.
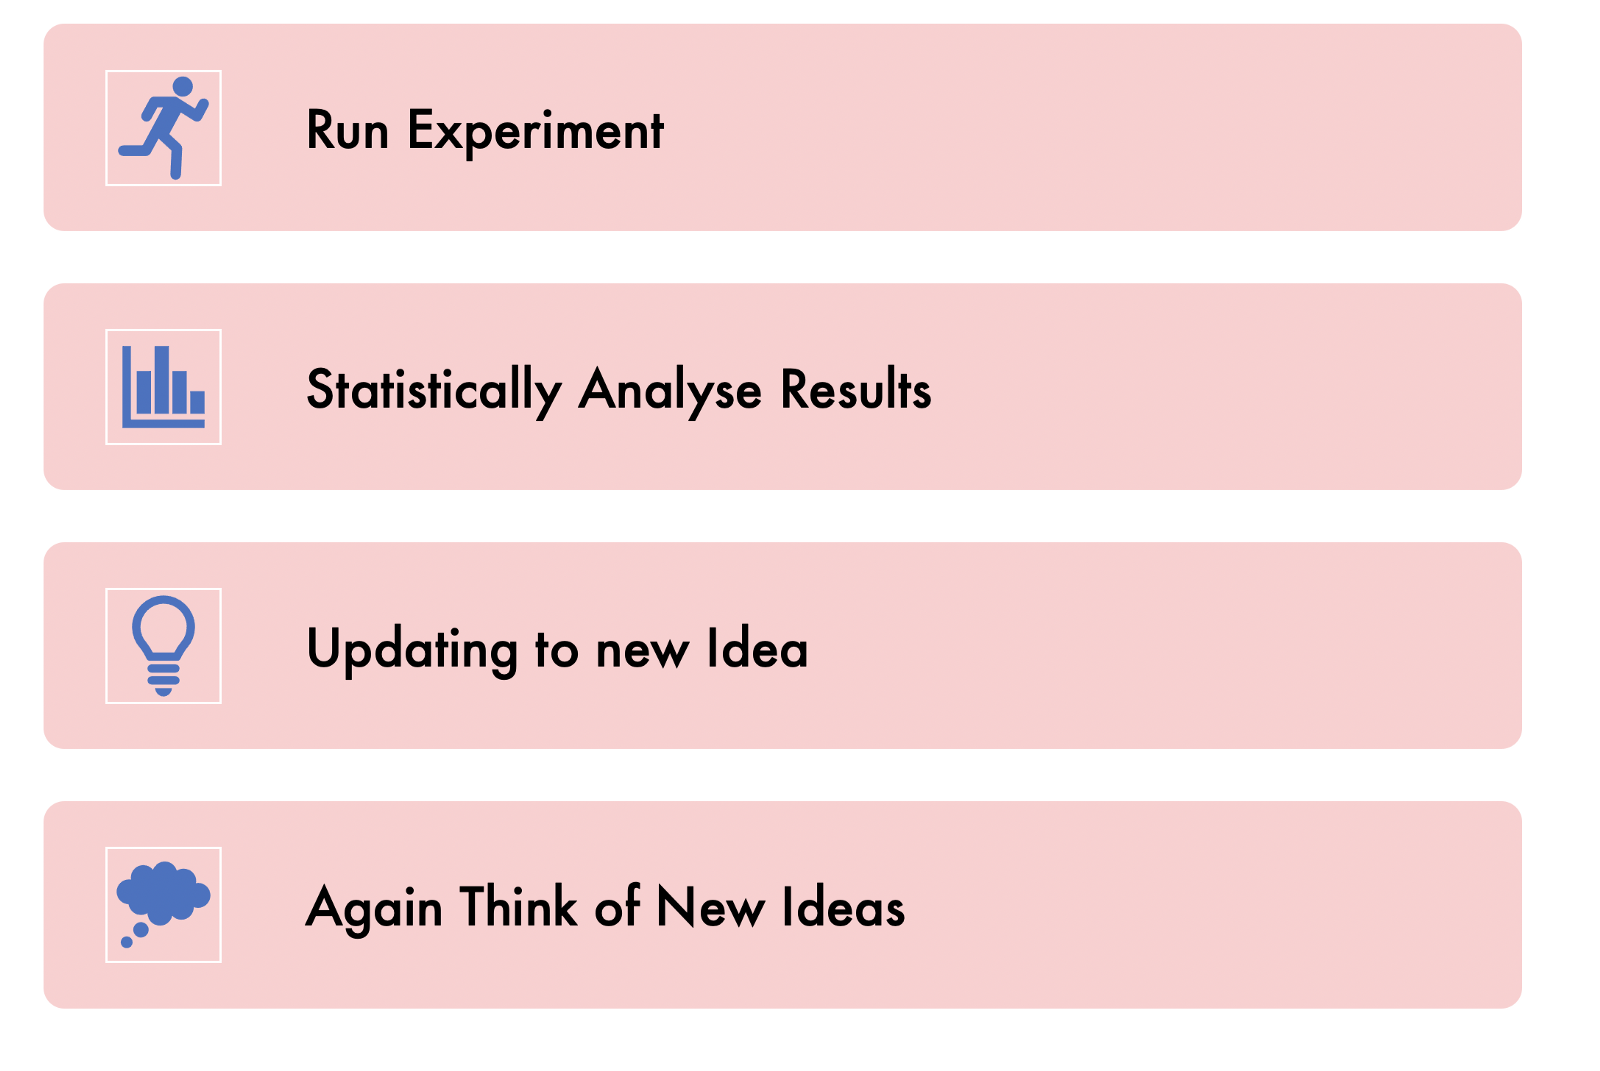
A/B Testing is something that is not a one-time activity, Test >> Learn >> again Test
Is it impactful? An excellent example from the book — “Trustworthy Online Controlled Experiments: A Practical Guide to A/B Testing” :
“An employee working on Bing suggested some changes on ad headlines display. The idea was very simple, he suggested lengthening the title line of ads by combining it with the text from the first line below the title. That idea was implemented on real users, randomly showing some of them the new title layout and others the old one. User interactions with the website were recorded, including the clicks and revenue generated from them. This is an example of an A/B test, the simplest type of controlled experiment that compares the 2 variants: A and B, Control or Experiment.
After few hours of starting the test, a revenue-to-high alert triggered, that something was wrong with the experiment. The new layout was generating too much money from the ads. For this experiment revenue increase was valid. ”
But small changes also can have a big impact. If the experiment is successful then defiantly it leads to a big impact in long term.
What will be the first step for measuring success?
PART-1: Metric of Interest
Design or pickup the metric of interest, it should be any metric that is directly correlated with experimentation. For example, a fast-food retail chain wants to test a new discount offer is better than the existing offer. Then metric of interest should be : (1) Sale_per_customer (2)Frequency
So bit more about data, 2 key tables(hypothetical data):
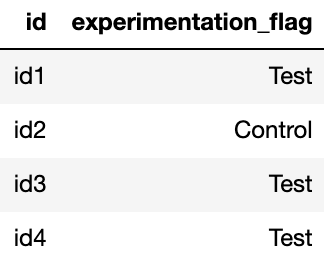
a) Experimentation Table — Where customers are tagged to “Test” & “Control” groups & their broad categories.
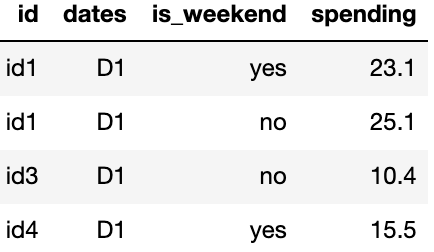
b) Transaction Table — Customer purchase data, broken down by different dates.
From these above two base tables, I created a derived table which gives me customer wise pre & post-KPI’s aggregate, and the data looks like this-
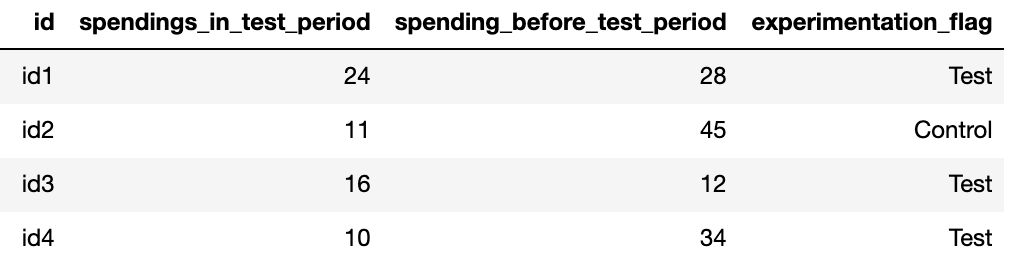
To create the above table you should know the before-test-period-dates (date range before the Test launch date) & in-test-period-dates(live test period dates).
Now the most important question, what is an ideal metric for the measurement, so in a very simple way key features of a metric of interest should be:
- Measurable
- Computable
- Sensitive
This blog will concentrate on sales_per_customer KPI. As it inherits all the qualities of a perfect Metric of Interest.
If you are dealing with a lot of metrics, ideally you want to combine them into a single metric, which you called Aggregated Metric(called North Star Metric), and then measure the impact of delta for that particular metric to declare the success & failure of experimentation.
PART-2: Pre-experiment analysis
So when we are pretty much got the desired metric, now time for some exploration to understand few questions like:
- What is my base sales per customer?
- What is the average frequency of customers in stores?
- What are average order values?
EDA will be the answer and believe me it is the most powerful tool that exists. It helps for the deduction.
A simple time-based line plot is capable of showing the current status of measures like mean, median, the standard deviation of all the major KPIs, and these base values are very much helpful for understanding Minimum Detectable changes that we can expect from the experiment.
Minimum Detectable Effect (MDE): MDE represents the relative minimum improvement over a baseline that you are expecting in an experiment, with some degree of statistical significance. So we intend to compare the means/medians/std.deviation of both the control(no treatment) and experimental group. So for that, we have to do Hypothesis testing
Hypothesis testing: In hypothesis testing, we are considering 2 scenarios:
Null Hypothesis: No statistical significance between control and experiment group.
Alternate Hypothesis: There is a significant difference between the control and experiment groups.
Power & Significance: Now the question do you have enough samples to run our experiment. While calculating sample size estimation these errors should be avoided:
- Type-I Error, significance level should be specified while calculating sample size.
- Type-II Error, the sample size should be large, and as a standard practice set the power at 0.8 or 0.9.
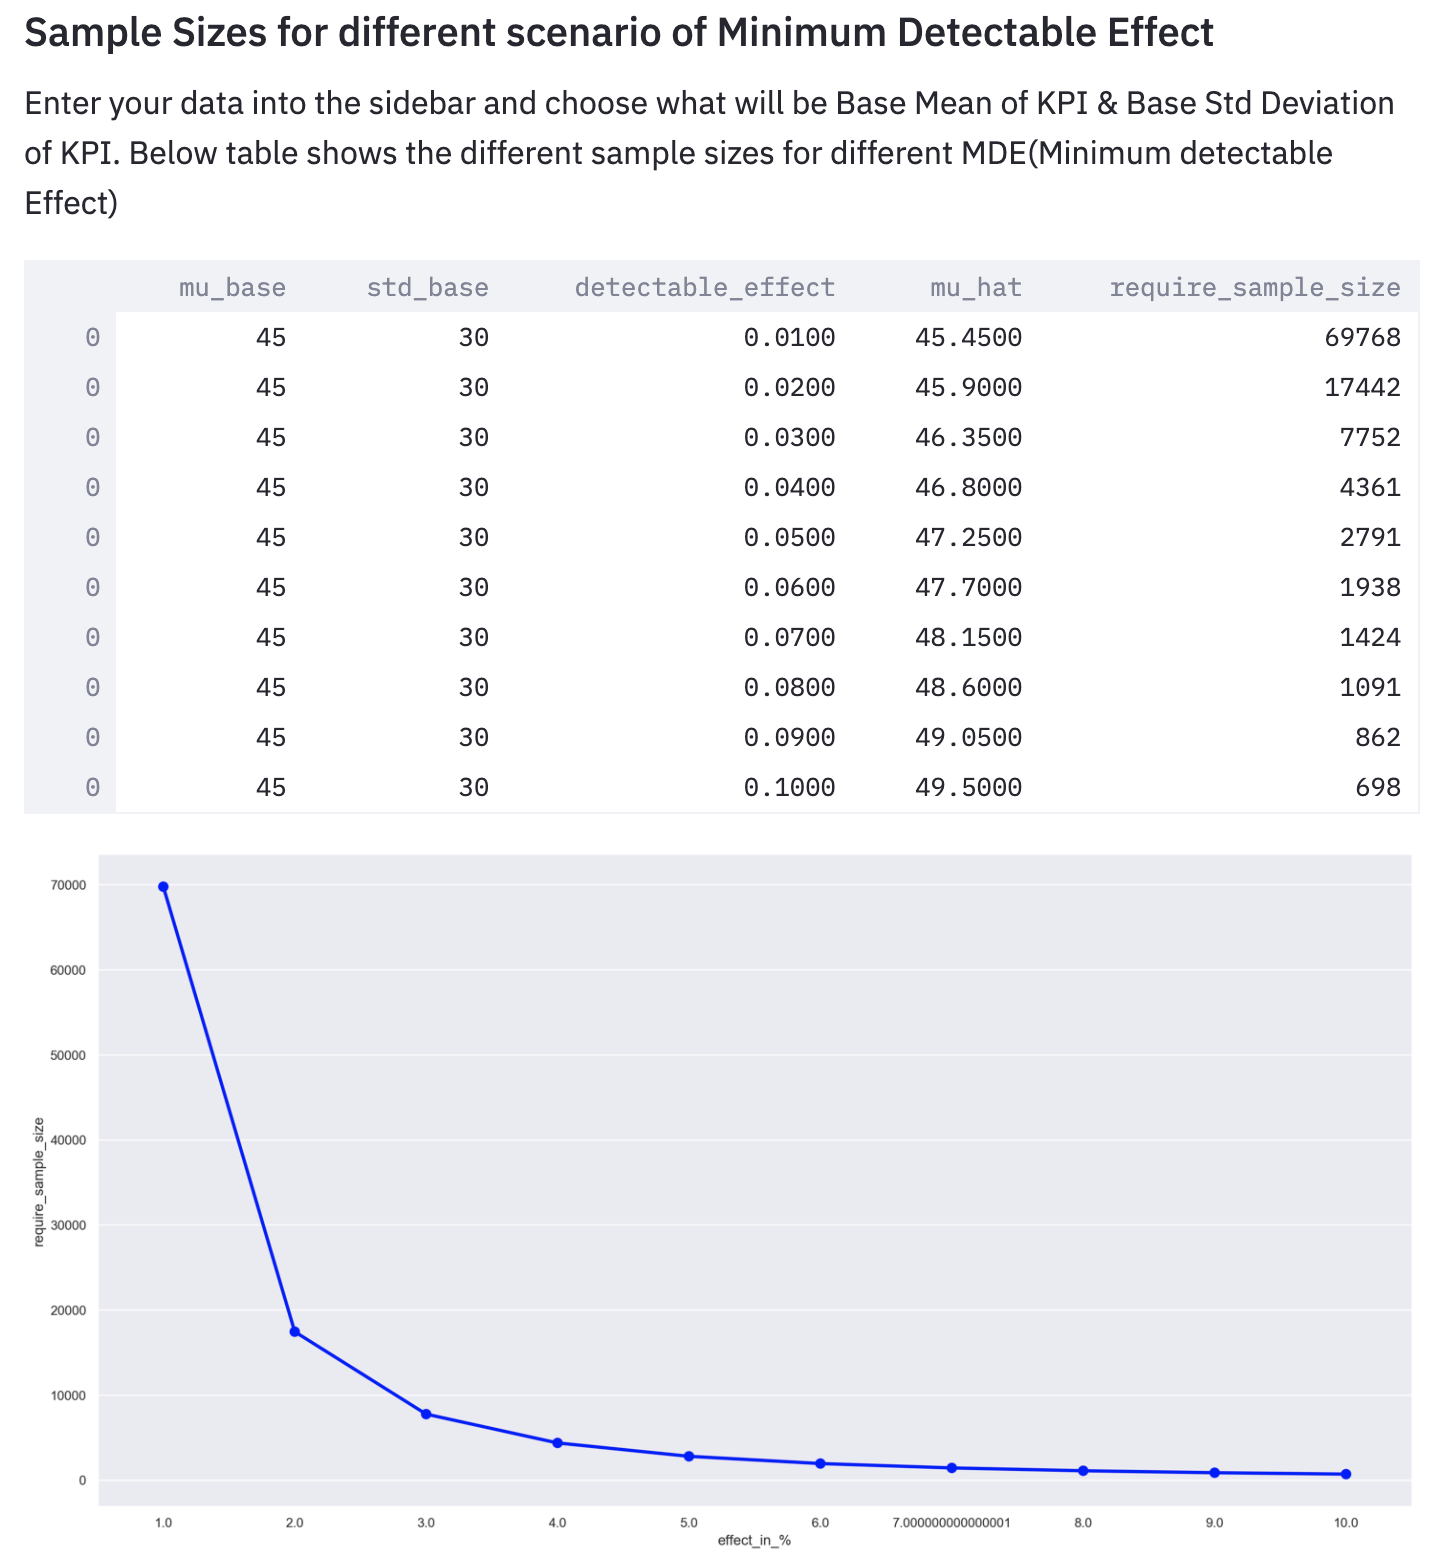
In the above figure, you can see that for different effect sizes(detectable effect), required sample sizes are varying.
PART-3: Measure Experimental Outcome
Now time to measure that experimentation results. Remember the Null hypothesis has no statistical significance between Control(hold out) and the Test group.
So we can estimate the difference between Control & Test using many different ways, but for simplicity, we will categories our estimation process into 3 broad categories:
- Post (Control) Vs Post (Test)
- Pre (Test) Vs Post(Test)
- Adjusted Measurement (CUPED)
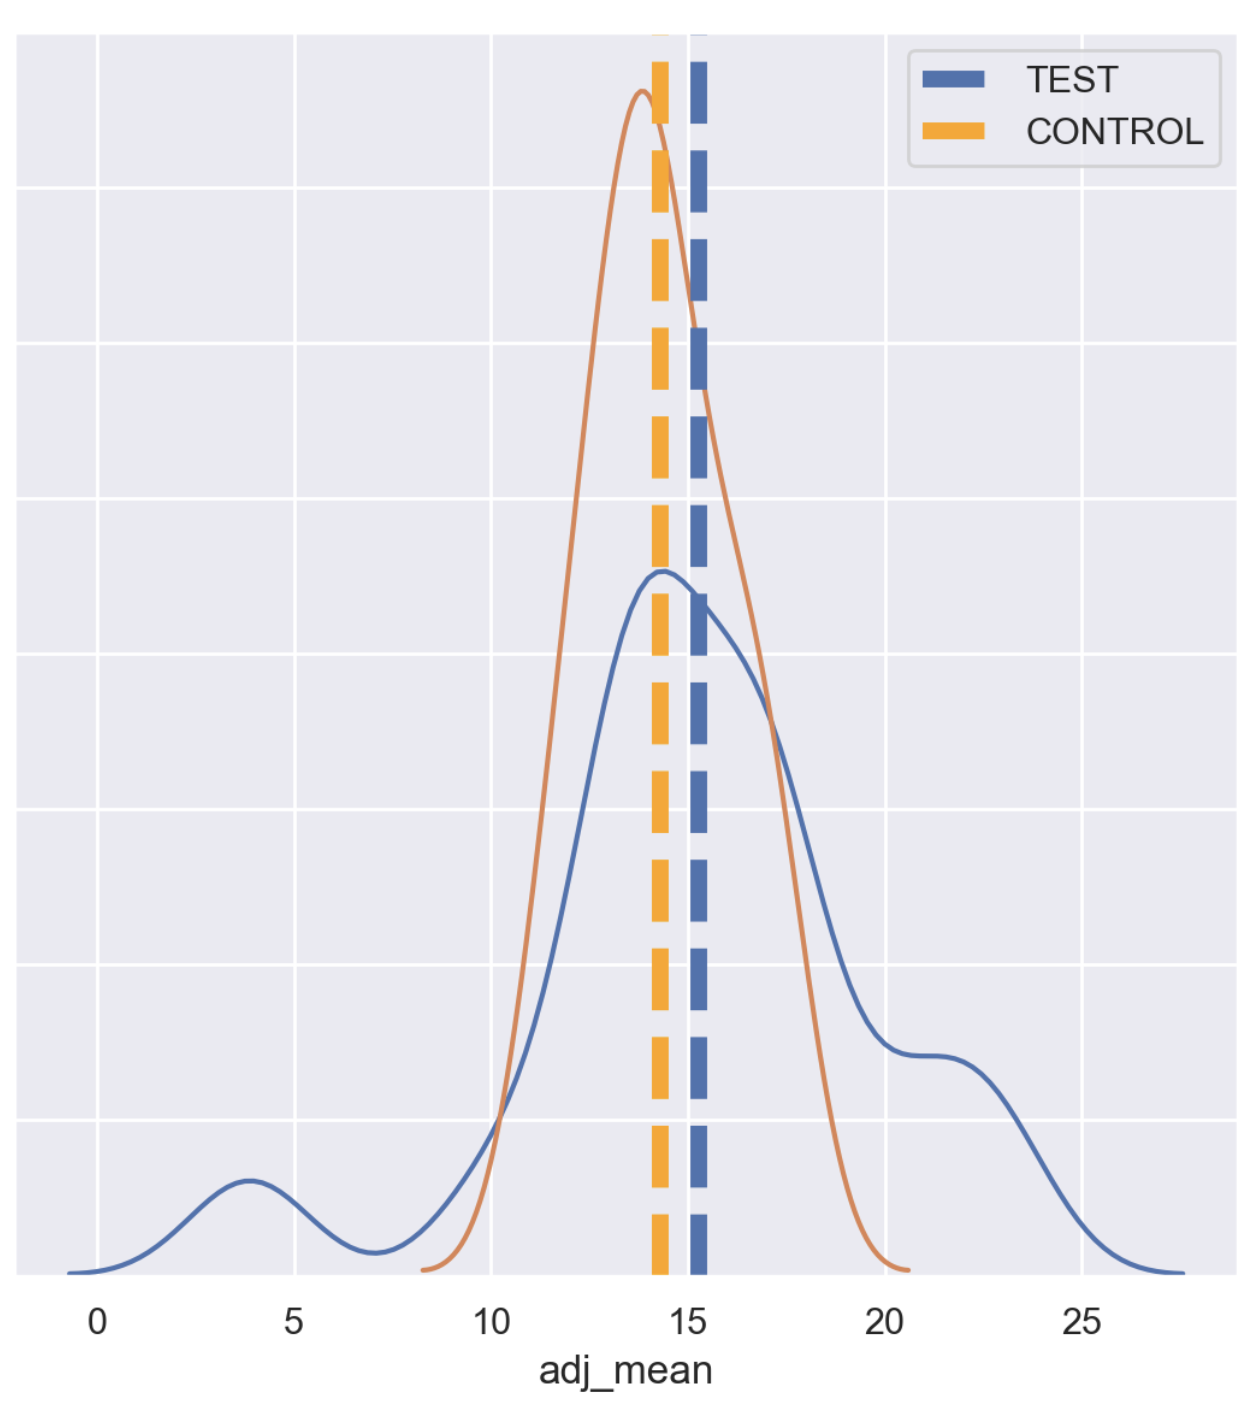
1)Post (Control) Vs Post (Test): In post behavior analysis, we can use many methods but for simplicity, we will use :
- The T-Test (Parametric) — It’s an inferential statistical method to determine the significant difference between means of two groups, a very powerful method when distributions are following a normal distribution.
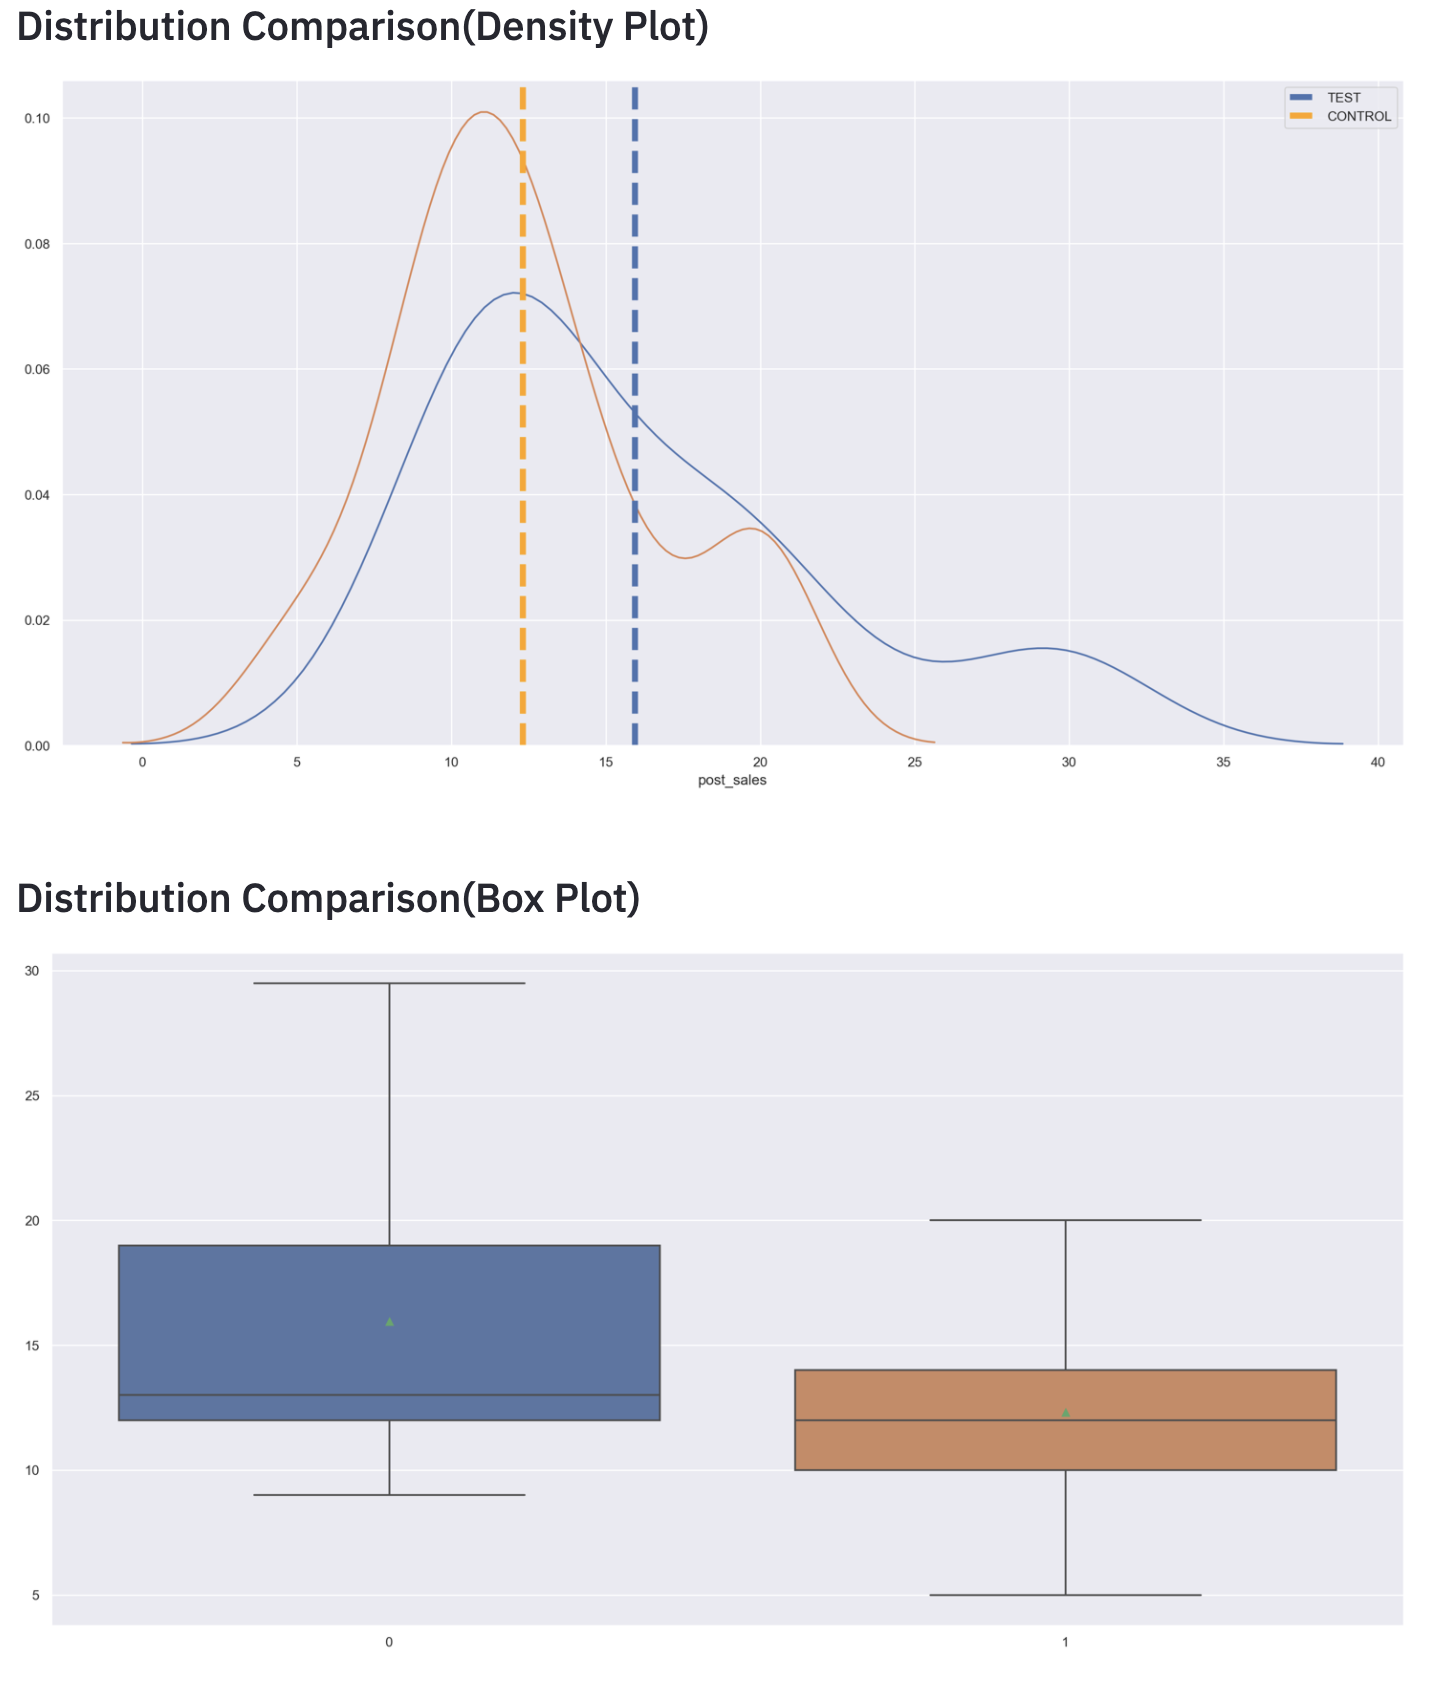
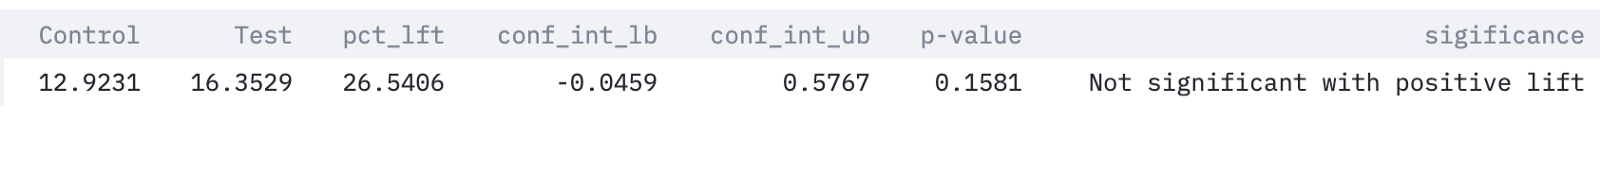
In the above figure, it is very clear that the Test group perform better than the Control group but non-significant.
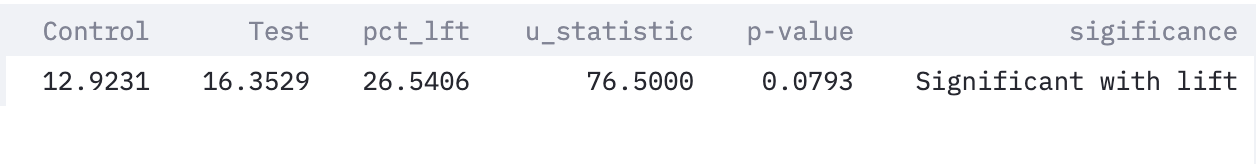
2. Man Whitney U-Test (Non-Parametric)– Non-parametric test to compare outcomes between Control group and Test group, useful when distributions are not following a normal distribution.
But we can’t completely rely on this result, because we have to check for the pre-experiment bias affecting the KPI’s in the Test period or not.
2) Pre(Test) Vs Post (Test): Another classical yet intuitive method of measuring the effect with the help of the Intervention method (Interrupted Time Series Approach) or Quasi-Experiment method where it assumes that the Control group does not exist and trying to measure the impact of the Test using counterfactual.
This analysis is done with the help of Google’s Causal Inference library in python.
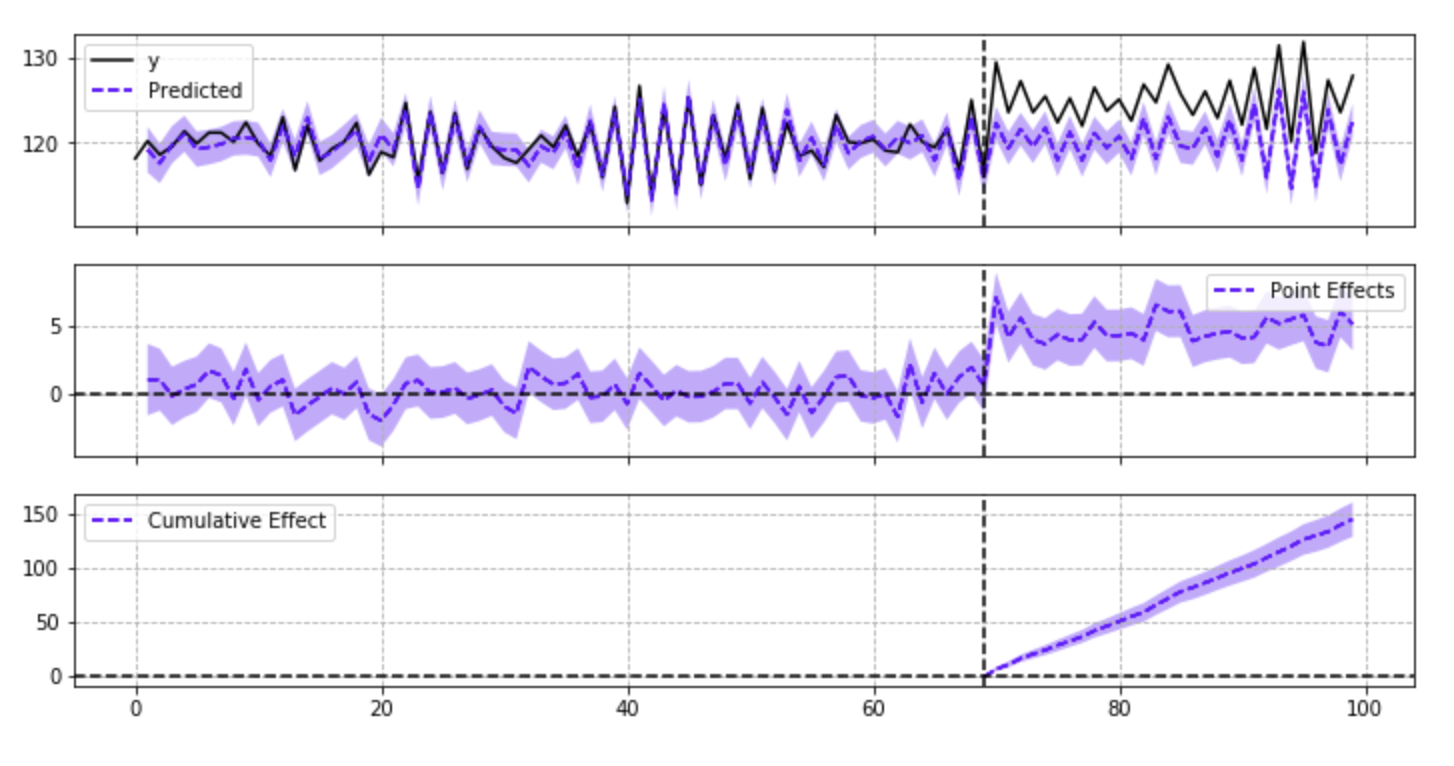
source- ‘https://github.com/dafiti/causalimpact/blob/master/examples/ci_plot.png‘
3) Adjusted Measurement (CUPED): Controlled-Experiment Using Pre-Experiment Data(CUPED). The excellent approach was developed by the “Experiment Platform team at Microsoft ”(Deng, Xu, Kohavi, & Walker, 2013).
Many times it happened, that experimentation was impacted but the delta is very small, might be rejected by a statistical test because of high variance. This technique is very much helpful to increase experimentation sensitivity via reducing variance associated with pre-experiment data.
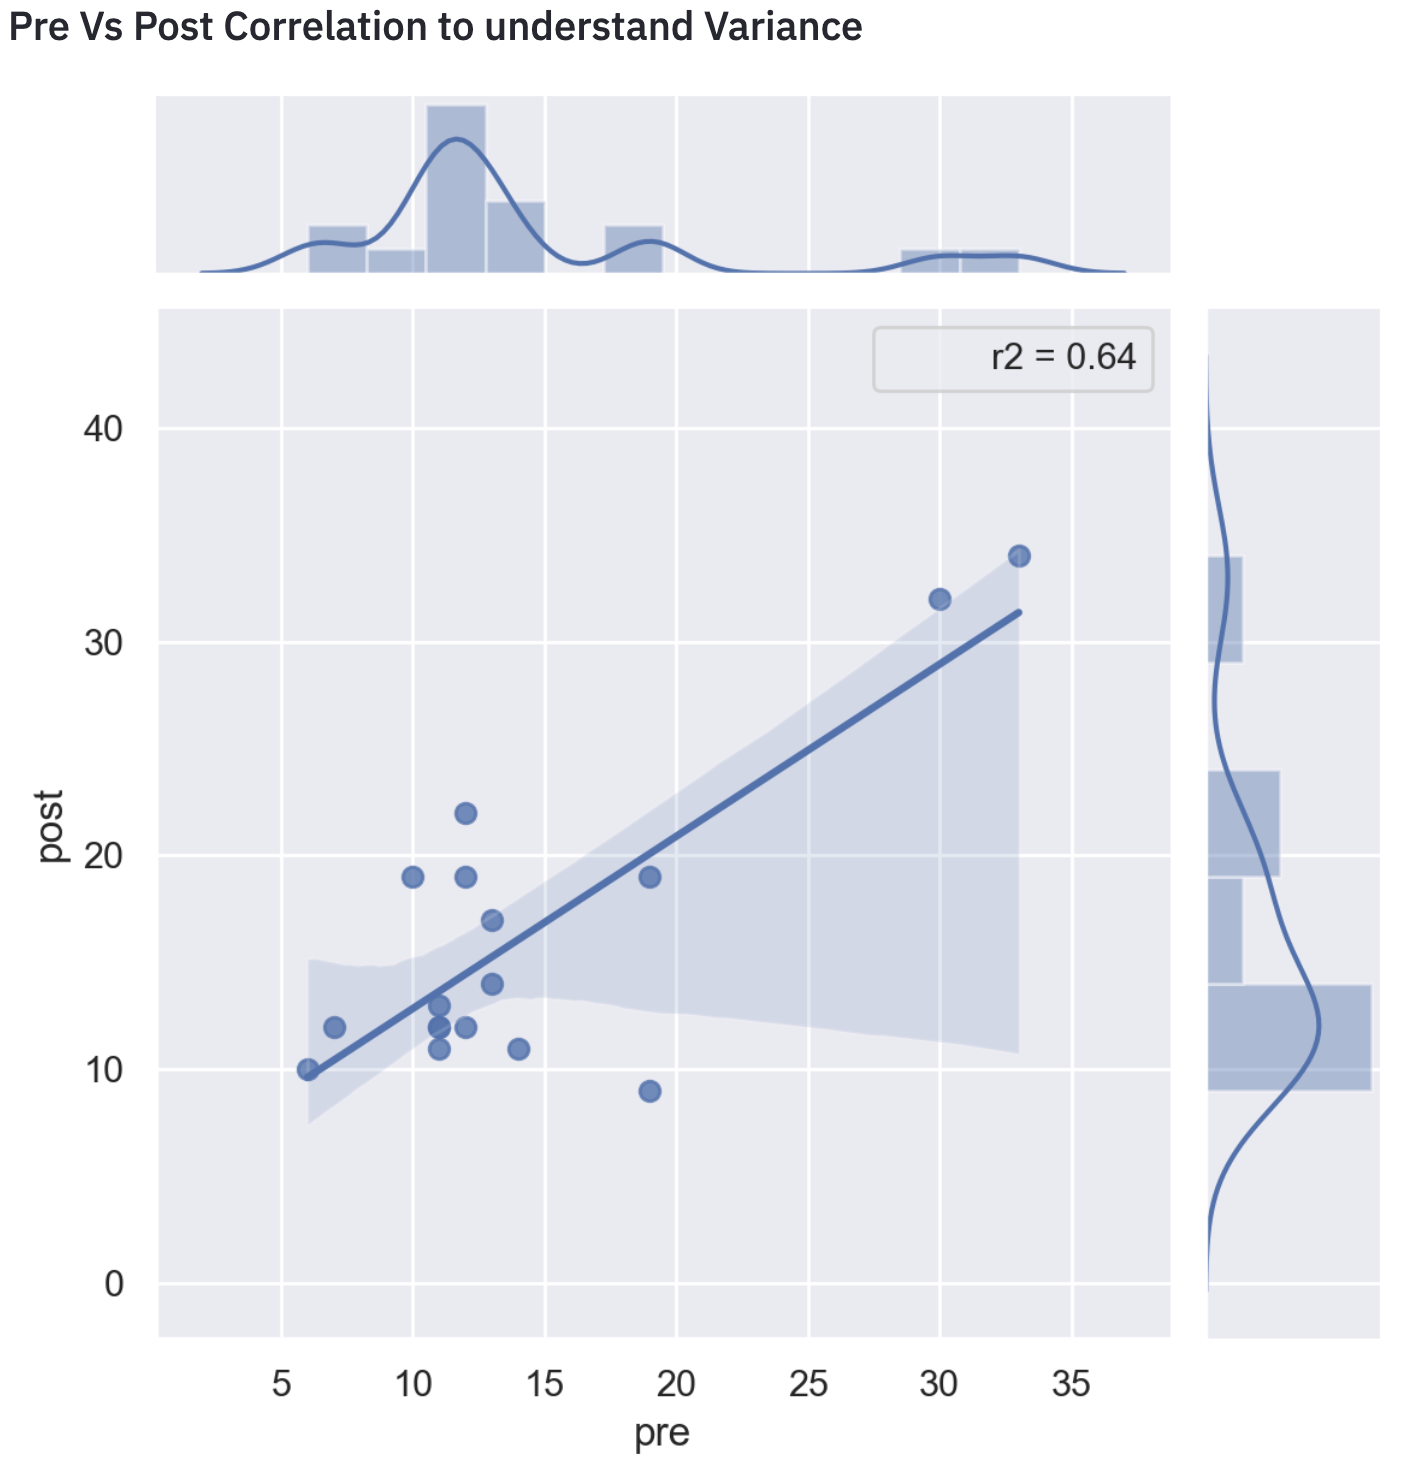
As we can see from the above visual the R-square is 0.64 which is pretty high. That signifies pre-experiment bias exists in metric, therefore it should be removed.
So after removing the variance and then do the T-Test will give the exact picture.
PART- 4: Analysis & Conclusion
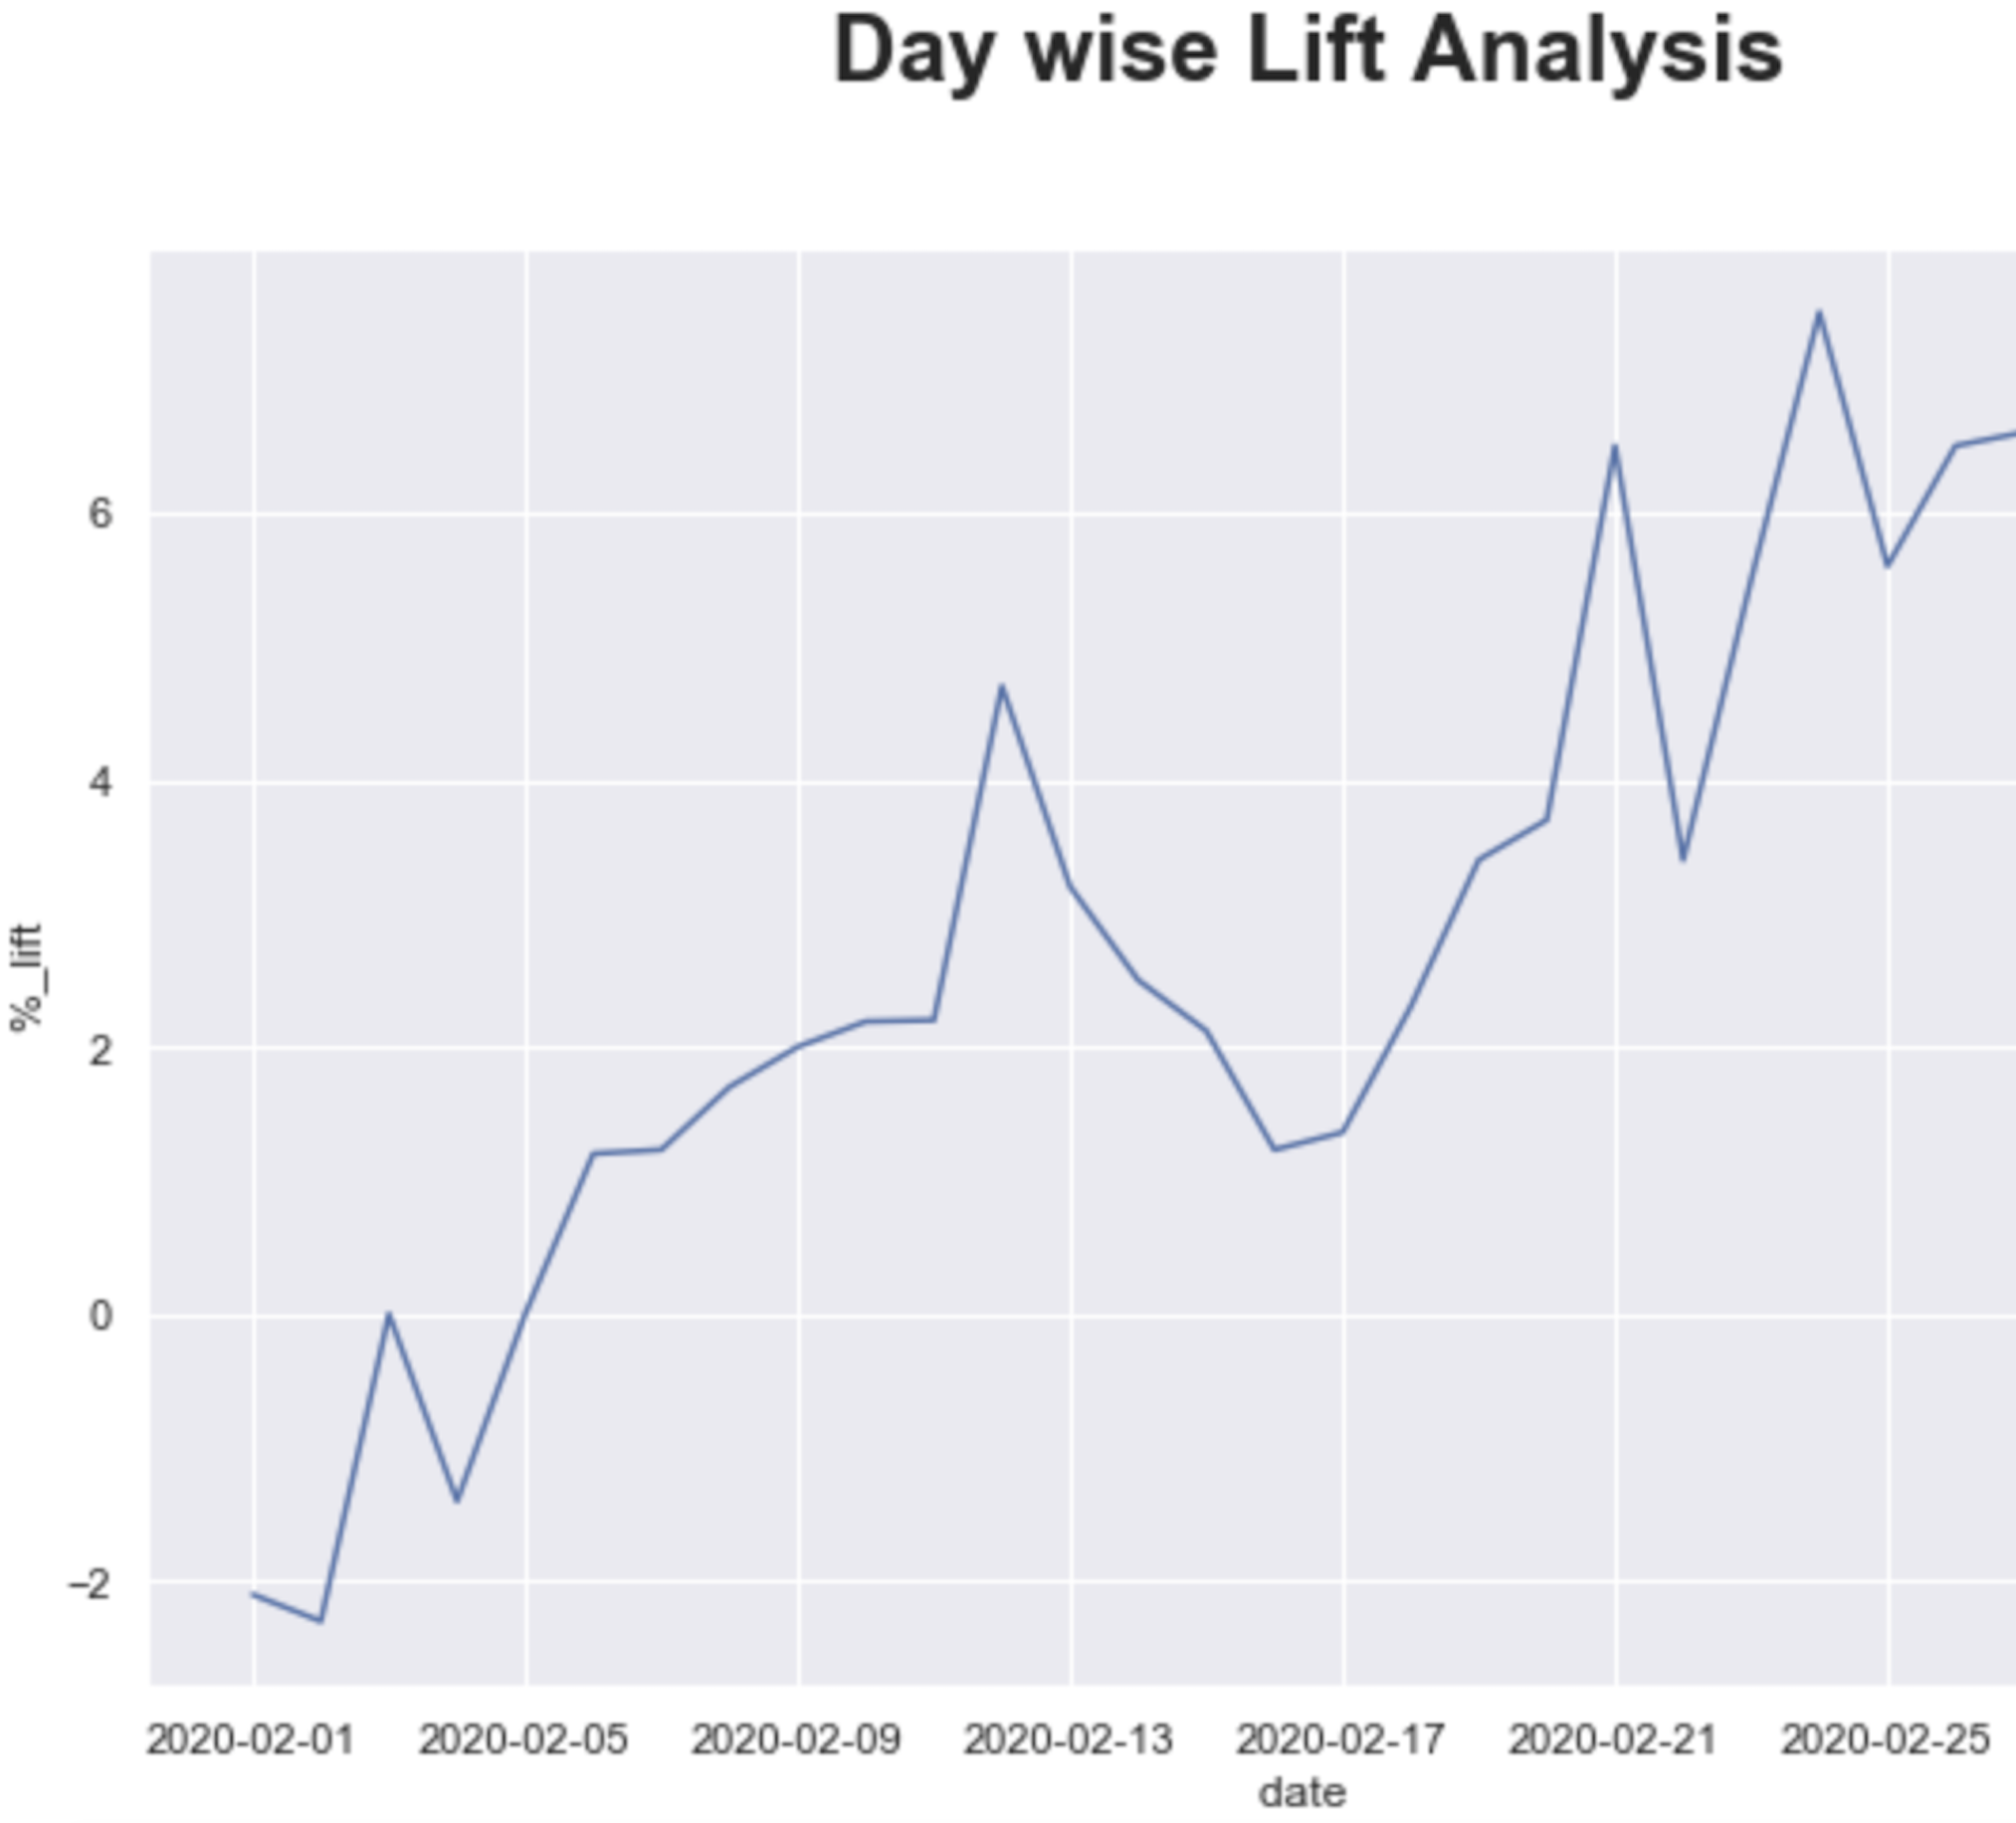
So from the above analysis, it is clear that the experiment had some positive impact on the Control group. But it is very important to know is it overall converged or not, and at what is the point of inflection.
- Day wise lift analysis is another powerful way to look at the overall Test converges or not and when we start seeing significant results. It is also helpful to rule out Novelty & Seasonality effects in the experiment if exist.
2. Driver Analysis- is also yet another powerful tool to understand the market dynamics, which factors influence the sales pattern to mold. I think Linear regression or any other tree-based algorithm will suffice the need.
To conclude, these all frameworks are very much helpful to understand the overall impact estimation of experimentation and very intuitive at the same time to interpret to business.
References
1. Trustworthy Online Controlled Experiments: A Practical Guide to A/B Testing
2.https://learn.datacamp.com/courses/ab-testing-in-r
3.https://booking.ai/how-booking-com-increases-the-power-of-online-experiments-with-cuped-995d186fff1
The media shown in this article are not owned by Analytics Vidhya and is used at the Author’s discretion.


Very well presented blog.