This article was published as a part of the Data Science Blogathon
Introduction
Kindly do your exploration a long time prior to putting cash in any cryptocurrency money.
As of late Dogecoin is springing up wherever in the news. So I needed to think about this recently popular digital currency and how it is distinctive structure the other cryptographic money like Bitcoin, Ethereum, and so on.
To see more about the distinction and the justification of the unexpected blast in dogecoin I did some examination on dogecoin and the other cryptographic money.
While investigating dogecoin I discovered that it is a meme coin, and it is unstable and was distraught out of senselessness. While bitcoin and Ethereum are two altogether different cryptocurrency money however are made for an explanation and are quite gotten than dogecoin.
Actually like there must be 21 million bitcoins ever. Dogecoin adds 10000 doges at any point single moment of each day there is no restriction no shortage. If there is no shortage the cost will drop as individuals quit purchasing there are a lot more factors at the cost to drop and increment however I won’t go around there. While exploring dogecoin I discovered actually like dogecoin there are a lot more meme coins.
I’m not advancing any digital money in this post nor I’m elevating you’ll to put resources into any digital money. This post is to make individuals mindful of such cryptographic money.
We are going to analyze cryptocurrencies in great detail using python and its libraries
Check my latest articles here

Image Source
Table of Content
- Problem Statement
- Import libraries
- Data Importing
- Bitcoin Data
- DogeCoin Data
- Bitconnect Data
- Ethereum Data
- Data Visualization
- Cryptocurrency prices in 2018 vs 2020
- Cryptocurrency Volume in 2018 vs 2020
- Returns: Percentage Change In Price
- High-Low Values
- Conclusion

Image Source
Problem Statement
The dataset comprises the recorded value data of a portion of the digital currencies by market capitalization. The dataset has a portion of the digital currency from the accompanying classifications.
- Meme Cryptocurrency: Coins like Doge, Shibu Inu, elongate, etc which are derived from a meme or just for fun.
- Penny Cryptocurrency: Coins whose price is below 1penny USD are known as penny coins.
- Dead Cryptocurrency: Coins having a Market cap is 0 said to be the dead cryptocurrency
- Famous and largest cryptocurrency: Coins like Bitcoin, Ethereum, etc. with a very high price and large market cap are listed below this category.
Features of Dataset
- Date: Date of observation
- Open: Opening price on the given day
- High: Highest price on the given day
- Low: Lowest price on the given day
- Close: Closing price on the given day
- Volume: Volume of transactions on the given day
- Market Cap: Market capitalization in USD
Historical Data is available from April 28, 2013.

Image Source
Import libraries
In this section, we will import all the required libraries that are necessary for our further analysis. We will go to see pandas, NumPy, matplotlib, seaborn and plotly. Check the below code for fore information on how to import required libraries
Python Code:
Data Importing
In this section, we are going to import the dataset for further analysis. We will be using the pandas _csv() function to read the CSV file. The data is stored in the Pandas data frame. We will be reading datasets separately for different cryptocurrencies like Bitcoin, Dogecoin, etc.
Bitcoin Data
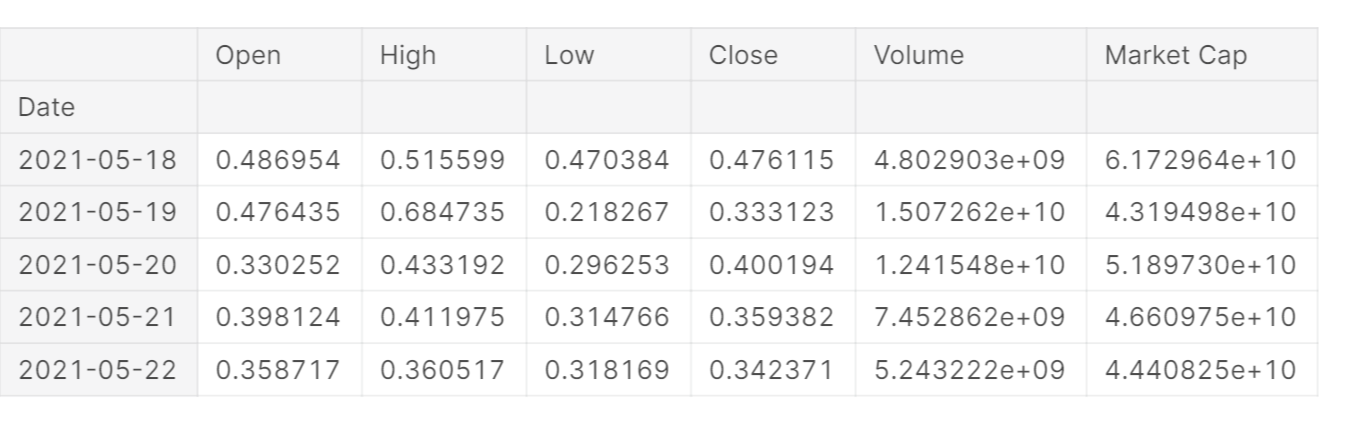
We are reading the BitCoin Data by using the pandas _csv() function to read the CSV file. Setting the parse_dates as Date and index_col as Date. After reading the data, use that Pandas tail() function to get the last 5 rows of the dataset.
btc=pd.read_csv('meme-cryptocurrency-historical-data/Bitcoin.csv',parse_dates=['Date'],index_col='Date', date_parser=dateparse)
btc = btc.iloc[::-1]
btc.tail(5)
The below table shows the output of the above command. The table consists of different columns like Open, High, Low, Close, Volume, and Market Cap. All these values are shown for time which means Date.
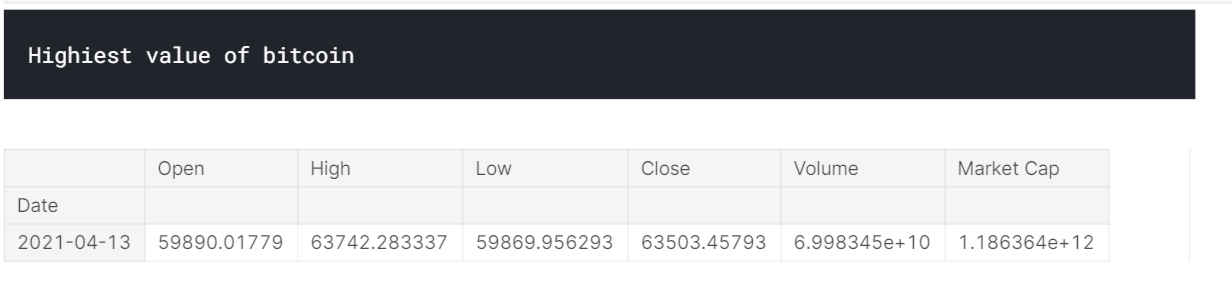
To get the highest value of BitCoin in the dataset, use the below command. The highest value comes out to be 63503.4593 on 2021-04-13.
axValue=btc[btc['Close']==max(btc.Close)]
print("Highiest value of bitcoin")
maxValue
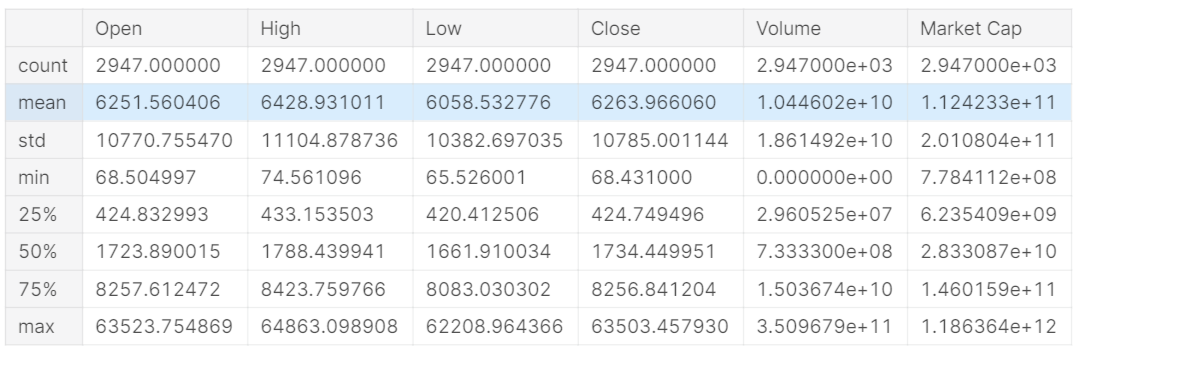
btc.describe()
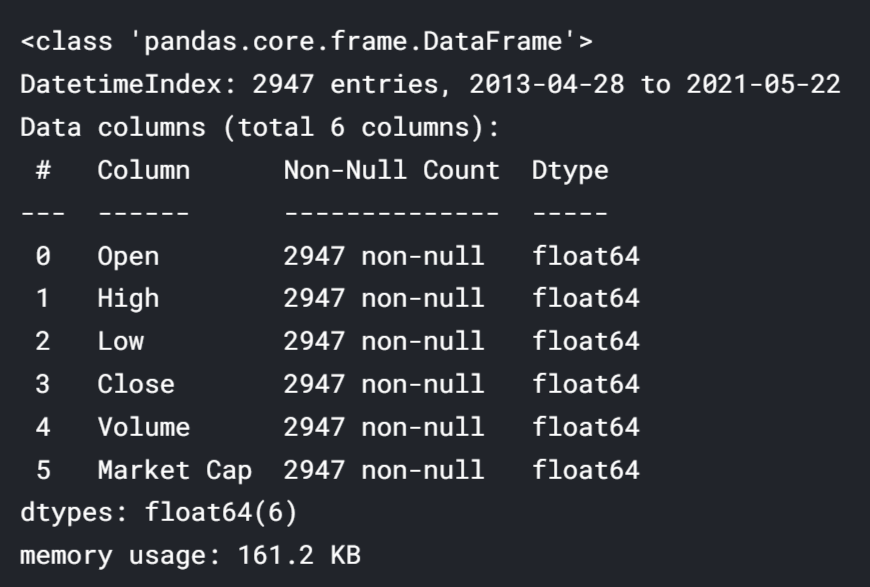
btc.info()
DogeCoin Data
We are reading the DogeCoin Data by using the pandas _csv() function to read the CSV file. Setting the parese_dates as Date and insex_col as Date. After reading the data, use that Pandas tail() function to get the last 5 rows of the dataset.
doge=pd.read_csv('meme-cryptocurrency-historical-data/Meme Coin/Dogecoin.csv',parse_dates=['Date'],index_col='Date', date_parser=dateparse)
doge = doge.iloc[::-1]
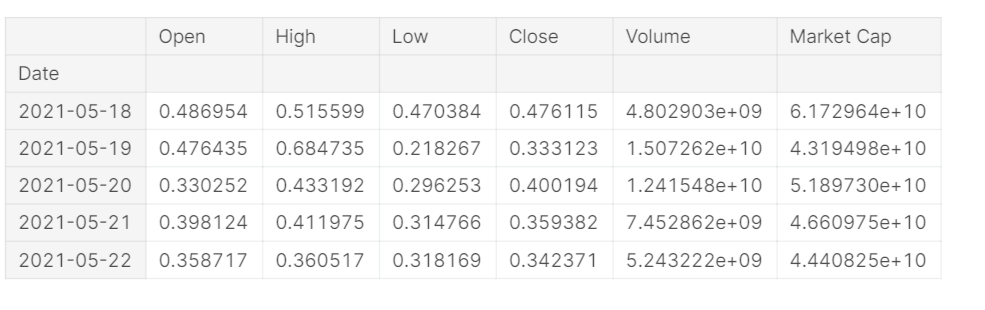
doge.tail(5)
The below table shows the output of the above command. The table consists of different columns like Open, High, Low, Close, Volume, and Market Cap. All these values are shown for time which means Date.
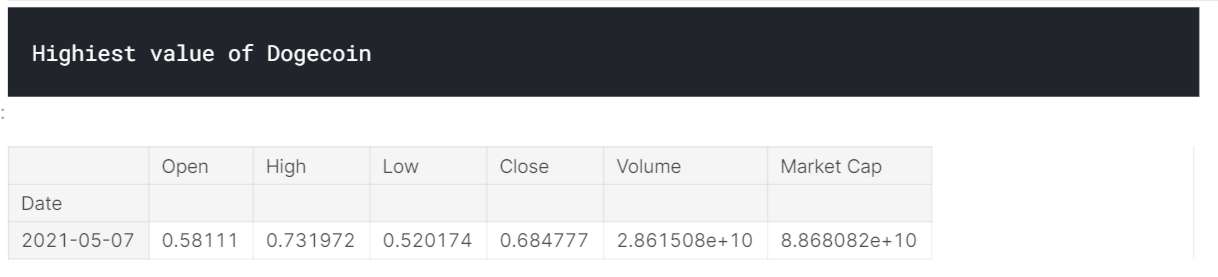
To get the highest value of BitCoin in the dataset, use the below command. The highest value comes out to be 0.684777 on 2021-05-07.
maxValue=doge[doge['Close']==max(doge.Close)]
print("Highiest value of Dogecoin")
maxValue
Bitconnect Data
We are reading the Bitconnect Data by using the pandas _csv() function to read the CSV file. Setting the parese_dates as Date and insex_col as Date. After reading the data, use that Pandas tail() function to get the last 5 rows of the dataset.
bit=pd.read_csv('meme-cryptocurrency-historical-data/Dead Coin/bitconnect.csv',parse_dates=['Date'],index_col='Date', date_parser=dateparse)
bit=bit.iloc[:,1:7]
bit = bit.iloc[::-1]
bit=bit.iloc[:1580]
bit18=bit[:609]
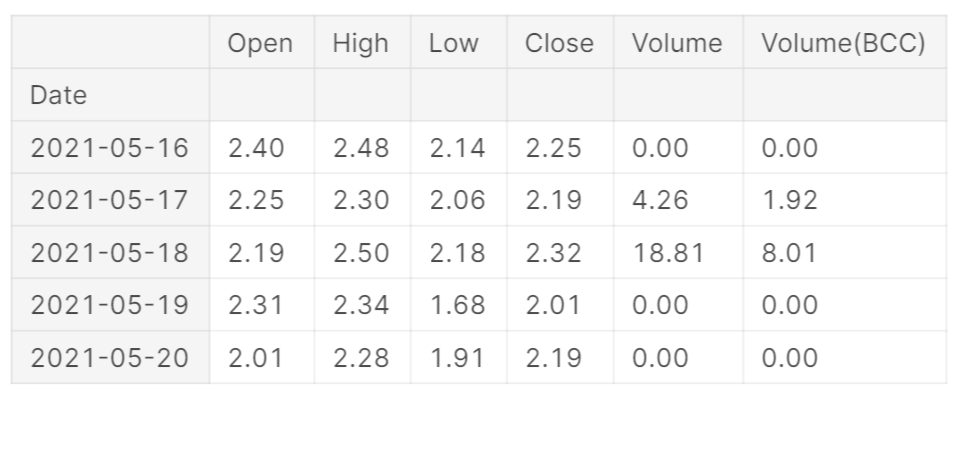
bit.tail(5)
The below table shows the output of the above command. The table consists of different columns like Open, High, Low, Close, Volume, and Market Cap. All these values are shown for time which means Date.
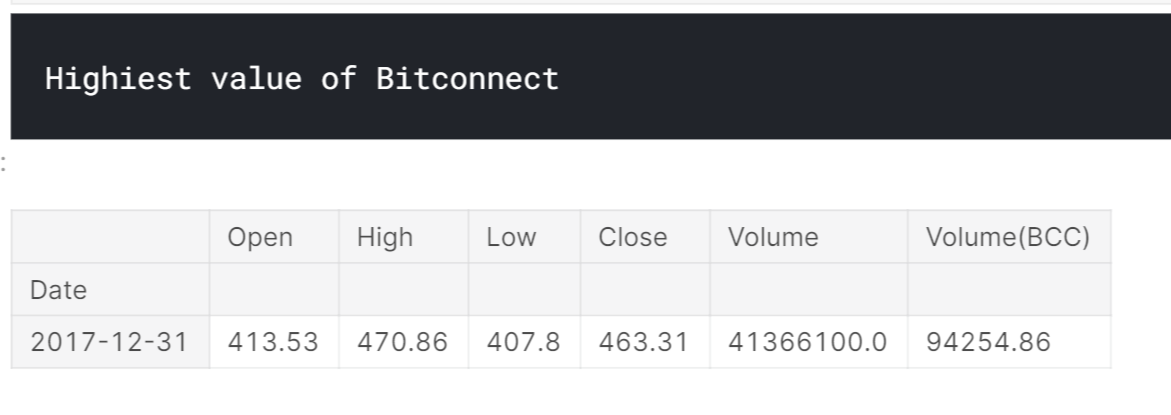
To get the highest value of BitCoin in the dataset, use the below command. The highest value comes out to be 463.31 on 2017-12-31
axValue=bit[bit['Close']==max(bit.Close)]
print("Highiest value of Bitconnect")
maxValue
Ethereum Data
We are reading the Ethereum Data by using the pandas _csv() function to read the CSV file. Setting the parese_dates as Date and insex_col as Date. After reading the data, use that Pandas tail() function to get the last 5 rows of the dataset.
eth=pd.read_csv('meme-cryptocurrency-historical-data/Ethereum.csv',parse_dates=['Date'],index_col='Date', date_parser=dateparse)
eth = eth.iloc[::-1]
eth.tail(5)
The below table shows the output of the above command. The table consists of different columns like Open, High, Low, Close, Volume, and Market Cap. All these values are shown for time which means Date.
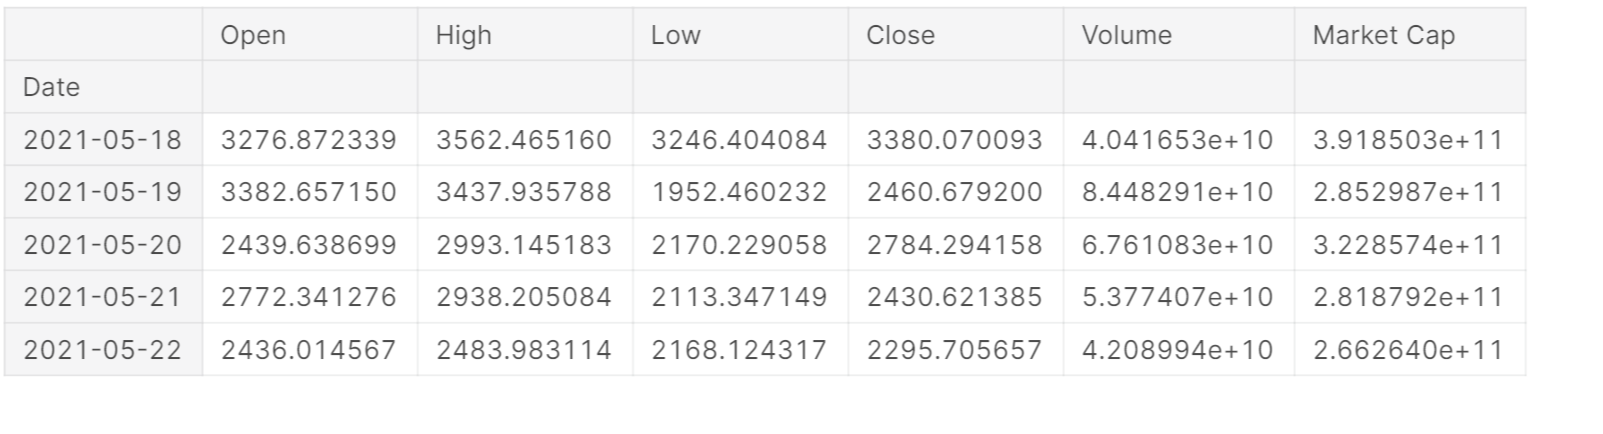
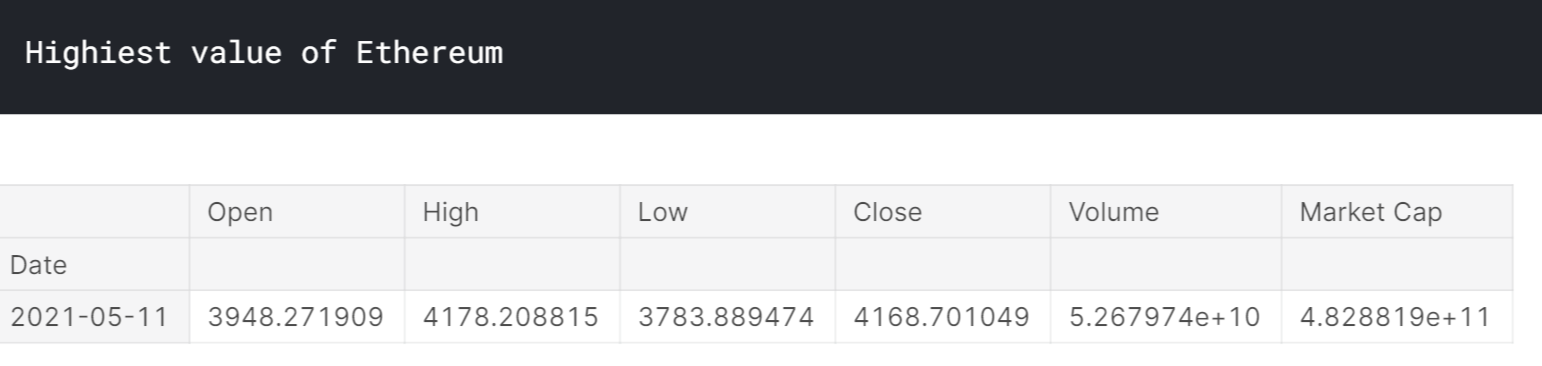
To get the highest value of BitCoin in the dataset, use the below command. The highest value comes out to be 4168.70 on 2021-05-11
maxValue=eth[eth['Close']==max(eth.Close)]
print("Highiest value of Ethereum")
maxValue
Data Visualization
In this section, we are going to draw some important visuals using matplotlib, seaborn, and plotly to get some useful insights from the data. We will compare how the different cryptocurrency prices vary year to year, Volume comparison, the percentage change in price, and many more. So let’s get started without any further delay.
Cryptocurrency prices in 2018 vs 2020
In this part, we will draw the line plots using the seaborn library to compare closing prices of different cryptocurrencies in 2018 vs 2020.
We are going to draw line plots for Bitcoin, Ethereum, and BitConnect and compare their value in 2018 vs 2020. For line plots, we need to pass data, x-axis value, and y-axis value. Check the below code for more information on how to draw line plots for closing prices year to year.
ef to2018(df):
df18=equalize(df,bit)
    return df18.iloc[:len(bit18)]
def equalize(df,dfs):
low=len(dfs)
high=len(df)
dff=high-low
    return df.iloc[dff:]
btc18=to2018(btc)
eth18=to2018(eth)
crypto=["Bitcoin 2018","Bitcoin","Ethereum 2018","Ethereum","Bitconnect 2018","Dogecoin"]
cryptoDf=[btc18,btc,eth18,eth,bit18,doge]
num_plots = 6
total_cols = 2
total_rows = 3
fig, axs = plt.subplots(nrows=total_rows, ncols=total_cols,
                        figsize=(14*total_cols, 7*total_rows), constrained_layout=True)
for i, var in enumerate(crypto):
row = i//total_cols
pos = i % total_cols
sns.set_context('paper', font_scale = 2)
plot =  sns.lineplot(data=cryptoDf[i], x="Date", y="Close",color='#732C2C',palette ='coolwarm',ax=axs[row][pos])
axs[row][pos].set_title(crypto[i])
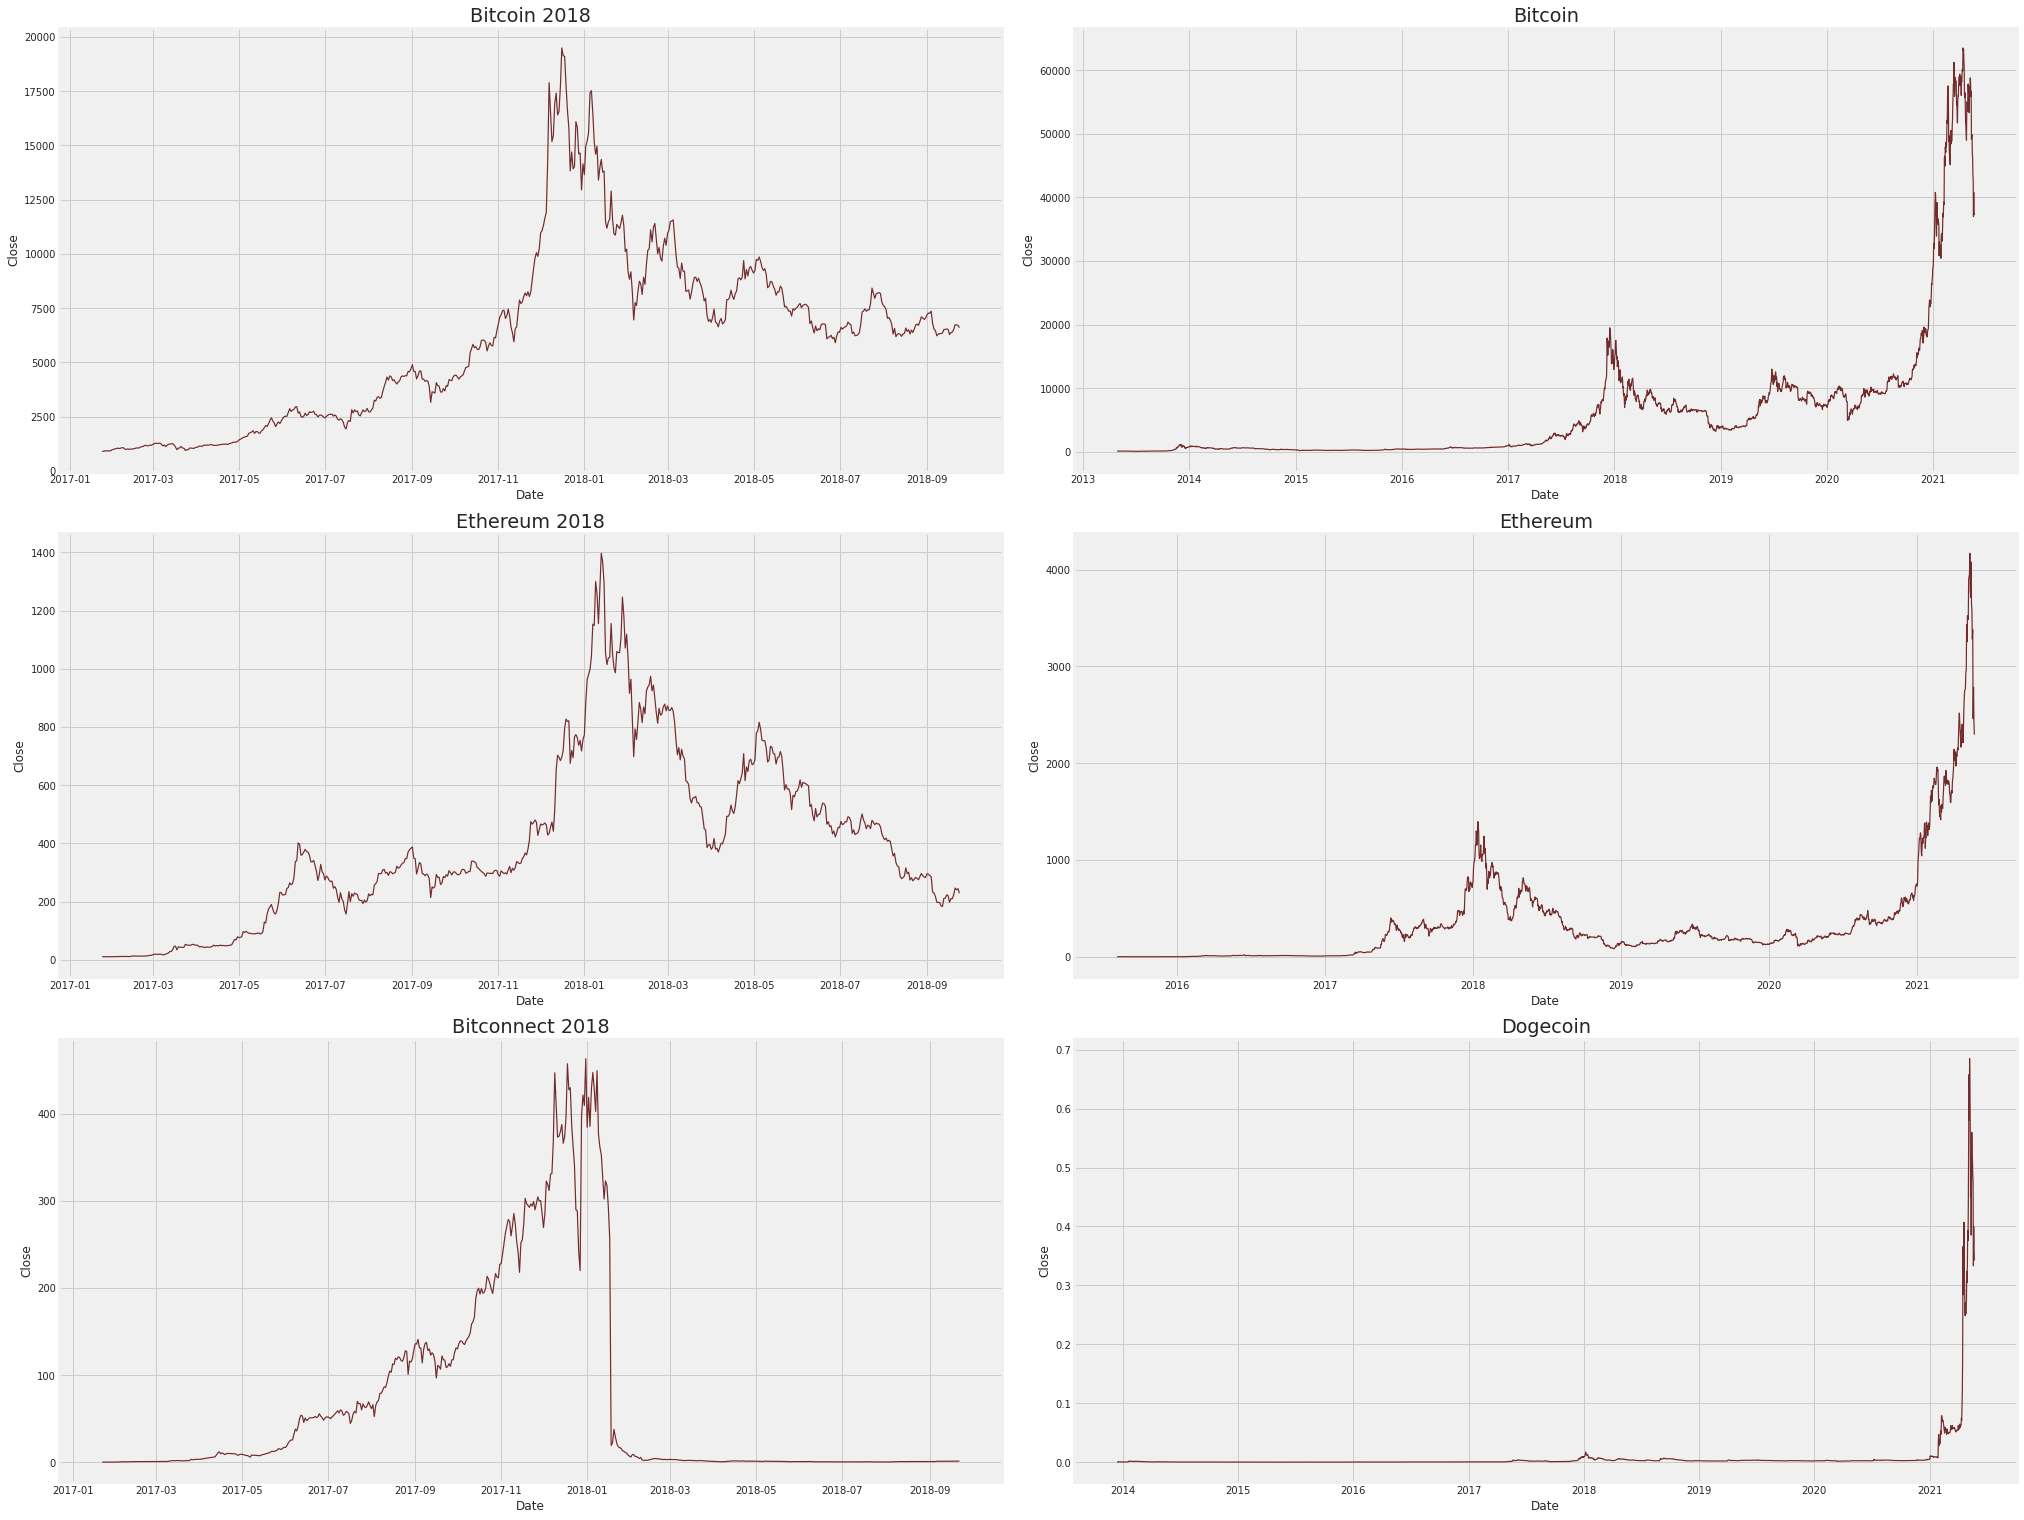
Observation
- We can see a clear spike in all the cryptocurrency in 2018
- After 2018, prices started falling
- The nature of spikes is the same in all the cryptocurrency
- Bitconnect fell definitely and stopped to present after that.
- Though Bitcoin and Ethereum both endure the effect is as yet on the lookout
Cryptocurrency Volume in 2018 vs 2020
In this part, we will draw the line plots using the seaborn library to compare the Volume of different cryptocurrencies in 2018 vs 2020. Volume is the number of coins that are traded during the trading period(bought or sold).
We are going to draw line plots for Bitcoin, Ethereum, and BitConnect and compare their volume in 2018 vs 2020. For line plots, we need to pass data, x-axis value, and y-axis value. Check the below code for more information on how to draw line plots for volume year to year.
fig, axs = plt.subplots(nrows=total_rows, ncols=total_cols,
                        figsize=(14*total_cols, 7*total_rows), constrained_layout=True)
for i, var in enumerate(crypto):
row = i//total_cols
pos = i % total_cols
sns.set_context('paper', font_scale = 2)
plot =  sns.lineplot(data=cryptoDf[i], x="Date", y="Volume",color='#732C2C',palette ='coolwarm',ax=axs[row][pos])
axs[row][pos].set_title(crypto[i])
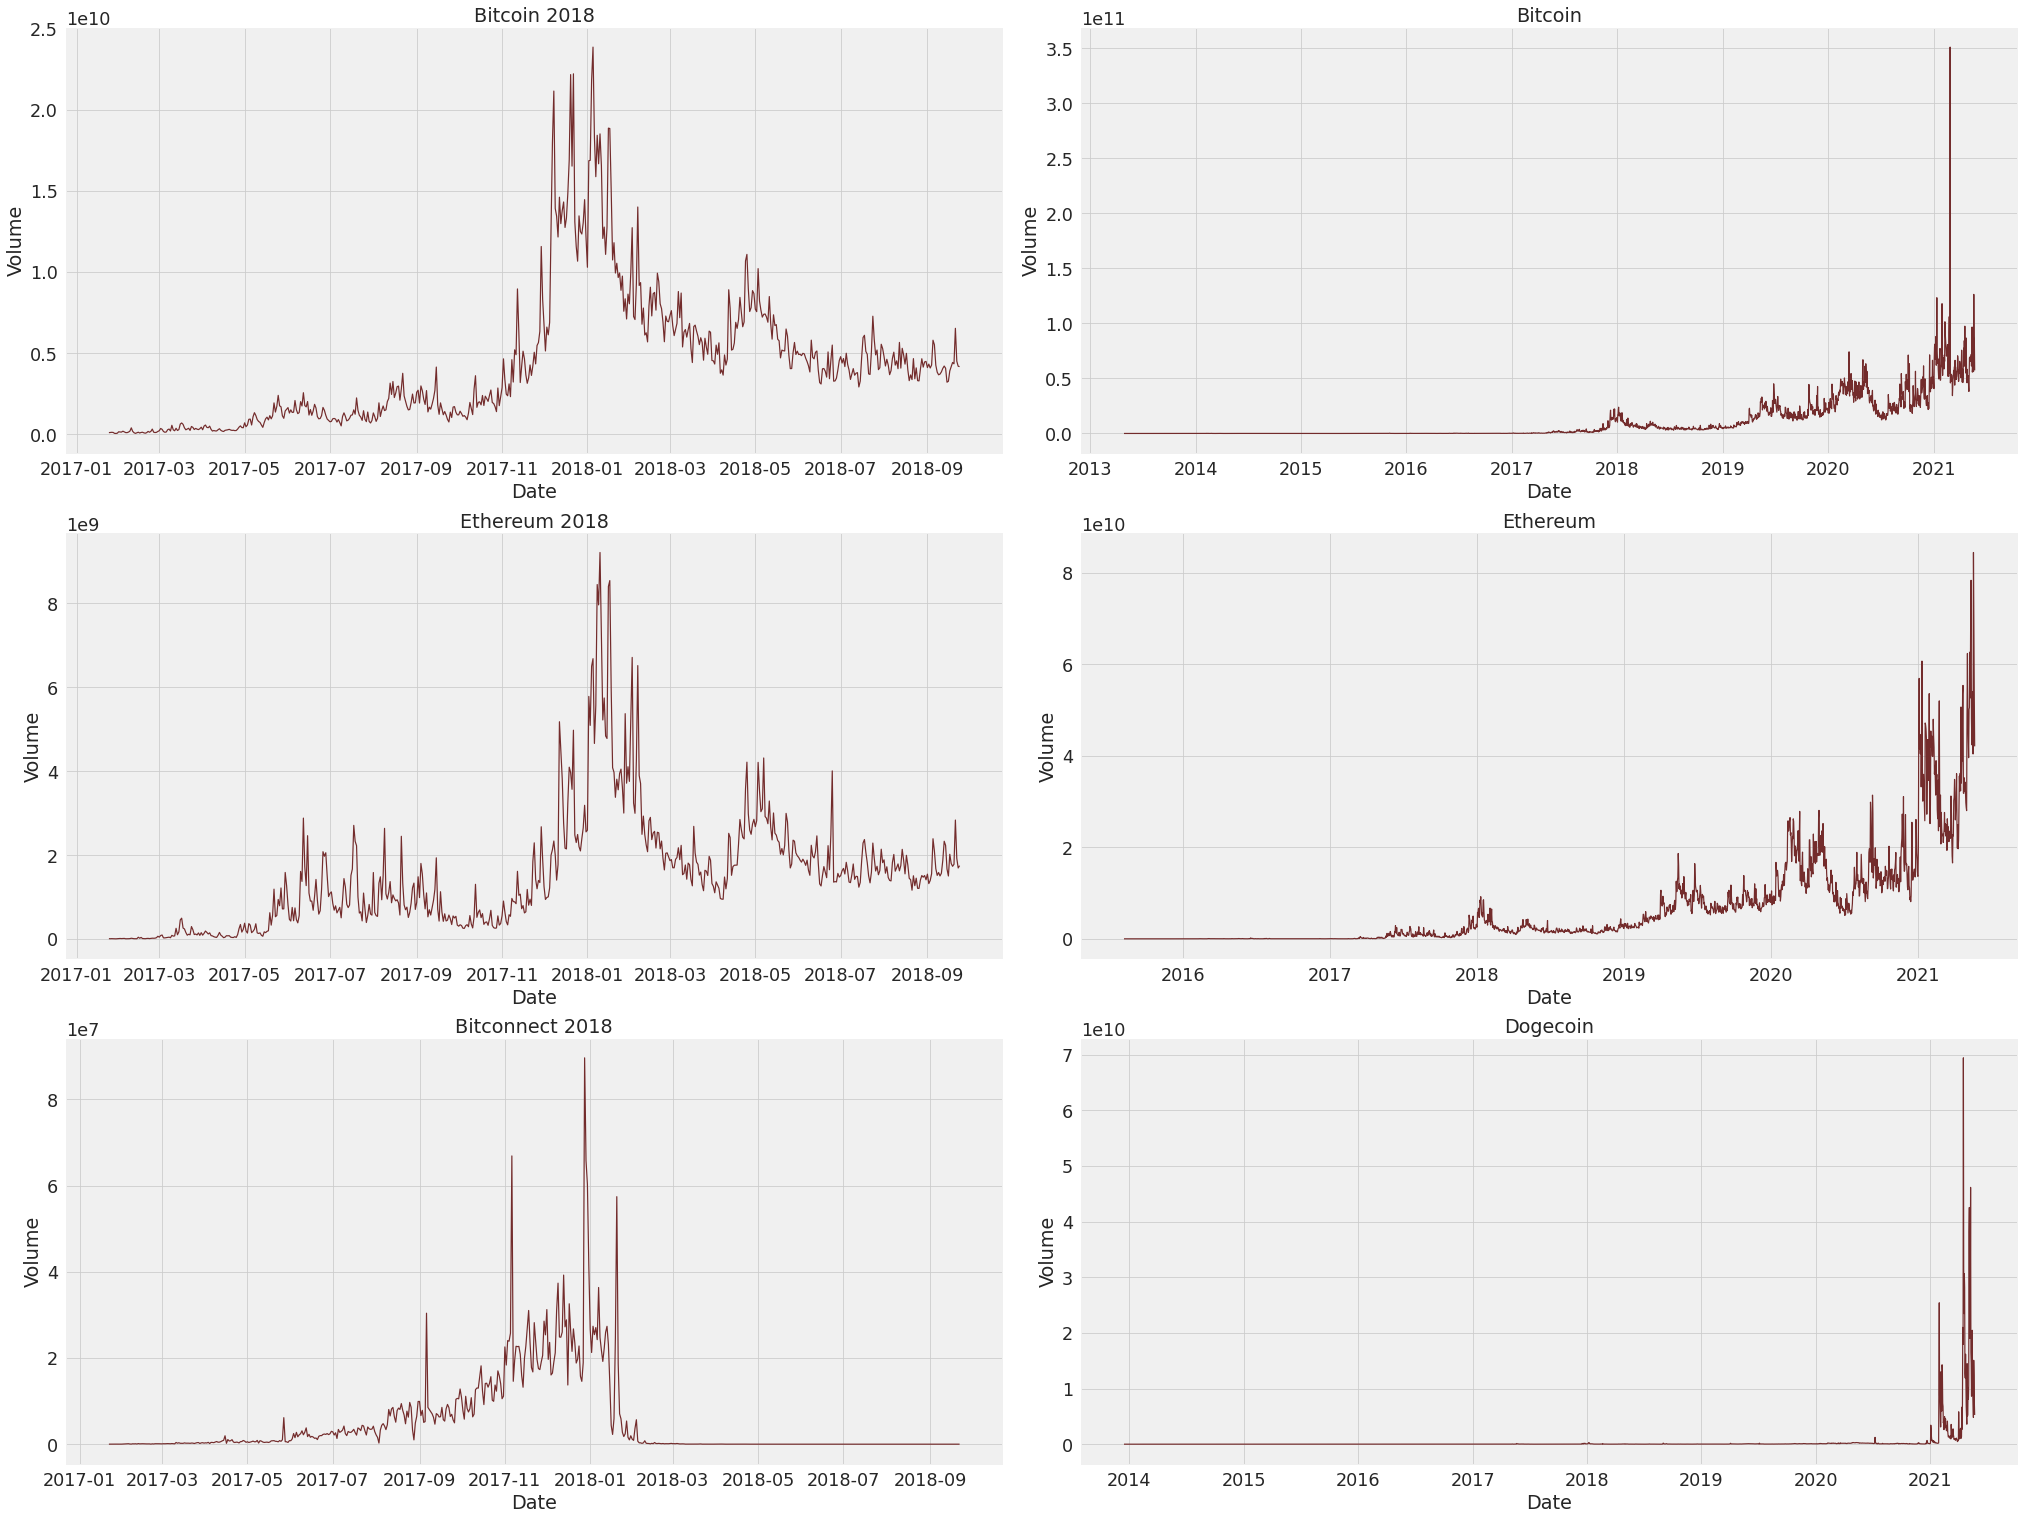
Observation
- The price of Bitconneect depends on the volume of coins.
- In the Bitconnect line plot, each spike in volume shows the hike in price
- Also, the plunged when there was an enormous spike in volume of bitconnect we can say that as cost began dunking in the crypto Market individuals began selling increasingly more which caused an immense spike in volume and as Bitconnect was so reliant upon volume it smashed.
- Bitcoin and Ethereum had the option to support this dunk in cost since they are additionally subject to different elements seen above in the principle segment.
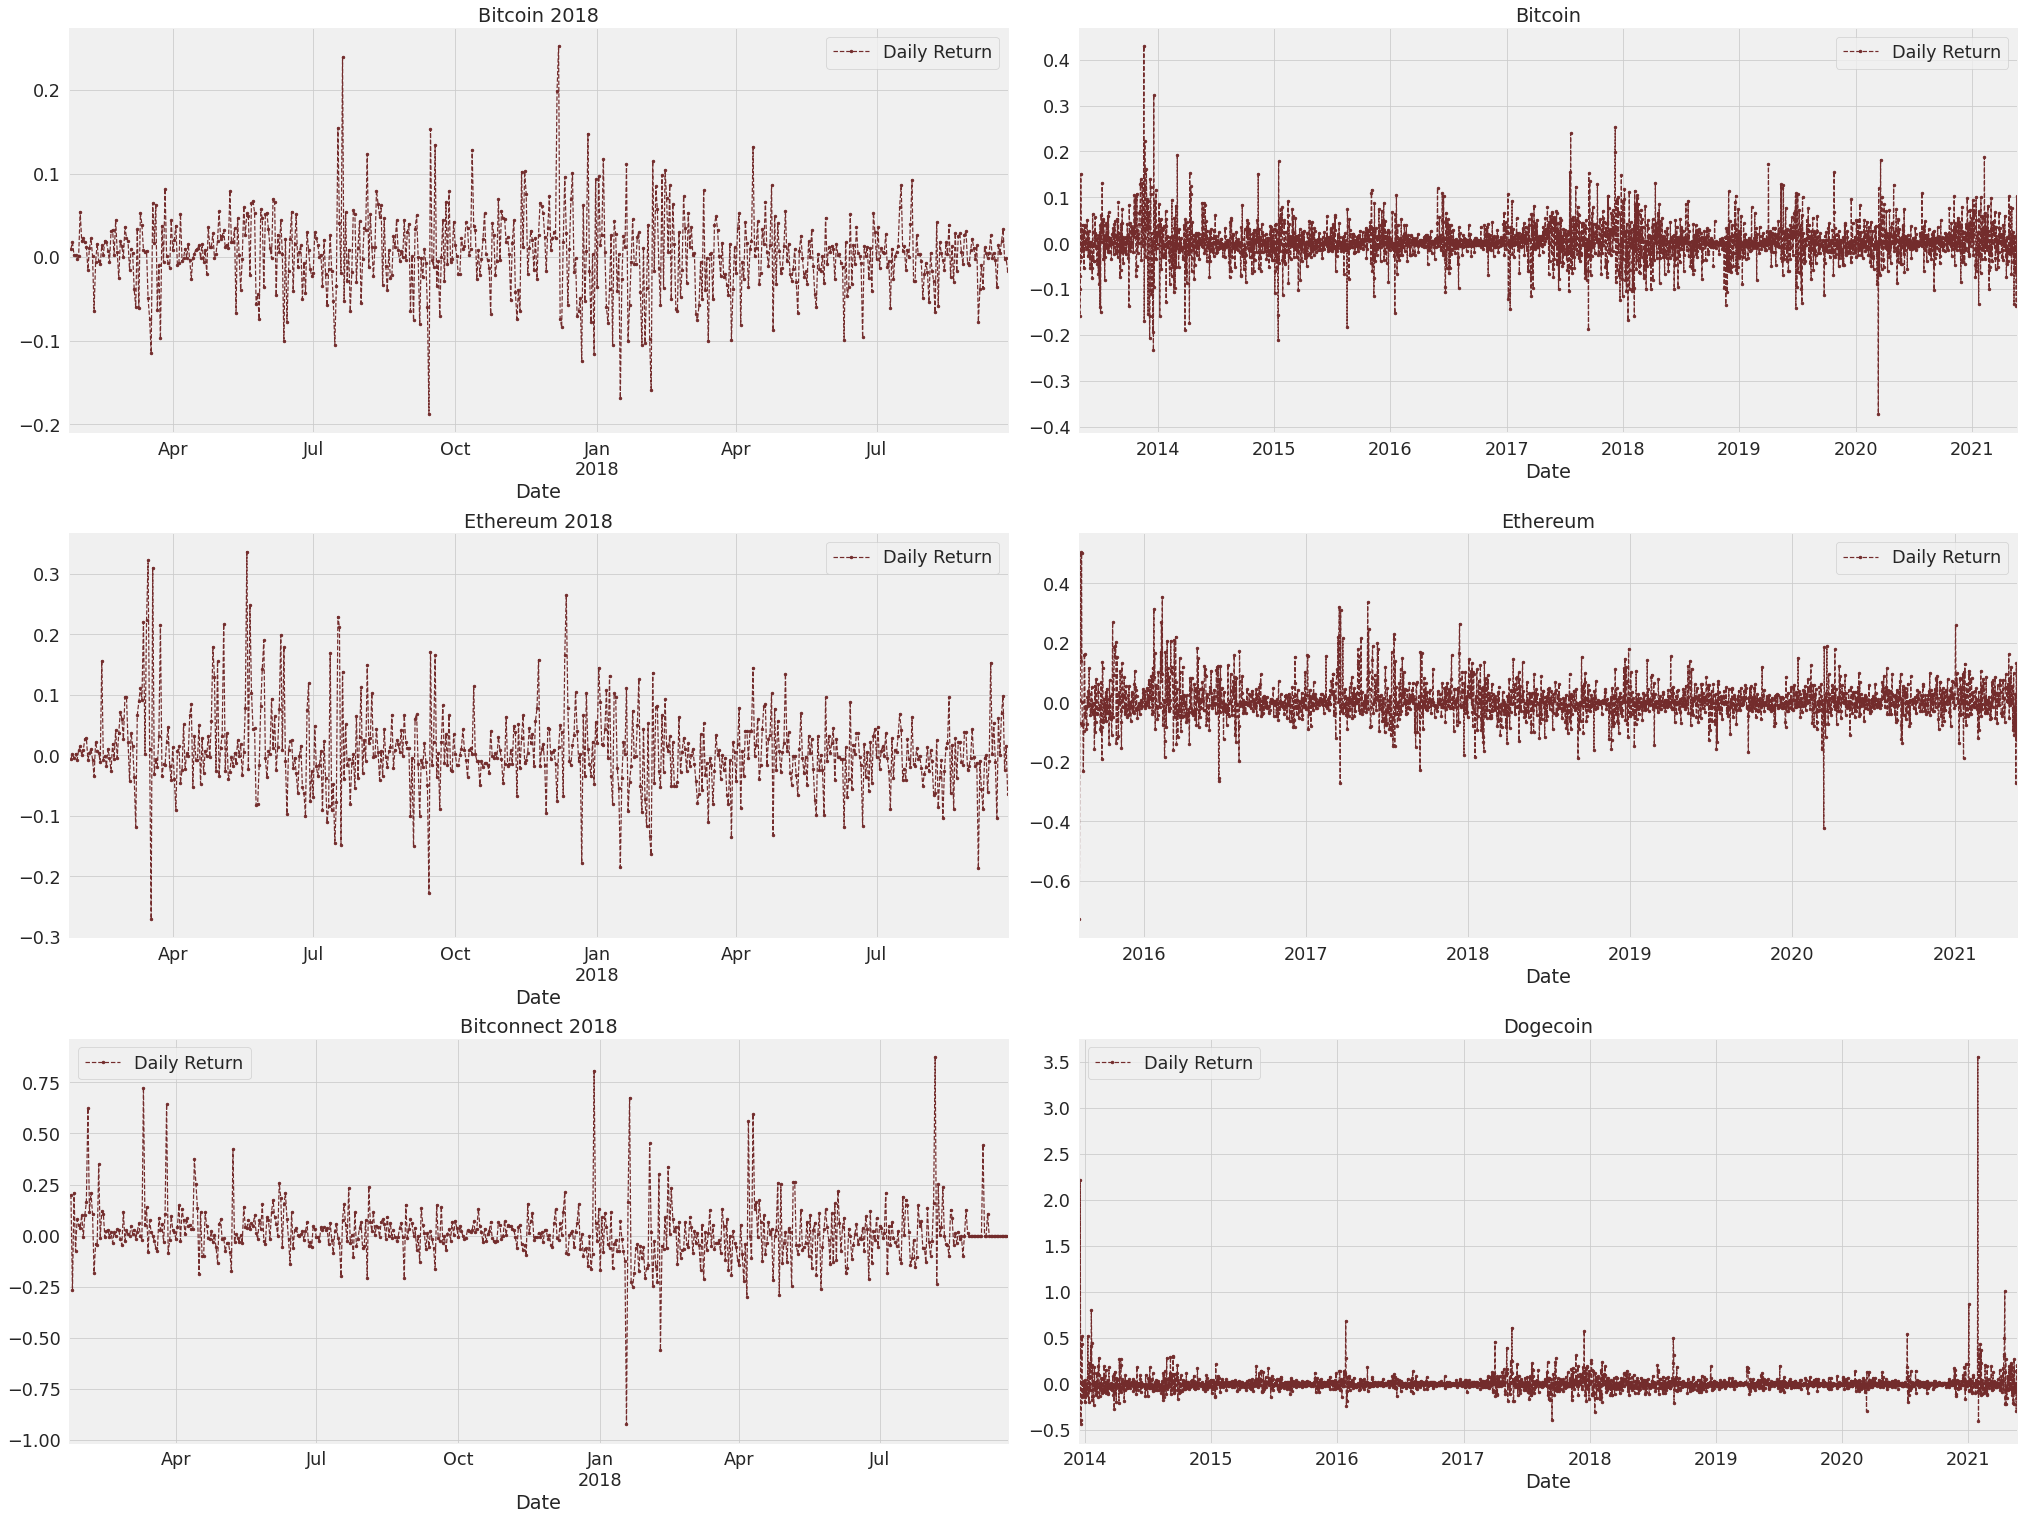
Returns: Percentage Change In Price
In this part, we will draw the line plots using the seaborn library to compare the return of different cryptocurrencies in 2018 vs 2020. Return in cryptocurrency is the percentage change in price. We are going to draw line plots for Bitcoin, Ethereum, and BitConnect and compare their volume in 2018 vs 2020. For line plots, we need to pass data, x-axis value, and y-axis value. Check the below code for more information on how to draw line plots for return year to year.
df in cryptoDf:
df['Daily Return'] = df['Close'].pct_change()
fig, axs = plt.subplots(nrows=total_rows, ncols=total_cols,
                        figsize=(14*total_cols, 7*total_rows), constrained_layout=True)
for i, var in enumerate(crypto):
row = i//total_cols
pos = i % total_cols
cryptoDf[i]['Daily Return'].plot(ax=axs[row][pos], legend=True,color='#732C2C', linestyle='--', marker='.')
axs[row][pos].set_title(crypto[i])
fig, axs = plt.subplots(nrows=total_rows, ncols=total_cols,
                        figsize=(8*total_cols, 5*total_rows))
for i, var in enumerate(crypto):
row = i//total_cols
pos = i % total_cols
plot =sns.distplot(cryptoDf[i]['Daily Return'], bins=100, color='#732C2C',ax=axs[row][pos])
axs[row][pos].set_title(crypto[i])
plt.ylabel('Daily Return')
plt.tight_layout()
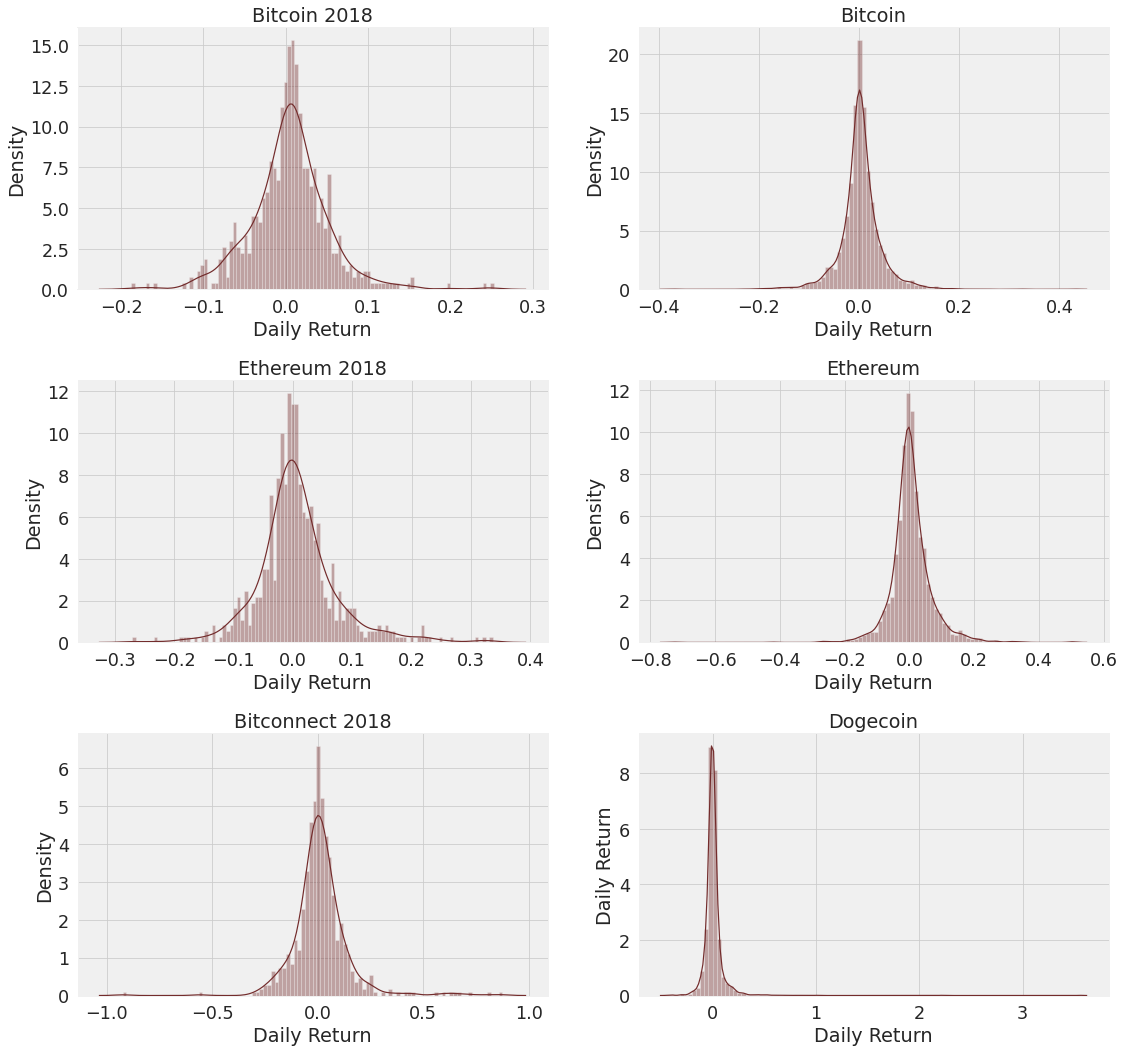
Observation
- Return changes drastically over time
- The movement of return is more in 2018 as compared to 2020
High-Low Values
In this section, we are going to draw high and low values in a single chart for different cryptocurrencies using Plotly. Check the below code for more information.
Famous Cryptocurrencies:
High-Low of Bitcoin
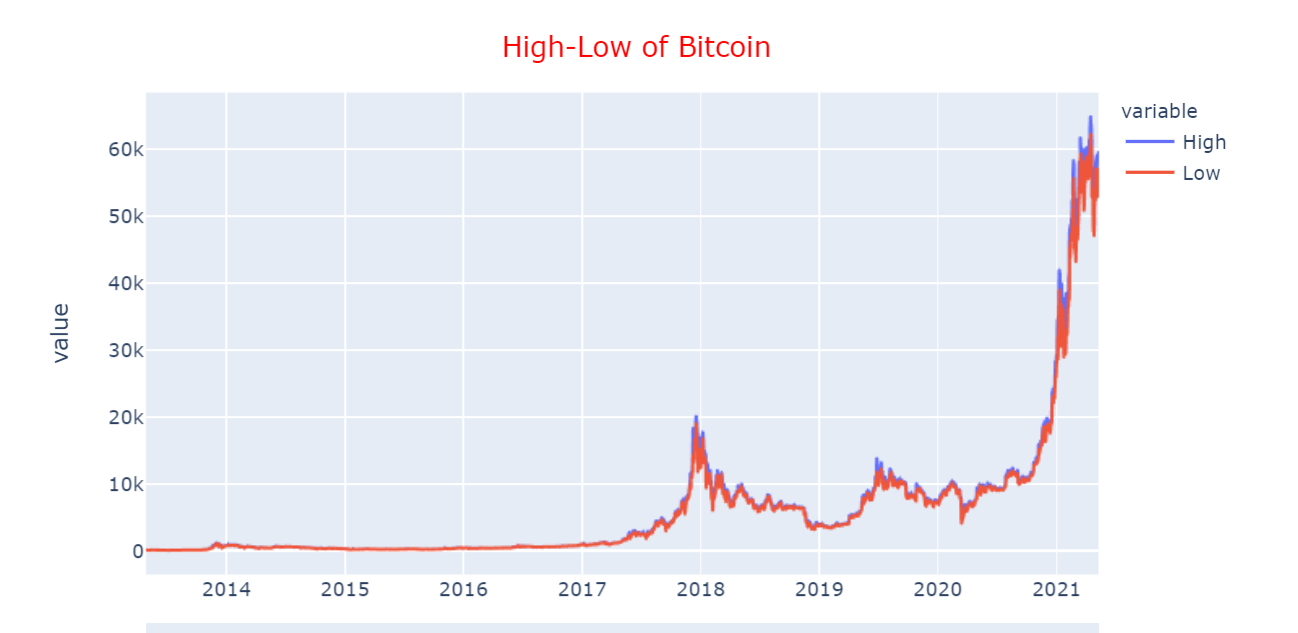
Observation
- Prices are continuously increasing from 2014 to 2020 having certain dips in 2018-2019
- Prices are highest in April 2021 at a value of $64.863k
High-Low of Ethereum

Observation
- Prices are highest in May 2021 at a value of $4197.47
- Prices are continuously increasing from 2016 to 2020 having certain dips in 2018-2019
High-Low of Litecoin
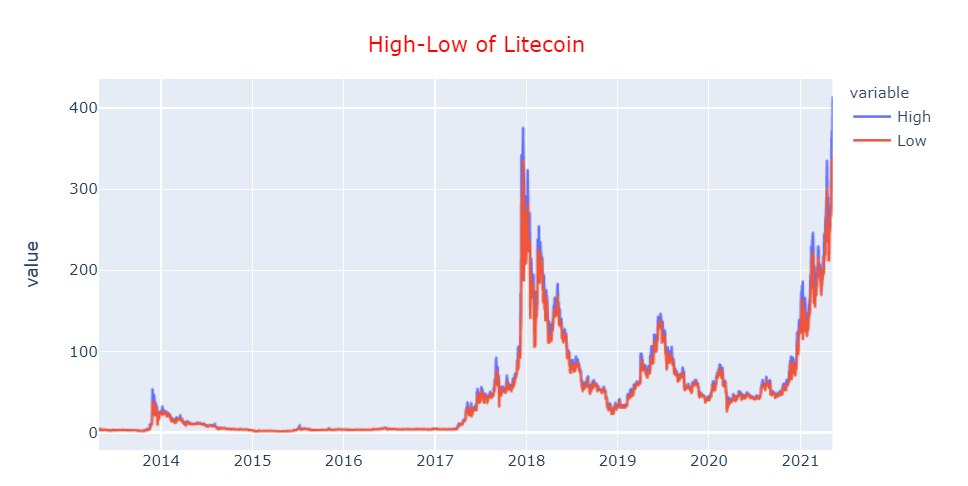
Observation
- Prices are increasing and decreasing. No continuous trend
- Prices are highest in May 2021 at a value of $412.96
Meme Cryptocurrencies
High-Low of Dogecoin
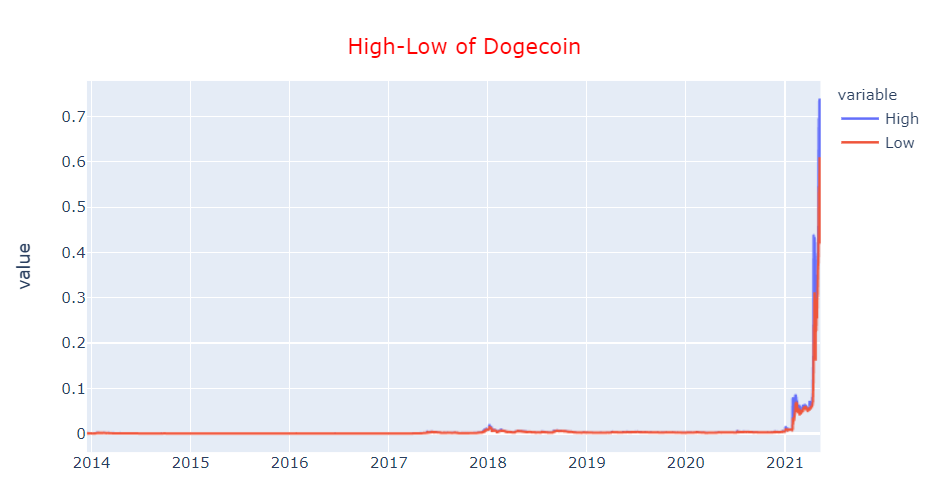
Observation
- Prices are highest on 16 April 2021 at a value of $69.41
- Showing a downward trend in May 2021, Prices drops to $16.51 on 16 May 2021
High-Low of Monacoins
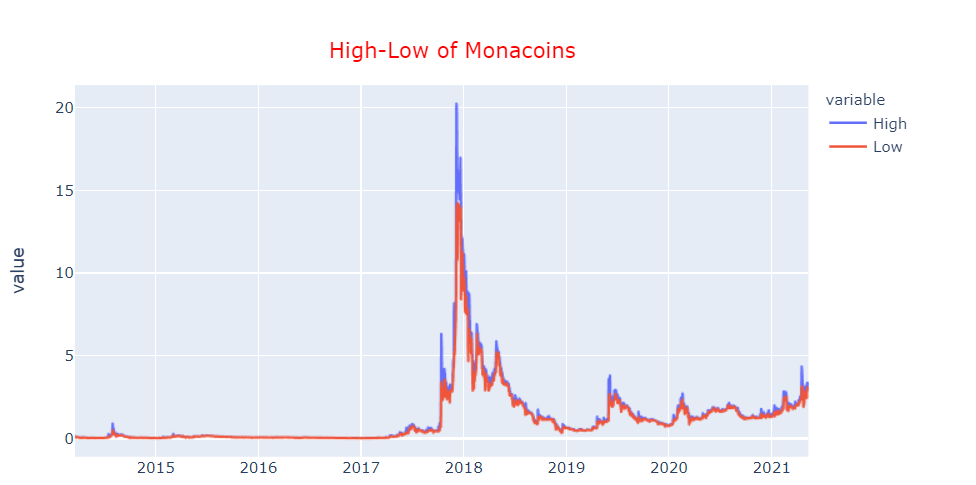
Observation
- Prices were highest in Dec 2017 at a value of $20.23
- Prices are continuously dropping, $1.89 on April 2021
Conclusion
We can finish up the responses to the most acclaimed question. Is Dogecoin another Bitcoin? or on the other hand, Dogecoin will supplant Bitcoin ever? Ans is no from the diagrams we can unmistakably see that Ethereum and Bitcoin are a considerable amount more secure than Dogecoin and Bitconnect.
Which is the reason they are enduring the fall in 2018 and will get by through the current dunk in cost as well. The fall of dogecoin is inescapable. Although Dogecoin isn’t a scam. However, the social design of dogecoin burrows a grave for itself. Put away your cash astutely after doing your own examination.
End Notes
So in this article, we had a detailed discussion on Different Cryptocurrencies. Hope you learn something from this blog and it will help you in the future. Thanks for reading and your patience. Good luck!
You can check my articles here: Articles
Email id: [email protected]
Connect with me on LinkedIn: LinkedIn.
The media shown in this article are not owned by Analytics Vidhya and are used at the Author’s discretion.
Akshay Gupta
29 Aug, 2022


Thank you so much for compiling these "crypto" you have covered almost everything. i am also doing kinda same work. please spare some time suggestion me improvement. i am very happy see your growth in google. thank you
Thank you for sharing this article. Can you please share all information about bitcoin?